Abstract
PURPOSE Our purpose was to investigate the relationship between intake of excess free fructose beverages and allergy among children and adolescents.
METHODS We analyzed data of 860 children (aged 6 to 12 years) and 1,142 adolescents (aged 13 to 19 years) from the National Health and Nutrition Examination Survey 2005-2006. Logistic regression analyses were performed to determine the associations between consumption of excess free fructose beverages and allergic symptoms or allergic sensitization.
RESULTS The pattern of findings was not entirely consistent, but some analyses supported the hypothesis of an association between intake of excess free fructose beverages and allergy. After controlling for the potential confounders, children who consumed nondiet fruit drinks at least 5 times per week had a nearly 2.5-fold greater odds of allergic sensitization than did those who consumed such drinks only 1 to 3 times per month (OR = 2.446; 95% CI, 1.583-3.780). Adolescents who consumed excess free fructose beverages at least 5 times per week or 1 to 4 times per week had about fivefold greater odds of presence of allergic symptoms than did those who seldom consumed these beverages (OR = 5.164; 95% CI, 1.866-14.297 and OR = 4.112; 95% CI, 1.857-9.107, respectively). Adolescents who consumed apple juice at least 5 times per week had a twofold greater odds of presence of allergic sensitization than did the seldom consumers (OR = 2.215; 95% CI, 1.178-4.164).
CONCLUSIONS These findings provide some support for the hypothesis of a link between intake of excess free fructose beverages and allergic symptoms or allergic sensitization in children and adolescents.
The incidence of childhood allergies has been steadily increasing, with far-reaching health and economic consequences. According to a Centers for Disease Control and Prevention (CDC) report, the prevalence of food allergies among children from birth to 17 years rose from 3.4% in 1997-1999 to 12.5% in 2009-2011.1 A 2013 study reported that the annual average cost of care for a child with an allergy was $4,184, and the annual cost per year for treatment of childhood food-related allergies in the United States was $248 billion.2 Globally, 3 million individuals of all ages have asthma, and 4 million are diagnosed with allergic rhinitis.3
Although much research has explored the causes and mechanisms of asthma among children, far fewer studies have addressed food-related allergies among children and adolescents. One promising area of research involves establishing a connection between exposure to intake of excess free fructose in foods and beverages and subsequent development of childhood allergies. A growing body of evidence indicates that excess free fructose consumption in foods and beverages is directly linked to an increased risk for metabolic disease.4,5
The sweetener high-fructose corn syrup is found in thousands of foods and beverages, mostly throughout the United States and other Western countries. In addition, the amount of dietary fructose being consumed is steadily increasing, particularly among younger populations. High-fructose corn syrup can be manufactured to have variable amounts of fructose and is available in concentrations of up to 90%.6,7 Data from the National Health and Nutrition Examination Survey (NHANES) III study (1988-1994) of 21,483 adults and children aged 2 years or older showed that daily fructose consumption increased dramatically during the study years. For example, from 1988 to 1994, mean daily fructose intake was 54.7 g/d (10.2% of total daily caloric intake), compared with 37 g/d (8% of total daily caloric intake) from 1977 to 1978. Fructose consumption was highest among adolescents aged 12 to 18 years (72.8 g/d, or 12.1% of total daily calories). The results also indicated that by 1994 more than 10% of Americans’ daily calories came from fructose.8
DeChristopher et al were among the first investigators to connect the intake of apple juice, fruit drinks, and soda with the increasing incidence of asthma in US children aged 2 to 9 years.9,10 Using data from NHANES 2003-2006, the authors showed that higher intake of excess free fructose beverages was significantly associated with the development of asthma in children aged 2 to 9 years. Thus, intake of high free fructose beverages, such as apple juice and beverages sweetened with high-fructose corn syrup were tied to a higher incidence of asthma among children. Importantly, the NHANES 2003-2004 survey did not include a specific questionnaire on allergic symptoms. Such a questionnaire that specifically examined allergic symptoms was not included until NHANES 2005-2006.
Moderate fructose consumption, or up to 50 g/d (about 10% of daily energy intake), is believed to have no adverse effects on lipid and glucose control, and consuming up to 100 g/d does not affect body weight.11 The most common way to measure fructose in foods and beverages is by mass spectrometry with combined liquid and gas chromatography. Kits to measure D-fructose and D-glucose in foods, originally developed for measuring sugars in wines, are also widely available.
According to Walker et al, there are no legal requirements that food labels provide information on glucose content in foods and beverages made with high-fructose corn syrup, fruit juice concentrate, or crystalline fructose, all ingredients that are increasingly being added to foods and beverages. Lower costs and easy commercial use are 2 reasons that the percentage of high-fructose corn syrup continues to rise in foods, soft drinks, and fruit juices.12,13 Fruit juices are a common and often overlooked source of high-fructose corn syrup. Apple juice is one of very few foods that contain fructose in a relatively high proportion to glucose (approximately a 2:1 ratio).14 In contrast, orange juice contains an approximately 1:1 ratio of fructose to glucose.
To augment results of earlier studies linking consumption of excess free fructose beverages and asthma in children, we designed a study to specifically investigate possible associations between allergic sensitization and the consumption excess free fructose beverages among children and adolescents.
METHODS
Data Source
We used data from the Centers for Disease Control and Prevention (CDC) and the National Center for Health Statistics (NCHS) for NHANES 2005-2006. We selected data only from the 2005-2006 survey, because this data cycle uniquely included a questionnaire on allergic symptoms and serum immunoglobulin E (IgE) testing.15
Because all NHANES data are deidentified, analysis of the data does not require institutional board review board approval or informed consent by all participants.
Study Population
A total of 10,348 participants were included in NHANES 2005-2006. We limited our analysis to 3,433 children (aged 6 to 12 years) and adolescents (aged 13 to 19 years) with recent allergic symptoms. Those participants without NHANES Food Frequency Questionnaire sample weight data were excluded. The final study group included 860 children and 1,142 adolescents. We separated the participants into groups of children and adolescents because adolescents are assumed to have greater accessibility to beverages and thus may have greater exposure to excess free fructose than children.
Study Variables
The variables obtained for each participant included demographic data (age, sex, race/ethnicity), associated diseases (current asthma or history of asthma), lifestyle factors (body mass index [BMI, kg/m2], a history of smoking, secondhand smoke in the household, physical activity), and dietary nutrients (total daily sugar, sodium, fiber, folate, vitamins A, C, D, E, B6, and B12).16,17
Dietary Nutrients
Information about daily intake of sugars and micronutrients was obtained during in-person interviews conducted by NHANES investigators.18 Detailed dietary intake information for the 24 hours before the interview was extracted, and total daily intake of sugars and other micronutrient data (sodium, fiber, folate, and vitamins A, C, E, B6, and B12) were collected and treated as continuous variables.
Excess Free Fructose Beverages
During in-person interviews, NHANES investigators used the Food Frequency Questionnaire to collect information on patterns of food and food group consumption for each individual during the previous 12 months.18 All questions for very young participants were answered on their behalf by their parents or guardians.
For our study, we concentrated on fructose and extracted information on the frequency of intake of apple juice, other nondiet fruit drinks, and nondiet soft drinks. The average daily frequency of drinking nondiet soft drinks during the past year was calculated by adding individual values in the summer and the rest of the year. The NHANES specialized software (Diet*Calc, the National Cancer Institute) uses algorithms to assign frequencies to responses from the Food Frequency Questionnaire. Data on intake of excess free fructose beverages were combined as follows to establish new intervals for our analysis: intake of less than 1 to 3 times per month (includes none) as the reference group; intake 1 to 4 times per week; and intake of 5 times per week.
To analyze the combined effects of intake of excess free fructose beverages, the following algorithm from DeChristopher et al was used: Intake frequencies for apple juice, nondiet fruit drinks, and nondiet soft drinks were assigned a value of 0.0 for 1 or fewer times per month; 0.117 for 2 to 3 times per month; 0.357 for 1 to 4 times per week; and 1.0 for more 5 or more times per week.9,10 These values were combined to calculate average total daily intake of excess free fructose beverages. For our statistical analyses we further recoded 1 or fewer times per month and 2 to 3 times per month into a single category, resulting in 3 groups (≥1-3 times per month, 1-4 times per week, and ≥5 times per week).
Laboratory Measures
Serum vitamin D (25-hydroxyvitamin D) data were extracted based on “Vitamin D” from the NHANES Laboratory Data Protocol.19 For this study, the cutoff value of serum vitamin D was categorized into the following groups: sufficiency, 50-250 nmol/L; insufficiency, 30-50 nmol/L; deficiency, <30 nmol/L. C-reactive protein measurements were obtained from NHANES laboratory data. Detailed descriptions of these and other laboratory procedures can be found on the NHANES Web page.20
Allergic Symptoms
Data of allergic symptoms were obtained from the personal household interview data on common allergic diseases collected by the NHANES allergy component (prefix AGQ). Participants who answered yes to any of the following questions were defined as having allergic symptoms:
“During the past 12 months, have you had any allergy symptoms or an allergy attack?”
“During the past 12 months, have you had a problem with sneezing, or a runny, or blocked nose when you did not have a cold or the flu?”
“During the past 12 months, did a doctor or other health professional tell you that you have a sinus infection?”
“Have you ever had an itchy rash which was coming and going for at least 6 months?” with “Have you had this itchy rash at any time in the last 12 months?”
“During the past 12 months, have you had an episode of hay fever?”
Allergic Sensitization
Serum samples were analyzed for total and allergen-specific IgE using the ImmunoCAP 1000 System (Pharmacia Diagnostics). A detailed description of the laboratory method used can be found on the NHANES 2005-2006 Web page.20
Allergic sensitization was defined as a positive specific IgE response (≥0.35 kU/L) to at least 1 of the allergens tested (the individual had to have information for the full panel of 19 allergens from a previous study).21
Statistical Analysis
Demographic, lifestyle, dietary, and laboratory data were expressed as the weighted mean (standard error) for continuous variables, or as a weighted percentage for categorical variables. Differences in categorical variables between the 2 study groups were determined using the Rao-Scott χ2 test,22 whereas differences in continuous variables were established with the Complex Samples General Linear Model (CSGLM) (IBM Corp). The CSGLM procedure performs linear regression analysis, as well as analysis of variance and covariance, for samples drawn by complex sampling methods.
Analysis was performed individually for the total of excess free fructose beverages consumed, which included apple juice, nondiet fruit drinks, and nondiet soft drinks. Univariate and multivariate logistic regression analyses were performed to determine the association between an individual’s beverage intake and allergic symptoms or allergic sensitization. All analyses included Food Frequency Questionnaire sample weights, strata, and primary sampling units, according to the recommendations from the NCHS. This approach addressed oversampling, nonresponse, and noncoverage, and it provided nationally representative estimates. All statistical assessments were 2-sided, and significance was established as P = .05. Statistical analyses were performed with the statistical software package SPSS complex sample module version 22.0 (IBM Corp).
RESULTS
A total of 10,348 participants were included in the NHANES 2005-2006 database. The initial sample population included 3,433 children (aged 6 to 12 years) and adolescents (aged 13 to 19 years) who had data of allergic symptoms. After excluding those who did not have Food Frequency Questionnaire sample weight data, a final group of 860 children and 1,142 adolescents were included in the analyses. Using NHANES Food Frequency Questionnaire sample weights, the analytic sample size (n = 2,002) was equivalent to a population-based sample size of 57,094,348 participants (27,722,581 children and 29,371,767 adolescents). Additional descriptive characteristics of the study participants are shown in Table 1.
Demographic and Basic Characteristics of Children and Adolescents From NHANES 2005-2006
Differences were seen between the 2 age-groups in allergic symptoms and allergic sensitization. Overall, 37.4% of the children and 42.7% of the adolescents had allergic symptoms, whereas 40.0% of the children and 43.9% of the adolescents had allergic sensitization.
Significant differences were also found between the 2 groups in smoking, secondhand smoke exposure, number of smokers in the home, and amounts of dietary sodium, total sugar, vitamins C, E, B6, B12, and folate, as well as serum vitamin D level.
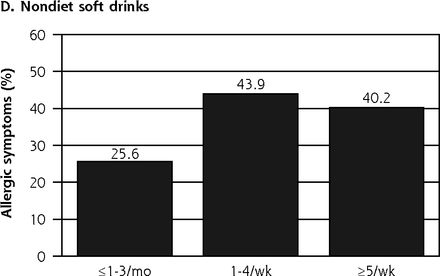
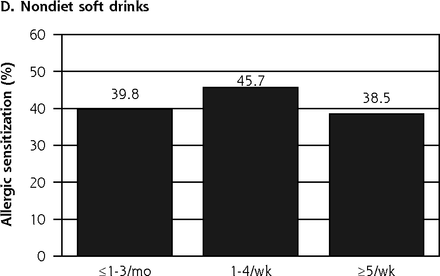
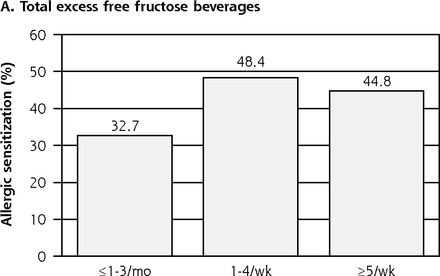
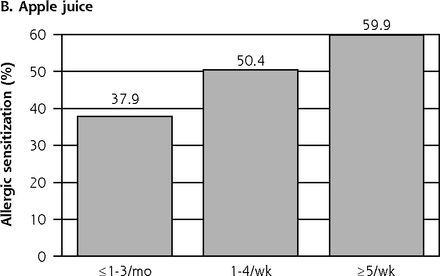
According to results from the Rao-Scott χ2 test, allergic symptoms in children were significantly associated with total consumption of excess free fructose beverages (P = .035) and intake of nondiet soft drinks (P = .012), but they were not associated with intakes of apple juice and nondiet fruit drinks alone (Figure 1). Allergic sensitization was associated with intake of nondiet fruit drinks in children (P < .001; Figure 2). Moreover, there was a statistically significant association between the allergic symptoms and total consumption of excess free fructose beverages (P = .005; Figure 3), as well as between allergic sensitization and apple juice intake (P = .001; Figure 4) in adolescents.
Allergic symptoms in children and consumption of excess free fructose beverages.
Note: Allergic symptoms in children were significantly associated with total excess free fructose beverage intake (P = .035) and nondiet soft drink intake (P = .012), but not with consumption of apple juice and nondiet fruit drinks alone.
Allergic sensitization in children and consumption of excess free fructose beverages.
Note: Allergic sensitization in children was significantly associated with nondiet fruit drink intake (P < .001).
Allergic symptoms in adolescents and consumption of excess free fructose beverages.
Note: Allergic symptoms in adolescents were significantly associated with total excess free fructose beverage intake (P = .005).
Allergic sensitization in adolescents and consumption of excess free fructose beverages.
Note: Allergic sensitization in adolescents was significantly associated with apple juice intake (P = .001).
Intake of excess free fructose beverages for children and adolescents is shown in Table 2. Overall there were no significant differences between children and adolescents in total intake of excess free fructose beverages, apple juice, and nondiet fruit drinks. A χ2 test did reveal significant differences, however, for nondiet soft drinks (P = .013). The percentage of adolescents who drank nondiet soft drinks 5 times or more per week was much higher than that of the percentage of children (73.2% vs 57.7%).
Intake of Excess Free Fructose Beverages for Children and Adolescents From NHANES 2005-2006
Table 3 shows the associations between consumption of excess free fructose beverages and allergic symptoms and allergic sensitization in children. After adjusting for age, sex, race, BMI z-score, cigarette smoking, secondhand smoke exposure, dietary nutrients including sodium, total sugars, vitamins A, C, E, B6, and B12, fiber, folate, C-reactive protein level, serum vitamin D level, asthma history and current asthma, excess free fructose beverage consumption (total excess free fructose beverages, apple juice, nondiet fruit drinks, and nondiet soft drinks) was not associated with allergic symptoms in children. After adjusting for the confounders, however, children who consumed nondiet fruit drinks at least 5 times per week had a nearly 2.5-fold greater odds of allergic sensitization than did those who consumed these beverages 1 to 3 times per month (OR = 2.446; 95% CI, 1.583-3.780).
Associations Between Intake of Excess Free Fructose Beverages and Allergic Symptoms and Sensitization in Children
The association between excess free fructose beverage consumption and allergic symptoms was stronger in adolescents after adjusting for age, sex, race, BMI z-score, smoking, secondhand smoke exposure, physical activity, dietary nutrients including sodium, total sugars, vitamin A, C, E, B6, B12, fiber, folate, C-reactive protein level, serum vitamin D level, asthma history, and current asthma. Adolescents who consumed excess free fructose beverages at least 5 times per week or 1 to 4 times per week had about fivefold greater odds of allergic symptoms than did those who consumed excess free fructose beverages only 1 to 3 times per month, after controlling for potential confounding variables (OR = 5.164; 95% CI, 1.866-14.297; and OR = 4.112; 95% CI, 1.857-9.107, respectively). In addition, adolescents who consumed apple juice at least 5 times per week had twofold greater odds of response of allergic sensitization than did those who consumed only 1 to 3 times per month after adjusting the confounders (OR = 2.215; 95% CI, 1.178-4.164) (Table 4).
Associations Between Intakes of Excess Free Fructose Beverages and Allergic Symptoms and Allergic Sensitization in Adolescents
DISCUSSION
The results of this study indicate a pattern suggesting there may be an association between allergic symptoms, allergic sensitization, and consumption of excess free fructose beverages. Because the findings do not show a consistent pattern, however, these results must be considered hypothesis generating rather than definitive.
Among children aged 6 to 12 years, those who were heavy consumers of nondiet fruit drinks had 2.5 times increased odds of having allergic sensitization compared with those who seldomly consumed nondiet fruit drinks. Among adolescents 13 to 19 years of age, the association was even stronger. Heavy consumers of apple juice had 2 times increased odds of having allergic sensitization than were seldom consumers. Heavy and moderate consumers of excess free fructose beverages had about 5 times and 4 times increased odds, respectively, of having allergic symptoms than did seldom consumers.
A number of previous studies have evaluated the link between consumption of sugary drinks and development of allergies during childhood and adolescence and have targeted fructose in particular. Why target fructose? Fructose is sweeter than glucose or sucrose, and in soft drinks and other sweet foods, fructose rewards sweet taste and delivers calories while providing little nutrition.23 Bovard also attributes the popularity of fructose partly to its sweetness, because fructose is approximately twice as sweet as glucose.24 In the context of foods containing high-fructose corn syrup, less fructose is required to achieve the same sweetness of sucrose—a key factor driving its popularity and status as a preferred sweetener among US food manufacturers. Walker and colleagues add that increasingly larger serving sizes, higher daily consumption rates of fruit juices, and the increasingly common use of fruit juice concentrate or high-fructose corn syrup in these products may cause a greater-than-expected daily intake of fructose. These authors tested a number of popular soft drinks, as well as fruit juices, to determine the fructose content.12 They found that commercial fruit juices, such as Minute Maid and Juicy Juice 100% Apple Juice, had the highest fructose-to-glucose ratios, and contained twice as much fructose as glucose.
The mechanisms by which high levels of excess free fructose ingestion may ultimately lead to development of food allergies among children and adolescents is still being debated. As mentioned earlier, DeChristopher and colleagues suggest that the association between asthma and intake of soft drinks may actually be caused by unpaired (excess) free fructose found in high-fructose corn syrup-containing drinks.9,10 In one study, using a rigorous food elimination diet, a method recommended by the National Institute of Allergy and Infectious Diseases to reliably assess food sensitivity,25 it was found that high-fructose corn syrup is associated with chronic airway mucus hypersecretion, chronic bronchitis, and asthma. This finding led to the fructositis hypothesis, suggesting that consumption of unpaired free fructose contributes to the in situ formation of proinflammatory advanced glycation end products resulting from fructose malabsorption. Fruit drinks are included in the hypothesis because sources of unpaired (excess) free fructose include apple juice, fruit drinks, apples, pears, watermelons, mangoes, and agave syrup.13 With high levels of unabsorbed fructose and favorable alkaline conditions in the upper intestine, unabsorbed fructose glycates partially digested dietary proteins and converts them into antigens, or in situ intestinal formation of advanced glycation end products (enFruAGEs). These antigens can then produce proinflammatory signaling, leading to airway mucus hypersecretion and promotion of respiratory symptoms.26
Glucose and fructose are metabolized differently. Absorbed fructose is extracted by and held and processed in the liver. Glucose absorbed or produced in the liver from fructose or other precursors is either metabolized in the liver or exported to the blood-stream and also to extrahepatic tissues. According to Bray, fructose is poorly absorbed from the gastrointestinal tract and almost entirely cleared by the liver, and by phosphorylation, which bypasses the limiting phosphofructokinase step, and hepatic processing of fructose favors lipogenesis.23 Several authors have found changes in circulating lipids among participants ingesting high-fructose diets.11,26,27 To track the metabolic route of dietary fructose, Sun and Empie used isotopic tracer labeling and reviewed the literature as well.28 These authors found that a substantial amount of ingested fructose is oxidized by the body to produce energy. Under resting conditions fructose may be preferentially or similarly used to produce energy as glucose, whereas under exercise conditions, glucose seemed to be more preferentially used to produce energy. When fructose and glucose are ingested together, the mixed sugars are oxidized faster than either alone. Sun and Empie also noted that fructose metabolism may be very different between normal and obese individuals. Much remains to be investigated, including the mechanisms for the small amount of fructose (1%) that is directly converted to plasma triglycerides.
Another team of researchers has proposed a “false-alarm” hypothesis for the connection between high-fructose ingestion and development of food allergies. In this hypothesis, advanced glycation end products derived from cooked meats, oils, and cheeses, as well as highly concentrated sugars, lead to a misinterpretation of a threat from dietary allergens, promoting development of food allergy.29 Thus, according to Smith et al, dietary advanced glycation end products and advanced-glycation end-product–forming sugars or other alarmins might be the missing link between current models of food allergy and the dramatic increase in food allergy in Western countries.”
Strengths and Limitations
To our knowledge, this study is the first to investigate the link between excess free fructose beverage consumption and childhood allergy. One strength of our study was the use of the NHANES database. This benchmark national health survey is one of the few population-based surveys available. Investigators are rigorously trained, and specific collection of data ensures high response rates from participants. Because this analysis was conducted using a nationally representative sample, our results could be generalized to the entire US population. Our study did have a few limitations. Because it was a cross-sectional analysis, we could not make any inferences on causality. In addition, interview (questionnaire) data are based on self-report, which may be influenced by recall problems, misunderstanding of questions, and a variety of other factors. Importantly, the lack of a convincing dose-response effect, as well as the variable pattern of associations, including some associations that become nonsignificant in multivariable analyses, argue for caution in interpreting the causality of the observed associations, which also could be due to unmeasured confounding.
The general pattern of the findings provides some evidence for the hypothesis that there may be a link between intake of excess free fructose beverages and allergic symptoms and allergic sensitization in children and adolescents. The mechanisms point to the hypothesis that enFruAGE may be a contributor. Further longitudinal studies are needed to confirm the causality and to clarify the underlying mechanisms.
Acknowledgments
The authors wish to express their gratitude to the US National Center for Health Statistics for the creation of the National Health and Nutrition Examination Survey data.
Footnotes
↵* These authors contributed equally as co-first authors.
Conflicts of interest: authors report none.
Funding support: This study was supported by Capital Characteristic Key Project of Beijing Municipal Science and Technology Commission (no. Z161100000516006), the Clinical Support Foundation of Chinese PLA General Hospital (no.2016FC-ZHCG-1004), the Translational Medicine Project of Chinese PLA General Hospital (2017TM-020), and the Foundation of National Clinical Research Center for Geriatric Disease (NCRCG-PLAGH-2017011).
Disclaimer: The authors are aware that it is their sole responsibility to interpret and report these data.
- Received for publication September 5, 2017.
- Revision received April 24, 2018.
- Accepted for publication May 17, 2018.
- © 2018 Annals of Family Medicine, Inc.


