Article Text

Abstract
Aim: To determine whether the Framingham function accurately predicts the 10 year risk of coronary disease and to adapt this predictive method to the characteristics of a Spanish population.
Method and Results: A Framingham function for predicting 10 year coronary deaths and non-fatal myocardial infarction was applied to the population of the province of Gerona, Spain, where the cumulated incidence rate of myocardial infarction has been determined since 1988 by a specific registry. The prevalence of cardiovascular risk factors in this region of Spain was established in 1995 by a cross sectional study on a representative sample of 1748 people. The number of cases estimated by the Framingham function for 10 year coronary deaths and non-fatal myocardial infarction was compared with that observed. The Framingham function estimated 2425 coronary heart disease cases in women and 1181 were observed. In men, 9919 were estimated and 3706 were observed. Recalibrating the Framingham equations to the event rate and the prevalence of the risk factors in Gerona led to estimates very close to the number of cases observed in Gerona men and women.
Conclusions: The Framingham function estimates more than doubled the actual risk of coronary disease observed in north east Spain. After calibration, the Framingham function became an effective method of estimating the risk in this region with low coronary heart disease incidence.
- incidence
- coronary heart disease
- risk factors
- MI, myocardial infarction
- CHD, coronary heart disease
Statistics from Altmetric.com
The incidence rate of myocardial infarction (MI) in Spain and other southern European countries is unexpectedly low given the high prevalence of cardiovascular risk factors.1–4 Nevertheless, this disease continues to be the leading cause of death in Spanish men and the third in women.5 The reasons for this paradox remain unclear. It has been hypothesised that regional factors may confer protection.6,7 Therefore, individual cardiovascular risk estimates provided by the functions based on classic risk factor prevalence and event rates used in the Framingham charts may overestimate the actual individual risk in Spanish subjects.6–10
The Seven Countries study has demonstrated that the southern Europe cohort presented a lower risk of fatal coronary heart disease (CHD) over 25 years than other European or USA cohorts.11,12 However, no quantitative estimates are available to adjust the results of CHD risk estimation to southern European populations. Regions such as the province of Gerona, Spain, in which MI incidence and attack rates have been monitored over a long period, provide an appropriate setting for assessing the utility of the Framingham function applied to southern European populations.
This study examines the accuracy of the Framingham function in predicting the 10 year coronary events rate in Gerona, a Mediterranean area with a low MI incidence rate, and adapts this predictive instrument for use in Spain.
METHODS
Since 1988, the REGICOR (Registre Gironí del Cor) MI population registry has been operating in Gerona, in the north east of Spain. The 1991 census recorded 280 865 residents aged 25 to 74 in the area. Medical facilities include one coronary care unit and seven local hospitals. Residents in the study area with suspected non-fatal MI or coronary deaths were investigated, and after 1996 those over 74 were also included.
Case finding included prospectively registering MI patients admitted to the only coronary care unit in the region, and screening discharge records of patients admitted to all hospitals and clinics in the area or referred outside the geographical area. Medical records of patients with death certificates containing 410–414 International Classification of Diseases 9th revision codes were reviewed to identify coronary deaths not detected by the other case finding procedures. Physicians who signed the death certificate, relatives of the deceased, and witnesses at the time of death were interviewed as necessary to complete the information on a case.
Each case was classified according to the MONICA algorithm.13 Type of symptoms, electrocardiographic findings, and cardiac enzyme values determined the diagnosis of non-fatal MI. These criteria and history of CHD and necropsy findings in coronary deaths yielded the following diagnostic categories: fatal and non-fatal definite, and fatal possible or insufficient data cases.
A cross sectional survey was conducted on 1748 participants (72% response rate) aged 25 to 74 randomly selected from the population of Gerona, Spain in 1995. All established major cardiovascular risk factors were measured by standard methods.4
Participants were considered to be diabetic if they had been diagnosed with diabetes, were following a diabetic diet, or taking medications such as oral agents or insulin. Persons with a fasting glucose level >139 mg/dl were also considered diabetic. Participants were considered smokers when they reported smoking ⩾1 cigarette per day, and hypertensive if they were taking anti-hypertensive therapy or had a blood pressure ⩾140/90 mmHg.
Sex by age (10 year groups) subgroups were established in the whole population based on the distribution observed in the random sample. Only subjects aged 35 to 74 were considered in this study.
The Framingham function to assess the 10 year risk of coronary death or non-fatal MI (hard CHD) event in initially cardiovascular disease free subjects13 (table 1) was used. This function was based on previously published functions8 used in 10 year individual risk charts in the industrialised world 10,14–17 (see appendix). The classic Framingham function8 was not used, as total CHD also includes angina and coronary insufficiency, vascular events not considered in the Gerona registry.
Cox regression coefficients and 95% confidence intervals (95% CI) for the risk factors included in the Framingham functions for 10 year incidence of coronary deaths and recognised non-fatal myocardial infarction (hard end points) by sex
The expected number of 10 year hard CHD events in each sex by age group in the Gerona population was estimated using the means of the risk factors in those groups in the Framingham hard CHD equations, and was compared with the number observed in the MI population registry. The observed number of cases used in the comparisons was derived from the annual MI incidence between 1990 and 1997. MI cumulated incidence was averaged between each age group and the next for each particular 10 year age group to simulate a 10 year follow up.
Statistical analysis
Statistical analysis consisted on description of rates per 100 000 inhabitants. Annual population variation was described by the coefficient of variation (that is, standard deviation to mean ratio). Firstly, the Framingham prediction functions were used with the underlying CHD event rate and the means of the risk factor (that is, the mean age and the proportion of population in each level of the risk factors) observed in Framingham. To calculate the 10 year risk for a particular individual, three elements are necessary: the means of the risk factors and the average 10 year CHD event rate in the target population, and the regression coefficients from the risk function. The recalibration procedure consists of replacing the Framingham means of the risk factors and the average event rate by those of the target population,13 under the assumption that the effects of the risk factors are reasonably universal.11,12 (See appendix and table 1). The estimated numbers of events were compared with those observed for men and women. Microsoft Excel and SPSS packages were used for spreadsheet and statistical analysis, respectively.
RESULTS
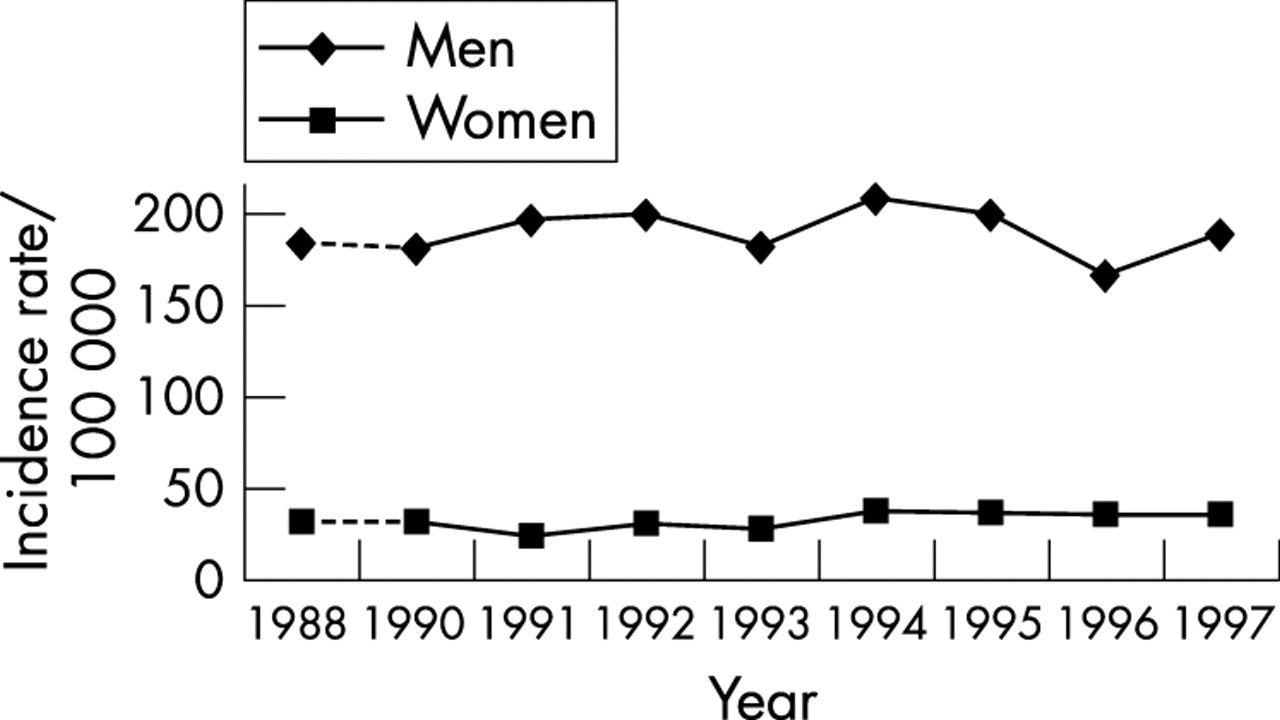
No statistically significant variation was observed in the MI cumulated incidence rate between 1990 and 1997 in Gerona (fig 1). The average yearly MI attack rate was 349/100 000 men aged 35 to 74 years and 109/100 000 women of the same age group. The coefficient of variation of the population over the 10 year study period was very low (4.2%). The risk factor prevalence in each sex and age group is shown in table 3.
Population prevalence of each level of the risk factors in Framingham, United States and Gerona, Spain by sex
Risk factor prevalence in population aged 35 to 74 free of coronary heart disease in Gerona (1995)
Coronary deaths and non-fatal myocardial infarction cumulated incidence in the population aged 35 to 64 in Gerona 1988–97.
The estimated number of coronary events by the Framingham function was 2425 in women while that observed was only 1181 (ratio 2.1). In men 9919 events were expected and only 3706 were observed (ratio 2.7). The ratio decreased with age in women, but remained steady in men (table 4).
Observed and expected cases of coronary deaths and non-fatal myocardial infarction in Gerona according to the average actual local myocardial infarction cumulated incidence rate 1990–97 and to the Framingham function, respectively, by age group and sex
After calibration adjustment of the Framingham prediction function using the CHD event rates and the means of the risk factors observed in Gerona, the expected figures closely matched the observed number of CHD events in women (1671, ratio 1.4) and men (3880, ratio 1.1). However, as shown in table 4, the estimated to observed ratio still differed from 1.0 in women. In men, the expected numbers were very close to the observed numbers of events.
DISCUSSION
Overestimation of CHD risk by the Framingham function was quantified in Gerona, Spain, where MI rates are low.1 The overestimation is of an order of magnitude of three in men and two in women aged 35–74. This finding confirms the results of a population study that showed that Framingham function also overestimated the coronary risk in Italy.18 However, a comparatively simple calibration procedure provides more accurate estimates of the individual MI risk with the Framingham function in our region.
In Spain, the prevalence of cardiovascular risk factors is high4 even when compared with Framingham19 and the MI incidence rate is low.1 Lifestyle and the interaction between genes and environmental factors may play a crucial part in determining these differences.20 Physical activity and intake of antioxidants is on average greater in Gerona than in the United States. These habits may counteract the effect of traditional cardiovascular risk factors.6 However, while the inclusion of additional risk factors might improve precision, the trade off in terms of additional data acquisition might not be worthwhile.
The risk functions derived from the Framingham experience can be transported to other regions where relative risks are similar, but absolute risks differ from Framingham. Although the estimated to observed ratio was consistently close to 1.0 across all age groups in men, the estimates exceeded 1.0 for women. This difference may be attributed to the low number of cases in younger age groups and the decreasing prevalence of smoking with age observed in women.4
The use of CHD prediction functions can be extended to many areas, but each area needs to carefully assess how well the estimates fit the local incidence of CHD. Without this assessment, overestimation might occur and lead to inappropriate treatment for CHD primary prevention. Functions and charts provide an estimate of what happens on average in people with similar cardiovascular risk factors, age, and sex. The correction proposed in this work adds precision to the CHD risk estimations in Spain, but does not indicate the best primary prevention approach in a particular patient. Such a strategy should be decided by taking into account the best evidence from clinical trials.
Characteristics, assumptions, and limitations of the study
In this study we assumed that the Gerona population has the same risk factor distribution as the random sample we studied in 1995. This assumption is acceptable because the participation rate was high in the 1995 study (72%).4 Another reasonable assumption was that the population in each age and sex range varied little over the 10 year study period as the variability was, as shown, very low. MI incidence rate was assumed to have remained steady over the past 10 years, which is true according to our own data (see fig 1) and those of other studies.21
We assumed the exposure of the Gerona population to risk factors to have been constant over the study period. Cardiovascular risk factor prevalence is not likely to have changed in the past 30 years according to existing surveys and cohort studies.4,22,23
To ensure that our correction did not underestimate the CHD risk, we made all calculations using a conservative approach: cumulated incidence rate (attack rate) was used rather than incidence rate, the <35 years age group was omitted, and our estimates of CHD risk (that is, coronary deaths and non-fatal MI) were for people who had not developed CHD symptoms. The “insufficient data” category was also included in the observed number of events.
Unrecognised Q-wave MI may represent a significant proportion of new CHD events, and Framingham has reported up to 28% of events in men and 35% of events in women.24 Similarly, angina pectoris represented 17% of initial CHD events in men and 27% of events in women.25 As these outcomes were included in the Framingham function8 but not in the Gerona registry, we used a specific function, which excluded angina in the end points, developed for this purpose with the Framingham data.
In conclusion, our results support the common impression among physicians that the Framingham function overestimates the risk of coronary events in Mediterranean countries of southern Europe. According to our data, the overestimation may be of an order of magnitude of three in men and two in women aged 35–74. We provide a relatively simple calibration procedure that may be used to estimate individual MI risk with the Framingham function in regions with MI incidence and risk factor prevalence similar to those of Gerona, Spain.
APPENDIX
Recalibration of the Framingham Functions
To recalibrate the Framingham function to Gerona, we need the population prevalence for the cardiovascular risk factors used in the Framingham function and the average survival (CHD free event rate) for Gerona. Below we illustrate how we obtain the recalibration.
Comparison Between Framingham and Gerona
In table 1 we provide the coefficients of the Framingham functions for men and women. In addition, we display the means of each of the risk factors in the Framingham men and women along with the means of the risk factors in the Gerona men and women. The 10 year event rates for Framingham and Gerona men are shown at the bottom of table 2.
The men in the Gerona sample were older than the Framingham men, they had higher total cholesterol levels, higher HDL cholesterol levels, higher blood pressure, a higher proportion were diabetic, and a slightly higher proportion smoked. The 10 year average event rate was 0.057 in Framingham and 0.035 in Gerona. Below we illustrate how to use the function directly and then how to recalibrate. We do this with specific examples.
Using the Framingham functions directly to estimate risk
The Framingham functions are used as follows to generate estimates of 10 year risk of hard CHD.

where S(t) is the 10 year average rate free of hard CHD (that is, 1−event rate at 10 years =1−P(10/Ẋ)),
βi are the Cox regression coefficients for each level of each risk factor,
Xi are the values of the risk factors for a given patient, and
Ẋi are the means of the risk factors.
We now estimate the 10 year risk for a diabetic, non-smoking man aged 50 with a total cholesterol of 210, HDL of 52, and high normal blood pressure using the Framingham functions directly (that is, using the Framingham means of the risk factors and the Framingham CHD event rate). In the following we break the computation into parts. With the exception of age, which is entered into the computations in years, the remaining risk factor categories are indicated by 1 for the specific category of interest and 0 otherwise. Firstly, we compute the following for this risk factor profile:

Now using the means (in this case the proportions of Framingham men in each risk factor category, except for age in which case we use the mean age) for each of the risk factors:


Next,

Then, the average 10 year Framingham probability of not developing hard CHD is 0.943: S(t=10 years)=1−0.057=0.943.
The risk estimate is

Recalibrating the Framingham functions
Now, application of a prediction function computed in one setting to another may not be possible until calibration adjustments for mean levels of risk factors (Ẋi) and event rates (S(10 years)) are made. For Cox regression these adjustments are equivalent to replacing the Framingham means of the risk factors (Ẋ1, . . .,Ẋp) and the Framingham event rate in the Framingham Cox regression models with those of Gerona. S(t) is the Framingham Study’s average event rate at time t (we use 10 years) or, more precisely, the probability of not developing CHD at the mean age and values of the risk factors.
Example of recalibration
In the following we again estimate 10 ten year risk for a diabetic, non-smoking man age 50 with a total cholesterol of 210, HDL of 52 and high normal blood pressure using the Framingham functions replacing the Framingham means of the risk factors by those observed in the Gerona study and replacing the Framingham survival rate by that observed in Gerona. Again, we break the computation into parts. Firstly, we compute the following for this risk factor profile (this is, identical to that shown above):

Now using the means of the risk factors from Gerona:


Next,

Then, the average 10 year Gerona probability of not developing hard CHD is 0.965:

The risk estimate is

Note that the recalibrated 10 year risk estimate is approximately two thirds that produced by the Framingham function without recalibration.
Acknowledgments
The authors appreciate the comments of Drs MT Faixedas, JR Banegas, F Rodríguez-Artalejo, and I Rohlfs on an earlier version of this manuscript, and wish to thank Joan Vila for statistical analysis and advice, and C O’Hara for English revision of the manuscript.
REFERENCES
Footnotes
-
Funding: this project was supported by grant 99/226 from Commission for Cultural, Educational and Scientific Exchange between the United States of America and Spain, by grants FIS 93/0568, FIS 96/0026–01 and 94/0539 from the Fondo de Investigación Sanitaria and received partial support through grant CIRIT/1999 SGR 00234 of the Generalitat de Catalunya. R Elosua was supported by an award of Fulbright Program and Generalitat de Catalunya.
-
Conflicts of interest: none declared.