
Abstract
PURPOSE Current strategies for improving diet and activity patterns focus on encouraging patients to make better choices, but they meet with limited success. Because the choices people make depend on the choices they have, we examined how practical opportunities for diet and physical activity shape behavioral intentions and achieved behaviors.
METHODS Participants included 746 adults who visited 8 large primary care practices in the Residency Research Network of Texas in 2012. We used structural equation models to confirm factor structures for a previously validated measure of practical opportunities, and then modeled achieved diet (Starting the Conversation – Diet questionnaire), physical activity (International Physical Activity Questionnaire), and BMI as a function of opportunities (classified as either resources or conversion factors that influence use of resources), behavioral intentions, and demographic covariates.
RESULTS In path models, resources (P <.001) and conversion factors (P = .005) predicted behavioral intentions for activity. Conversion factors (P <.001), but not resources, predicted diet intentions. Both activity resources (P = .01) and conversion factors (P <.001) were positively associated with weekly activity minutes. Diet conversion factors (P <.001), but not diet resources (P = .08), were positively associated with diet quality. The same patterns were observed for body mass index (BMI). Socioeconomic gradients in resources and conversion factors were evident.
CONCLUSIONS Individuals’ feasible opportunities for healthy diet and activity have clinically meaningful associations with intentions, achieved behaviors, and BMI. Assessing opportunities as part of health behavior management could lead to more effective, efficient, and compassionate interventions.
INTRODUCTION
Global shifts in diet and physical activity patterns1 have sharply increased obesity prevalence over the past 30 years2 and are leading causes of preventable morbidity and mortality.3,4 Effective population and clinical interventions offer great potential to reduce this burden, yet progress has been slow because behaviors are shaped by a complex set of multilevel determinants.5 Despite the complex genesis of behaviors, clinical assessment and intervention has narrowly focused on individuals’ behavioral intentions and motivation,6,7 with modest success.8 As a result, clinicians have limited confidence in their ability to manage obesity and its linked behaviors,9,10 leading to declining rates of diagnosis and treatment.11
Taking a perspective beyond individual decision making can lead to new interventions. Diet and activity choices emerge from what people find it feasible to do in their daily lives.12,13 When people have few opportunities, they often adjust their expectations downward, so that what appears to be poor motivation may be a logical response to a difficult environment.14 Evaluating opportunity is therefore necessary to an understanding of the connections among environmental contexts, personal factors, behavioral intentions, and achieved behaviors. Conversely, framing behaviors as decontextualized “lifestyles”15 risks missing important determinants of health behavior.
In previous papers, we offered a theoretical16 and empirical case17 for examining health behavior using the capability approach,18 a theory of social justice that focuses on people’s opportunities to achieve the goals they value. Its proponents argue that opportunities are what societies should strive to equalize in promoting human well-being and in correcting deprivations and inequalities.19 The capability approach offers an empirical framework for evaluating practical opportunities as indicators of individual and social well-being. Measures of practical opportunities include resources (income, locally available goods and services, etc) and specific conversion factors (health literacy, autonomy, health status, etc) that influence the use of resources.20
This paper has 2 objectives. First, we seek to confirm a previously derived measurement model of practical opportunities for healthy diet and physical activity. While the model was previously evaluated in patients from a single practice,17 we now include patients from 8 large practices across Texas. Second, we explore whether the capability measures are consistent with hypothesized relationships in which practical opportunities influence behavioral intentions, diet, physical activity, and body mass index (BMI). Our aim is to evaluate the utility of this new tool in understanding the contexts for people’s choices when addressing health behaviors in clinical medicine or public health.
METHODS
We conducted the study in 2 stages. The first stage, a confirmatory factor analysis, evaluated construct validity of the capability measurement scales in a larger and more demographically diverse sample than in our previous study. The second stage, addressing criterion validity, evaluated hypothesized relationships between the capability scales and measures of diet, physical activity, and BMI.
Conceptual Model
The capability approach is a human development framework relatively new to clinical care and public health.21,22 It evaluates people’s substantive freedom to achieve the goals they value: what real opportunities (“capabilities”) they have, given their resources.18,23 Achieving goals depends on 2 important preconditions: sufficient autonomy to pursue one’s goals, and adequate opportunities to realize them. We used Robeyns’ capability model20 to structure our analyses, examining paths from opportunities to behavioral intentions to achieved behaviors.
Patient Population
We enrolled participants at 8 primary care practices in 6 cities through the Residency Research Network of Texas (RRNet). Five practices were affiliated with community-based family medicine teaching programs in Austin, Fort Worth, Harlingen, McAllen and San Antonio, and 3 were affiliated with academic health centers in San Antonio and Lubbock. At each site, student research assistants attempted to enroll 100 adult patients presenting for care over a 4-week period in 2012. The sample size was based on recommendations for factor analysis with a given number of factors and variables and the portion of the variables’ variance accounted for by the common factors.24 We included patients who were more than 18 years of age and spoke English or Spanish. The only criteria for exclusion were unwillingness to participate and cognitive impairment that precluded their completing questionnaires.
The study was approved by the Institutional Review Board at the University of Texas Health Science Center at San Antonio and other participating institutions that had independent review boards.
Measures
We measured practical opportunities for diet and physical activity with a 25-item survey, the Capability Assessment for Diet and Activity (CADA). We had developed the CADA through a community-based participatory process, qualitative work, and item development with residents of an economically disadvantaged Latino community.17 Following the capability approach, items assessed respondents’ perceptions of available resources for healthy diet and activity as well as personal circumstances that influenced their ability to access those resources.20,25 We also measured other constructs relevant to health behaviors and BMI, including behavioral intentions (“I plan to participate in regular physical activity ___ days a week” and “I plan to eat a healthy diet ___ days a week,” each scored 0 to 7), and perceived behavioral control.26 We assessed diet and physical activity using the Starting the Conversation (STC) diet instrument27 and the International Physical Activity Questionnaire (IPAQ).28 We chose these self-report measures because they are validated and feasible to administer in primary care settings.29 STC is a 7-item scale that quantifies servings or occasions per week of fast foods, snacks, sugared drinks, beans/chicken/fish, snack chips or crackers, desserts/sweets, and fats as a seasoning. Item responses are categorized into 3 levels: target behavior (3 points), need for improvement (2 points), and significant need for improvement (1 point). Thus, scores from 7 to 21 are possible. The IPAQ asks respondents to estimate time in the past week spent walking, in vigorous and moderate intensity activity, and in sedentary activity. Algorithms allow responses to be converted to estimates of whether recommended levels of weekly physical activity have been reached.
Height and weight were directly measured at the clinic visit and used to calculate BMI in kg/m2. Demographic covariates included age, sex, educational attainment, race/ethnicity, and monthly income.
As a statistically sound alternative to eliminating subjects with missing data, we used full information Maximum Likelihood as implemented in AMOS 16.0 (Amos Development Corporation)30 and Stata 13 (StataCorp).
Because of an error in distributing survey materials, the STC measure was omitted from the study packets at all but 2 sites. The sample size for analyses of diet quality is therefore reduced to 202. Because of this substantial missing data for the STC measure, we assessed 2 questions: first, whether respondent characteristics differed by response or non-response to the diet questions, and second, whether complete case analyses using only data from those respondents with non-missing diet data produced different results than analyses with imputed data. On both questions we observed minimal differences and therefore report results using imputed data.
Data Analysis
For the preliminary data analysis, we assessed all confirmatory factor analysis variables for skewness and kurtosis. We examined Mardia’s coefficient31 for multivariate normality.
Confirmatory factor analysis (construct validity) was based on a previously published principal components analysis17; 14 dietary items and 11 physical activity items were separately submitted to a confirmatory factor analysis (CFA) using structural equation modeling (SEM) with AMOS software. The scales and items are listed in Table 1. Four dietary factors (Convenience, Barriers, Knowledge, and Time) and 3 physical activity factors (Convenience, Neighborhood, and Barriers) were specified. The mean and variance of each factor was set to 0 and 1 respectively, allowing the factor loadings to be freely estimated. We estimated factor covariances and estimated residual covariances based on modification indices with a threshold value of 4.32 We assessed model fit for confirmatory factor analysis with the χ2 test (where failure to reject the null hypothesis indicates good fit), the Comparative Fit Index, and the Root Mean Square Error of Approximation.33
Descriptive Statistics and Confirmatory Factor Analysis Factor Loadings for CADA Variables
In subsequent models, we combined the first-order factors into 4 higher-order factors labeled diet resources, diet conversion factors, activity resources, and activity conversion factors (Table 1). We then evaluated criterion validity by examining whether the factors were positively associated with intentions for healthy diet and activity and negatively associated with BMI. We fit separate models for diet and physical activity. The diet model specified BMI as a function of diet resources, diet conversion factors, diet intentions, income, age, and a summary race/ethnicity variable. The physical activity model specified BMI as a function of activity resources, activity conversion factors, activity intentions, income, age, and race/ethnicity.
To assess relationships between capabilities, behavioral intentions, and achieved diet and physical activity, SEM was used to create 2 path models. The first predicted weekly moderate/vigorous physical activity minutes as a function of intentions to engage in physical activity (measured on a scale of 0 to 7 days per week), which in turn was a function of activity resources and conversion factors, age, sex, and income. We also examined a logistic structural equation model that predicted whether the respondent reached the Centers for Disease Control and Prevention (CDC) threshold of 150 activity minutes per week.34 The diet path model predicted score on the STC instrument as a function of intentions to consume a healthy diet, dietary resources, conversion factors, and demographics. We assessed model fit as described above.
RESULTS
Across the 8 sites, 746 patients were enrolled. The survey participation rate was 77%. Characteristics of the survey respondents are summarized in Table 2. The sample was predominantly female (67.7%), Hispanic (54.3%), and low income (with 49.8% earning less than $1,500/month).
Sample Characteristics
The confirmatory factor analysis verified the structure of the CADA scales in this new sample. Descriptive statistics for the CADA measures and factor loadings from the confirmatory factor analysis appear in Table 1. Table 3 displays regression estimates for CADA factors and covariates predicting BMI. A 1 standard deviation increase (0.6 on a 5-point scale) in the dietary conversion factor is associated with a one-half standard deviation lower BMI (4 kg/m2 less). This factor accounted for 14% of the variance in BMI.
Structural Equation Model Estimates of Dietary and Activity Resources and Conversion Factors Predicting BMI
Both activity conversion factors and activity resources were independently and inversely related to BMI. A 1 standard deviation increase in these factors (0.77 and 0.85 on a 5-point scale, respectively) each contributed approximately a one-fifth standard deviation decrease (1.6 kg/m2 less) in BMI. Together they explain 11% of the variance in BMI.
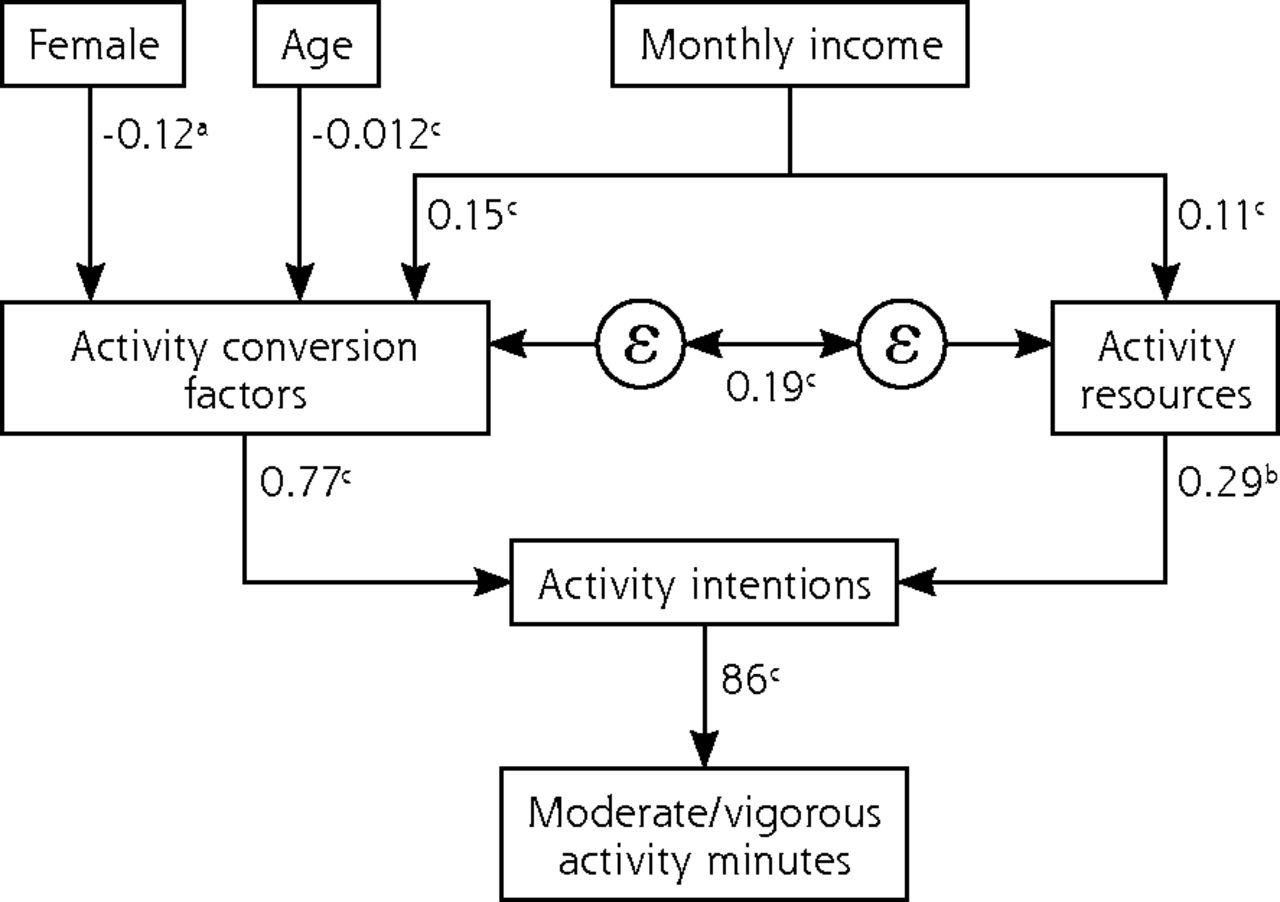
Figure 1a depicts the path model we created to evaluate the association of capabilities with recommended physical activity levels. Intentions (number of days per week intending to be active) strongly predicted the sum of weekly moderate and vigorous activity minutes (b = 0.86; P <.001). Intentions were predicted by activity resources (b = 0.29; P = .005) and, to a greater extent, conversion factors (b = 0.77; P <.001). Activity resources and conversion factors had substantial indirect effects (via intentions) on weekly activity minutes, corresponding to 25 extra activity minutes per week per 1 point increase in the resources scale (P = .005) and 66 extra minutes for each 1 point increase in the conversion factor scale (P <.001). Similar effect sizes were observed in a model predicting whether the subject achieved the CDC goal of 150 minutes of activity per week (data not shown).

Structural equation model predicting physical activity from CADA factors.
CADA = capability assessment for diet and activity; ε = correlated error
Note: Activity resources and activity conversion are scales from CADA instrument. Activity intentions is defined as the number of days the respondent intends to get physical activity in next week.
Moderate/vigorous activity minutes = sum of moderate+vigorous activity minutes as measured by the International Physical Activity Questionnaire.
n = 717
aP <.05
bP <.01
cP = .001
Model fit: Overall R2: 0.208. The model is just identified, so other fit statistics could not be calculated.
In the path model for STC score (Figure 1b), number of days per week intending to eat a healthy diet was strongly associated with STC score (b = 0.42; P <.001). Intentions were predicted by diet conversion factors (b = 1.2; P <.001) but not diet resources (b = 0.2; P = .50). The indirect effect of dietary conversion factors on STC was significant (b = 0.50; P <.001), but that of dietary resources was not (b = −0.06; P = .50).
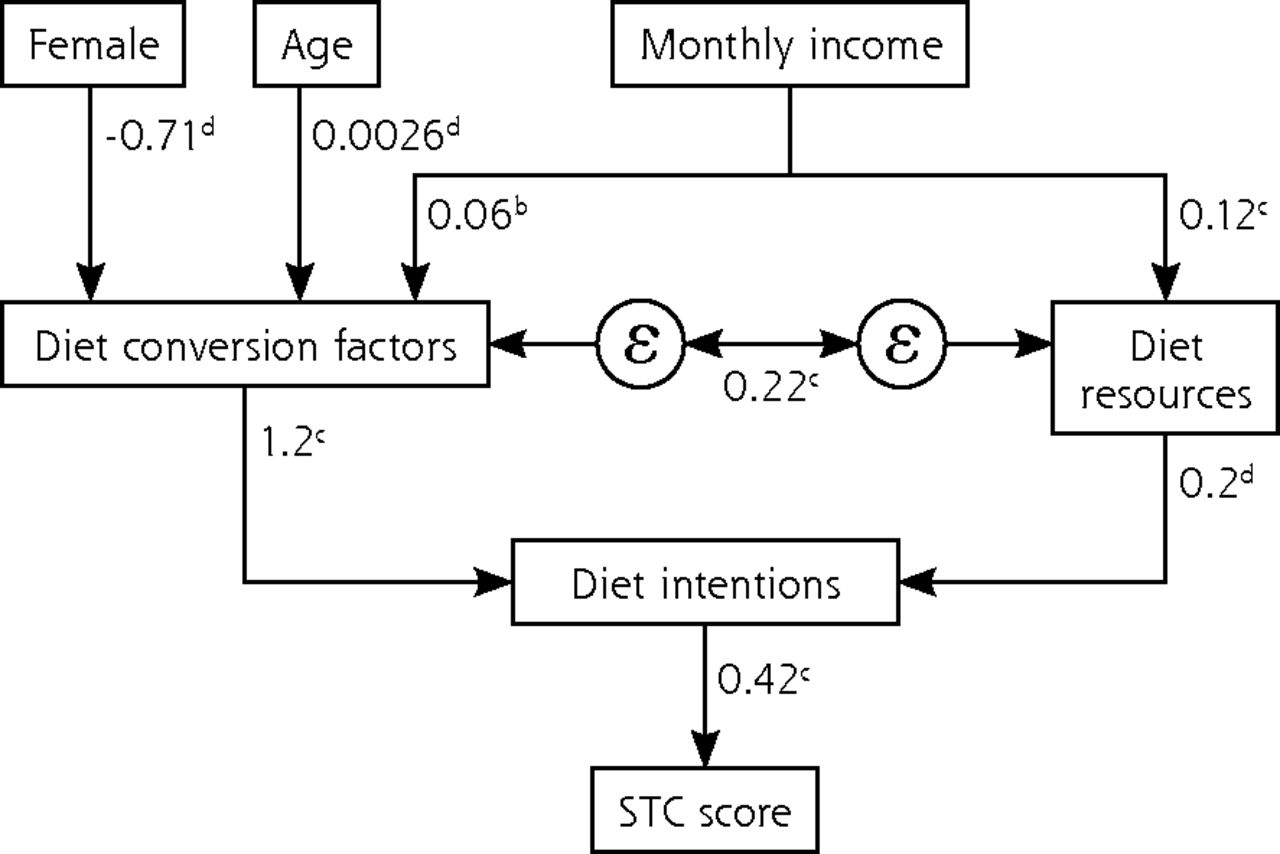
Structural equation model predicting diet quality from CADA factors.
CADA = capability assessment for diet and activity; STC = Starting the Conversation diet instrument; ε =correlated error
Note: Diet resources and diet conversion are scales from CADA instrument. Diet intentions is defined as the number of days the respondent intends to a eat healthy diet in next week.
n = 181
aP <.05
bP <.01
cP <.001
dP >.05
Model fit: Likelihood ratio for model vs saturated: χ2(10) = 10.74; P = .38.
Root mean square error of approximation: 0.020 CI (0.000-0.085)
Comparative Fit Index: 0.994
Overall R2: 0.130
In all diet and activity models, monthly income was significantly associated with both resources and conversion factors (P <.001 for all).
DISCUSSION
Effectively responding to the epidemic of obesity and chronic disease requires intervention models that account for important drivers of diet and physical activity patterns.35 This study demonstrates that practical opportunities for healthy diet and physical activity are measurable, confirming factor structures derived in a previous study.17 Practical opportunity measures predict behavioral intentions, diet quality, activity minutes, and BMI as theorized. The effect size of capability measures is relatively large, especially for conversion factors.
Any recommendation for more data gathering, including the CADA, in primary care practice must justify the added time and resources. The CADA is a logical companion to structured health risk assessments (HRAs), which are now increasingly common.36 Whereas a health risk assessment assesses the “what” of patient behavior, the CADA helps inform the “why,” shining light on circumstances that undermine the effectiveness of standard interventions. For example, a recent article evaluating the outcomes of a robust HRA implementation noted that relatively few patients were interested in behavior change.37 Extending an HRA to include questions on practical opportunities can help reveal aspects of non-choice in what appear on the surface to be behavioral choices.38
The findings also underline the need to understand the complexity of people’s lives. Achieving goals depends on the interaction between agency and external resources. These variables are only moderately correlated, making it important to assess both carefully. Also, although we could not test this in a cross-sectional study, the path from opportunities to choices to achievements is likely to be a feedback cycle rather than a linear process. Success in converting opportunities into achievements will likely boost confidence for further action.39
That opportunities for diet and activity appear to act differently adds nuance to understanding behavior change. In our data, conversion factors are important for both diet and activity, whereas resources are less predictive of diet. This finding is consistent with emerging evidence on food purchases: although grocery stores are less prevalent in less-affluent neighbor-hoods, with those present offering fewer healthy foods, the effect of these disparities on food purchases appears to be modest, explaining only 1% to 3% of the gap in healthy diet. Comparing purchases by consumers with different socioeconomic status within the same store, it was estimated that one-half the income disparity and 90% of the educational disparity in food purchases would remain if food access were equalized.40
CADA factors stratify strongly by socioeconomic status, identifying sources of disparities in health behaviors. Although not all CADA items measure characteristics easily modified in the short-term, remaining unaware of those circumstances while continuing to exhort patients to change is ineffective, unjust, and humiliating.41 Over the longer term, it is feasible to offer patients assistance to help them in a number of areas:
Finding affordable sources of produce42
Shopping more effectively on a given fixed budget43
Treating depression that interferes with healthy behaviors44
Community-based organizing for promoting safety and physical activity45
Identifying physical activity appropriate for persons with specific morbidity46
To promote community-level change, The Community Guide47 offers a list of evidence-based interventions reviewed by the Community Preventive Services Task Force. The strategies they recommend that are most relevant to this study include interventions to enhance the built environment, multisector campaigns to provide added support for physical activity, and the development of individually adapted behavior-change programs.48 Our approach could augment tailored behavior-change strategies, going beyond individuals’ preferences and readiness for change49 to consider what is feasible for them as well.
Applying the capability approach and other social ecological models leads to conceptualizing health behaviors less as properties of individuals than as patterns that emerge from the interaction of person and environment.50 This perspective is supported by experimental studies such as Moving to Opportunity, which demonstrated that relocating people to more enabling environments improves health behaviors and BMI,51 even without specific effort to modify behavioral intentions. Also, people do not merely respond to their environment, they shape it.52 For example, a person’s view that walking is unsafe because few other people are out walking helps propagate that perception. And as social conditions become physically embodied,53 norms for body image and behaviors are further shifted. This leads to “structural coupling,” where recurrent interactions among nested systems (such as person and community) generate transformations at each level.54
These ideas have several practical implications for the interfaces between primary care practices, their communities, and local public health agencies55:
Clinicians need to be aware of conditions promoting or hindering healthy behavior in their community.
Physicians’ counseling approaches are guided by their perceptions of what factors drive obesity.56 As their acknowledgment of multilevel influences grows, they should participate in collaborative models that address multiple determinants and community influences.55,57,58
Aggregating practical opportunity data within and across practices can help identify unmet community needs, providing valuable local intelligence for public health agencies.
Our study is subject to important limitations. First, this cross-sectional study cannot prove temporal sequencing from practical opportunities to intentions to health behaviors and BMI. The findings describe associations whose causal linkages must be confirmed in longitudinal studies. Critically, CADA measures’ usefulness for improving success in behavior change trials must be demonstrated. Second, our self-report measures of diet and activity have proven feasible to obtain during primary care visits but are less reliable and more susceptible to social desirability bias than more intensive measures. This bias may potentially account for the higher R2 values in the diet and activity models compared with the BMI models, where the outcome was objectively measured. Correlations between self-report predictor and outcome variables may have also been inflated by the fact that we collected them simultaneously rather than prospectively. Third, because of an error in the distribution of our diet measure, only 27% of the sample completed it. Although an analysis limited to participants with complete diet data returned very similar parameter estimates, the models predicting achieved diet from capability variables need further confirmation. Fourth, although we sampled patients from 7 different cities in Texas, wide variations in community contexts meant that we have not captured the possible range of interactions between individual and community variables. Strengths include a sample that was economically and ethnically diverse, prior development of the study instrument through a participatory research process, and methods applied here to confirm the instrument’s factors in a completely new sample.
We conclude that practical opportunities for diet and activity are measurable, and that they display clinically meaningful associations with behavioral intentions, achieved diet and physical activity, and BMI. While further work is necessary to understand the sequencing and feedbacks among these variables over time, the approach holds promise as a more effective, respectful, and just approach to promoting healthy behaviors.
Acknowledgments
The authors thank the participating practices in the Residency Research Network of Texas (RRNeT) and the medical students who assisted with data collection.
Footnotes
Conflicts of interest: authors report none.
RRNeT Investigators: Swati Avashia, MD, Austin Family Medicine Residency Program, Austin, Texas; Richard Young, MD, John Peter Smith Family Medicine Residency Program, Fort Worth, Texas; Darryl White, MD, Valley Baptist Family Medicine Residency Program, Harlingen, Texas; Sunand Kallumadanda, MD, McAllen Family Medicine Residency Program, McAllen, Texas; Tamara Armstrong, PsyD, Christus Santa Rosa Family Medicine Residency Program, San Antonio, Texas; Ashok Kumar, MD, University of Texas Health Science Center at San Antonio; David Edwards, MD, Texas Tech University, Lubbock.
Funding support: The study was supported by a grant to Dr Ferrer from the Texas Academy of Family Physicians Foundation.
- Received for publication May 15, 2015.
- Revision received September 29, 2015.
- Accepted for publication October 18, 2015.
- © 2016 Annals of Family Medicine, Inc.


