
Abstract
PURPOSE Social determinants of health (SDoH) have been linked to a variety of health conditions, but there are no multivariate measures of these determinants to estimate the risk of morbidity or mortality in a community. We developed a score derived from multivariate measures of SDoH that predicts county-level cardiovascular disease (CVD) mortality.
METHODS Using county-level data from 3,026 US counties, we developed a score considering variables of neighborhood socioeconomic status, food/lifestyle environment, and health care resource availability and accessibility to predict the 3-year average (2015-2017) age-adjusted county-level mortality rate for all CVD. We used one 50% random sample to develop the score and the other to validate the score. A Poisson regression model was developed to estimate parameters of variables while accounting for intrastate correlation.
RESULTS The index score was based on 7 SDoH factors: percentage of the population of minority (nonwhite) race, poverty rate, percentage of the population without a high school diploma, grocery store ratio, fast-food restaurant ratio, after-tax soda price, and primary care physician supply. The area under the curve for the development and validation groups was similar, 0.851 (95% CI, 0.829-0.872) and 0.840 (95% CI, 0.817-0.863), respectively, indicating excellent discriminative ability. The index had better predictive performance for CVD burden than other area-level indexes: poverty only (area under the curve= 0.808, P <.001); the Centers for Disease Control and Prevention’s Social Vulnerability Index (CDC-SVI) (area under the curve =0.786, P <.001); and the Agency for Healthcare Research and Quality’s Socioeconomic Status (AHRQ-SES) index (area under the curve =0.835, P = .03).
CONCLUSIONS Our validated multivariate SDoH index score accurately classifies counties with high CVD burden and therefore has the potential to improve CVD risk prediction for vulnerable populations and interventions for CVD at the county level.
- social determinants of health
- cardiovascular disease
- county-level health assessment
- risk score
- risk stratification
- health status disparities
- vulnerable populations
- population health
Where a person lives is now thought to be an essential determinant of health.1 The social and economic opportunities along with the resources and supports available in our homes, neighborhoods, and communities are considered social determinants of health (SDoH).1,2 Evidence suggests that these factors influence health status and mortality by shaping opportunities or barriers to health-related behaviors and access to care.3–9 Consequently, considerable interest has focused on how to incorporate SDoH into our assessment of health risks for populations and even individuals.10,11
Cardiovascular disease (CVD) is the leading cause of death in the United States.12 Clear evidence has established that adhering to a healthy lifestyle (eg, eating a healthy diet and getting physical activity), having good access to care, and living in a neighborhood with health-promoting resources (ie, infrastructure or built environment) can reduce the risk and burden of CVD.13–16 Some individual-level CVD risk scores have attempted in a general way to address SDoH by incorporating poverty into their scores.17
Although poverty is one general assessment of SDoH, it fails to address the relative contribution of several associated variables on health outcomes. What is missing is a multivariate assessment of SDoH context for predicting CVD risk on a community level. Such an assessment would help plan for appropriate health services in higher-risk communities.
The goal of this study was to develop and validate a multivariate index score for community- (county-) level CVD mortality for the entire Unites States that incorporates various SDoH factors. Knowing the relevant attributes of SDoH and being able to categorize counties with higher CVD burden would be of substantial benefit for health promotion at the population level.
METHODS
Study Design, Data, and Sample
This study was a retrospective, cross-sectional, county-level effort to synthesize the effects of neighborhood factors on variations in total CVD mortality rate. To compile information available on US county-level characteristics, we used various secondary data sources including 2015-2017 Centers for Disease Control and Prevention’s Wide-Ranging Online Data for Epidemiologic Research (CDC Wonder)18; 2014-2015 Food Environment Atlas Data File (Food Atlas) from the US Department of Agriculture (USDA) Economic Research Service19; and 2015-2017 Area Health Resource File (AHRF) data from the US Department of Health and Human Services.20 CDC Wonder provides access to information on detailed causes of death based on death certificates for residents in the 50 states and District of Columbia. The Food Atlas contains geographically based information on food and lifestyle measures, including the community’s ability to access healthy food, food prices, nutrition assistance programs, and other community resources such as store-restaurant mix and physical activity facilities.19 The AHRF data are compiled from more than 50 databases including the US Census, American Community Survey, and American Medical Association’s Masterfile to provide comprehensive area-level information on health facilities, health care professionals, health service use, and other economic and population characteristics.20 All data were merged into a single database using Federal Information Processing Standards codes.
The county was the unit of analysis, and a total of 3,232 counties were included in the merged data. We excluded 118 counties in Alaska, Hawaii, and US territories (Guam, Puerto Rico, etc) because they are noncontiguous parts of the country and often have missing information, and 88 counties with missing or unreliable estimates on our outcome measure. Analyses were thus based on data from 3,026 counties. We used a 50% random sample (1,513 counties) to develop the index score and the other 50% random sample to validate it.
This study was deemed non–human subjects research and therefore exempted from review by the University of Florida Institutional Review Board.
Primary Outcome: CVD Mortality Rate
Our primary outcome was the 3-year average (2015-2017) age-adjusted county-level mortality rate for all CVD. In the CDC Wonder detailed mortality database, presumed underlying causes of death at the county level are categorized using International Statistical Classification of Diseases and Related Health Problems, Tenth Edition (ICD-10), and we included codes I00 through I99.18 We opted to use the 3-year average mortality to provide stable estimates because of possible year-to-year variations in mortality rates at the county level, consistent with prior work on area-level health outcomes.9,21,22 The CVD mortality rates expressed per 100,000 population were age-adjusted using the direct method with the 2015 Census estimates as the standard population, and with the following age categories: younger than 1 year, 1-4, 5-14, 15-24, 25-34, 35-44, 45-54, 55-64, 65-74, 75-84, 85 years and older.23,24
Selection of SDoH Variables
We tried to capture all possible SDoH factors (ie, candidate variables) based on a review of evidence.1–9,13–16 We constructed and summarized hypothesized pathways in directed acyclic graphs to identify measurable factors in given data sets (Supplemental Figure 1, available at https://www.AnnFamMed.org/content/18/4/318/suppl/DC1/). Three SDoH contextual domains eventually emerged: (1) socioeconomic status (SES), (2) food and lifestyle environment, and (3) health care resources. Detailed data sources used in this study are listed in Supplemental Table 1 (available at https://www.AnnFamMed.org/content/18/4/318/suppl/DC1/).
Socioeconomic Status
We considered county-level socioeconomic characteristics related to health outcomes3,4,6,8 in the SES domain. Those included were percentage of the population made up by racial minorities (nonwhite), as a proxy of population diversity); percentage of residents aged 25 years and older without a high school diploma; percentage of residents with 4 years of college or more; percentage of families living below federal poverty level; median household income; percentage of residents aged 16 years and older without employment; and percentage of residents covered by health insurance plans. The USDA’s Rural-Urban Continuum Codes19 were used to measure county urbanization (metropolitan vs nonmetropolitan).
Food and Lifestyle Environment
We defined the food and lifestyle environment as availability of facilities and area-level features affecting diet quality and physical activity. To capture these contextual influences, we included the density (count) of grocery stores, convenience stores, fast-food restaurants, full-service restaurants, and recreational and fitness facilities per 1,000 residents, as well as the after-tax soda prices (soda tax rates applied) at the county level from the Food Atlas data. According to the North American Industry Classification System,19 a grocery store was defined as a store primarily retailing fresh fruits and vegetables, fresh and prepared meats and fish, and other general lines of food (eg, canned and frozen foods). Other stores retailing a limited line of goods and snacks were defined as convenience stores (including gas stations). Fast-food restaurants were defined as establishments providing food services without restaurant servers in which patrons generally pay before eating (ie, drive-in and fast-casual restaurants); full-service restaurants were those where patrons were served while seated and paid after eating (ie, diners and family restaurants). Recreation and fitness facilities comprised amenities and establishments for active physical activities and recreational sports, including exercise centers, sports courts, and other outdoor recreational complexes. After-tax soda prices were calculated by multiplying regional tax rates (percentage) on soda purchased by average price of carbonated and sweetened beverage. We calculated the local average price of sodas in actual dollars using the ratio of soda price to the national average price ($1.25 per liter in 2015).25
Health Care Resources
To account for health care resources (availability and accessibility), several measures of health professionals and facilities were selected from the AHRF data. We included density of primary care physicians (PCPs), specialists, nonphysician health care professionals (nurse practitioners, clinical nurses, physician assistants), any type of hospitals, and other community health facilities (federally qualified health centers, rural health clinics, community health centers). To be consistent with other density measures (calculated per 1,000 residents), each measure was calculated by dividing the number of professionals or facilities by the total population estimates (2015 Census estimates) and multiplied by 1,000.
Data Analyses
Construction of the Index Score
To create the Hong-Mainous CVD (HM-CVD) index, we used an approach analogous to that used for the Reynolds risk score developed based on regression coefficients.26 The rationale behind this approach was that categorizing county characteristics (eg, quartiles, quintiles) did not result in meaningful risk stratifications during our preliminary analysis using multivariate logistic regression analysis (converting significant odds ratios into integer scores). Although it may be relatively difficult to use the regression coefficient approach as compared with integer scoring, this approach is generally adopted and used in most risk assessment tool development26–28 and likely yields more precise estimates with improved model fit.28
To develop our index score, we used a randomly selected 50% sample of counties (1,513 counties) with complete data for CVD mortality rates and other key SDoH variables. For main analysis, we used the food store ratio (grocery/convenience stores; for healthy, fresh foods availability) and restaurant ratio (fast-food/full-services restaurants; for consumption of energy-dense and nutrient-poor foods) to reflect their comparative values while avoiding possible multicollinearity, consistent with previous work.29 The median household income was z-scored to be estimated with quantifiable coefficients.
We fit a Poisson regression model to estimate variable parameters and used robust standard errors clustered at the state level to account for intrastate correlation.30,31 All candidate and outcome variables were included in the initial model; thereafter, variables were selected using stepwise backward elimination with county-level CVD mortality rates as the dependent variable. We confirmed the absence of multicollinearity among retained variables using the variance inflation factor (<4.0) and tolerance (>0.2).32 Under the stepwise approach, the best-fitting predictive model included 7 variables: percentage of population of minority race, family poverty rate, percentage of population without high school diploma, grocery store ratio, fast-food restaurant ratio, after-tax soda price, and density of PCPs. We confirmed this set of variables using an iterative forward-selection procedure based on a correlation matrix of all candidate variables (Supplemental Table 2, available at https://www.AnnFamMed.org/content/18/4/318/suppl/DC1/). Model fit was assessed using quasi-Akaike information criteria (QAIC).30,31
On the basis of the final best-fitting predictive model, we calculated a score by summing of the estimated regression coefficients multiplied by values of the corresponding retained variables. We then standardized the computed index scores (range = 0 to 100; mean = 50; standard deviation = 10) to allow easier calculation and standardized comparison between counties; higher index scores suggest greater CVD burden.
Validation and Comparison With Other Measures
We validated the HM-CVD index using the other random 50% sample of counties (1,513 counties), and compared its performance with that of 3 other indicators frequently used for area-level assessment and risk adjustment: poverty rate, the AHRQ-SES index,33 and the CDC-Social Vulnerability Index (CDC-SVI).34 Descriptions and calculations of these measures are given in the Supplemental Appendix (available at https://www.AnnFamMed.org/content/18/4/318/suppl/DC1/) and in more detail elsewhere.33,34 We estimated logistic models with a dichotomized CVD outcome variable: high CVD burden (score of 1) vs low-intermediate burden (score of 0). We categorized counties with age-adjusted CVD mortality rates above the 75th percentile among all US counties (>283.2 deaths per 100,000 population) as having high CVD burden, given that top-quartile level has been extensively used as a high-risk threshold or health outcome indicator.35,36
For validation, we applied the standardized scoring formula to each county in the validation group. Then, discrimination and calibration performance were assessed. Discrimination performance, ability to separate counties with vs without high CVD burden, was assessed with area under the curve (AUC; equivalent to the C statistic) in a receiver operating characteristic curve generated from logistic models.28 Calibration performance was assessed with a calibration plot (whereby a calibration slope close to 1 indicates satisfactory calibration)27 by comparing the predicted number of counties with high CVD burden with the observed number of counties in index score quintile groups (0-20, 21-40, 41-60, 61-80, and 81-100). To compare the predictive performance of the HM-CVD index with the 3 area-level indexes, we also computed AUCs in receiver operating characteristic curves for each of those models.
All the analyses were performed using SPSS Complex Survey 24 (IBM Corp) and SAS 9.4 (SAS Institute Inc). We used 2-sided P values, with significance set at <.05.
RESULTS
A total of 3,026 US counties were eligible. Distribution of the SDoH variables included in the index score was generally similar between the 1,513 counties in the development group and the 1,513 counties in the validation group (Table 1).
County Variables in the Development and Validation Groups
HM-CVD Index Score
The resulting HM-CVD index score was based on 7 SDoH factors: percentage of minority population, family poverty rate, percentage of population without a high school diploma, grocery store ratio, fast-food restaurant ratio, after-tax soda price, and density of PCPs. Table 2 presents the coefficient estimates for each factor from the final best-fitting model; the standardized HM-CVD index score was calculated by the following formula:
HM-CVD index score = 70.150 + % of minority residents × −0.165) % of residents without a high school diploma × 0.521) + (poverty rate × 1.090) + (grocery store ratio × −2.667) + (fast-food restaurant ratio × 3.414) + (after-tax soda price × −29.240) + (PCP density × −4.134)
Coefficients for the 7 Variables Included in the HM-CVD Index Score
Supplemental Figure 2 (available at https://www.AnnFamMed.org/content/18/4/318/suppl/DC1/) displays a heatmap of the HM-CVD index score for the United States, visually depicting the spatial distribution of predicted CVD mortality risk across counties.
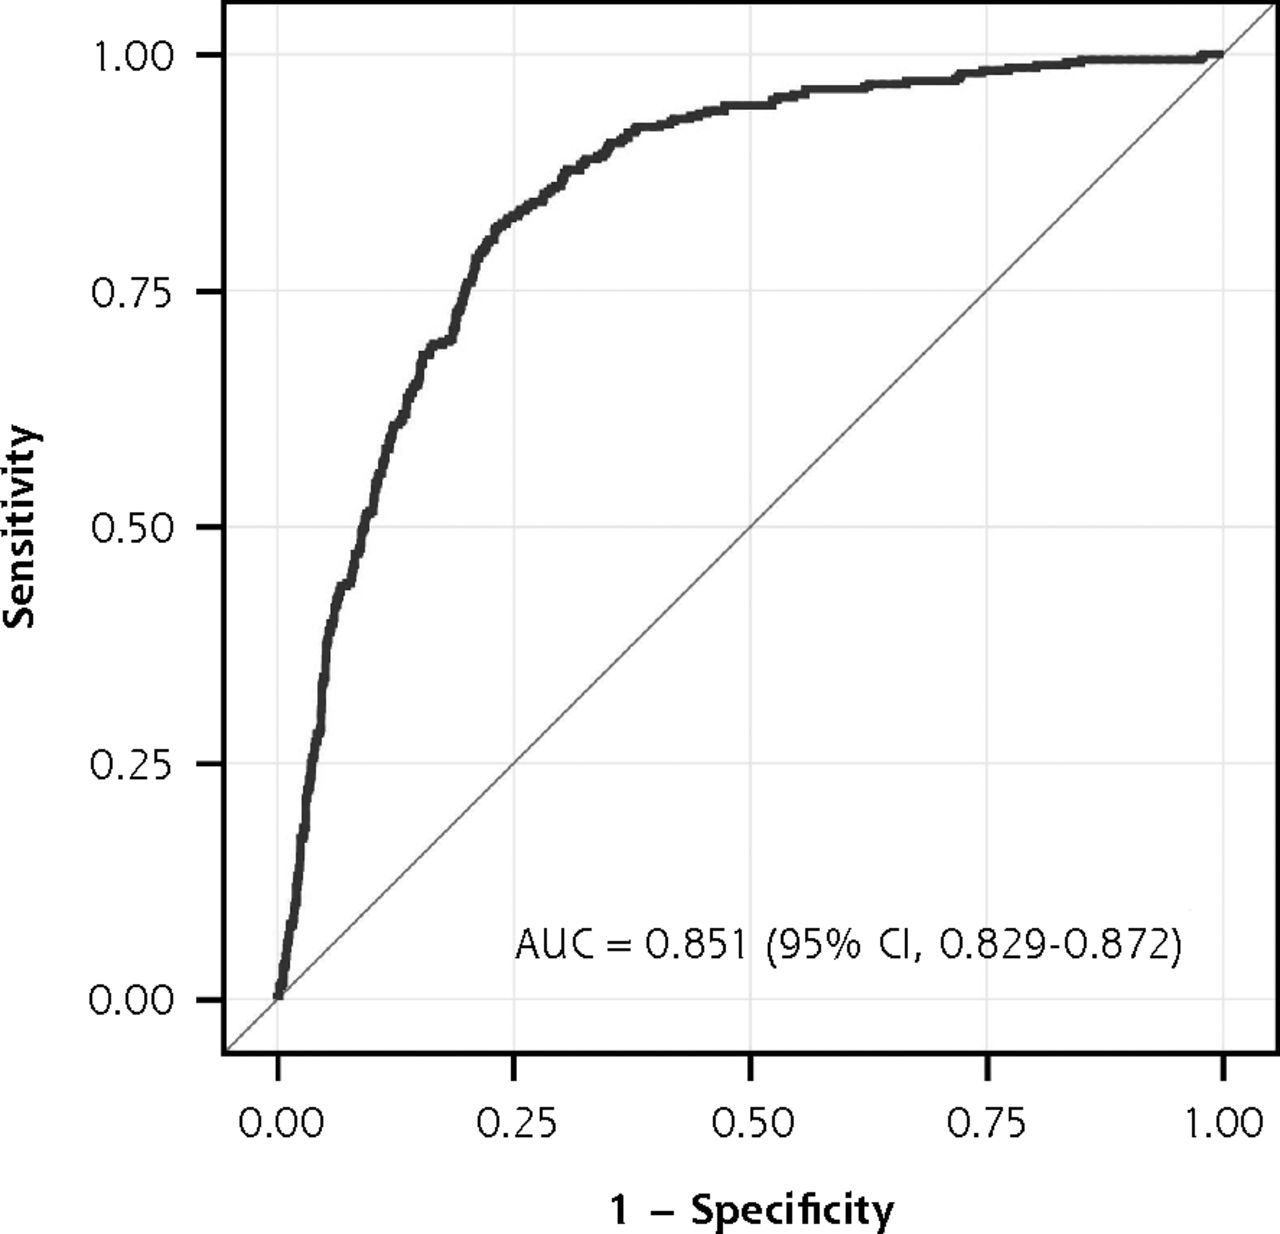
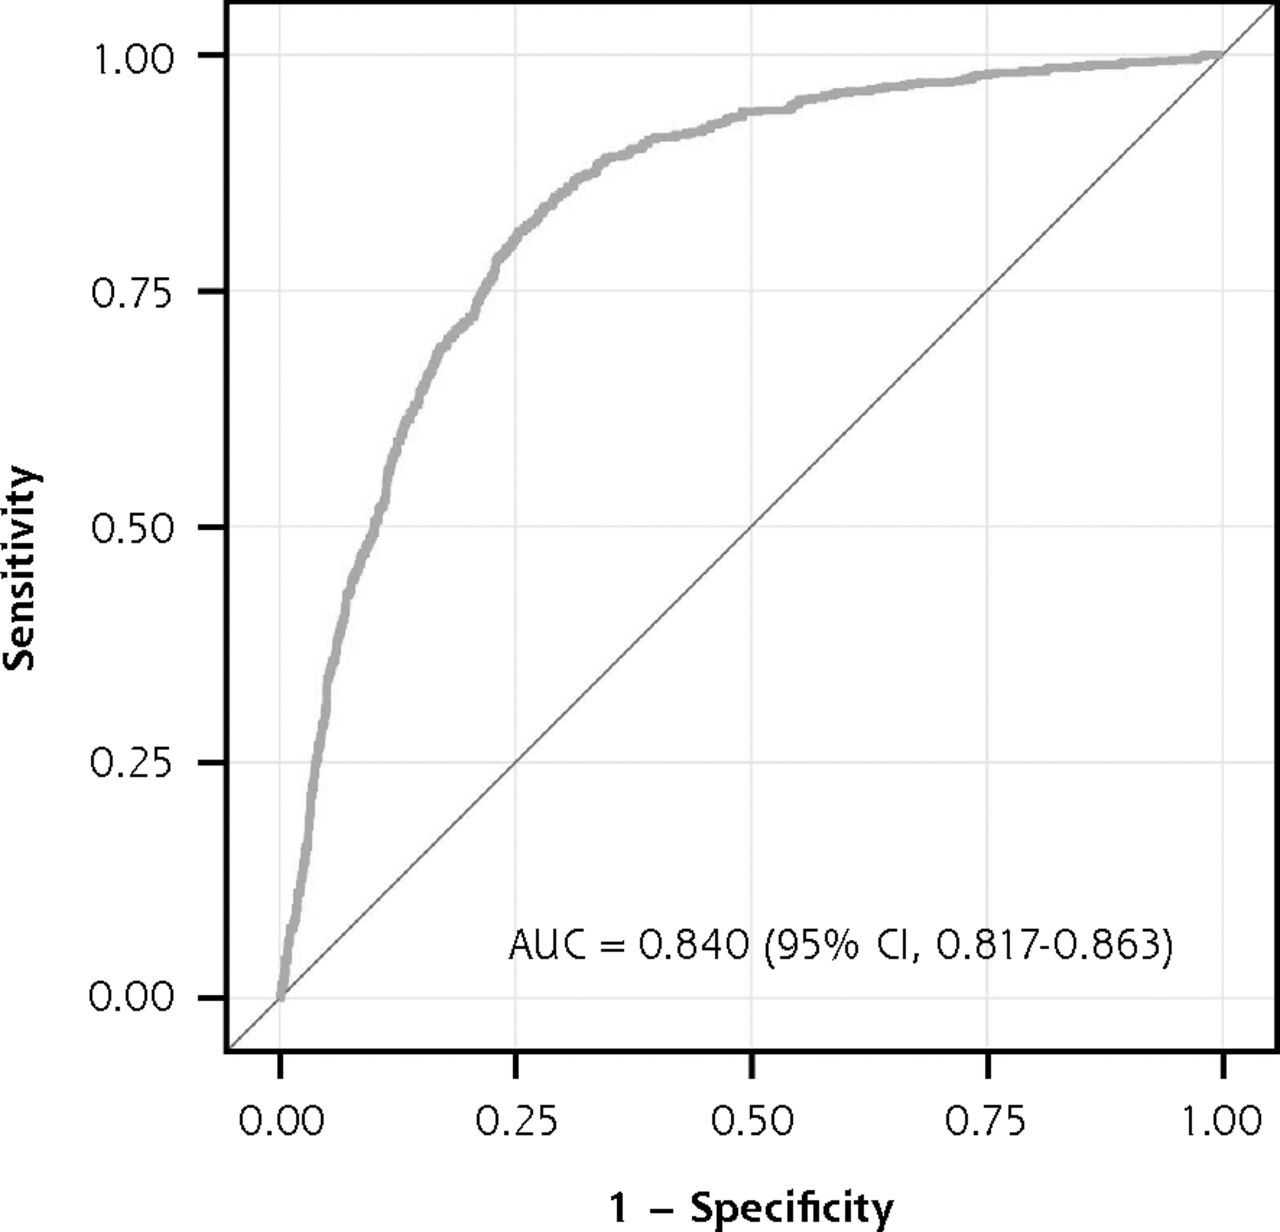
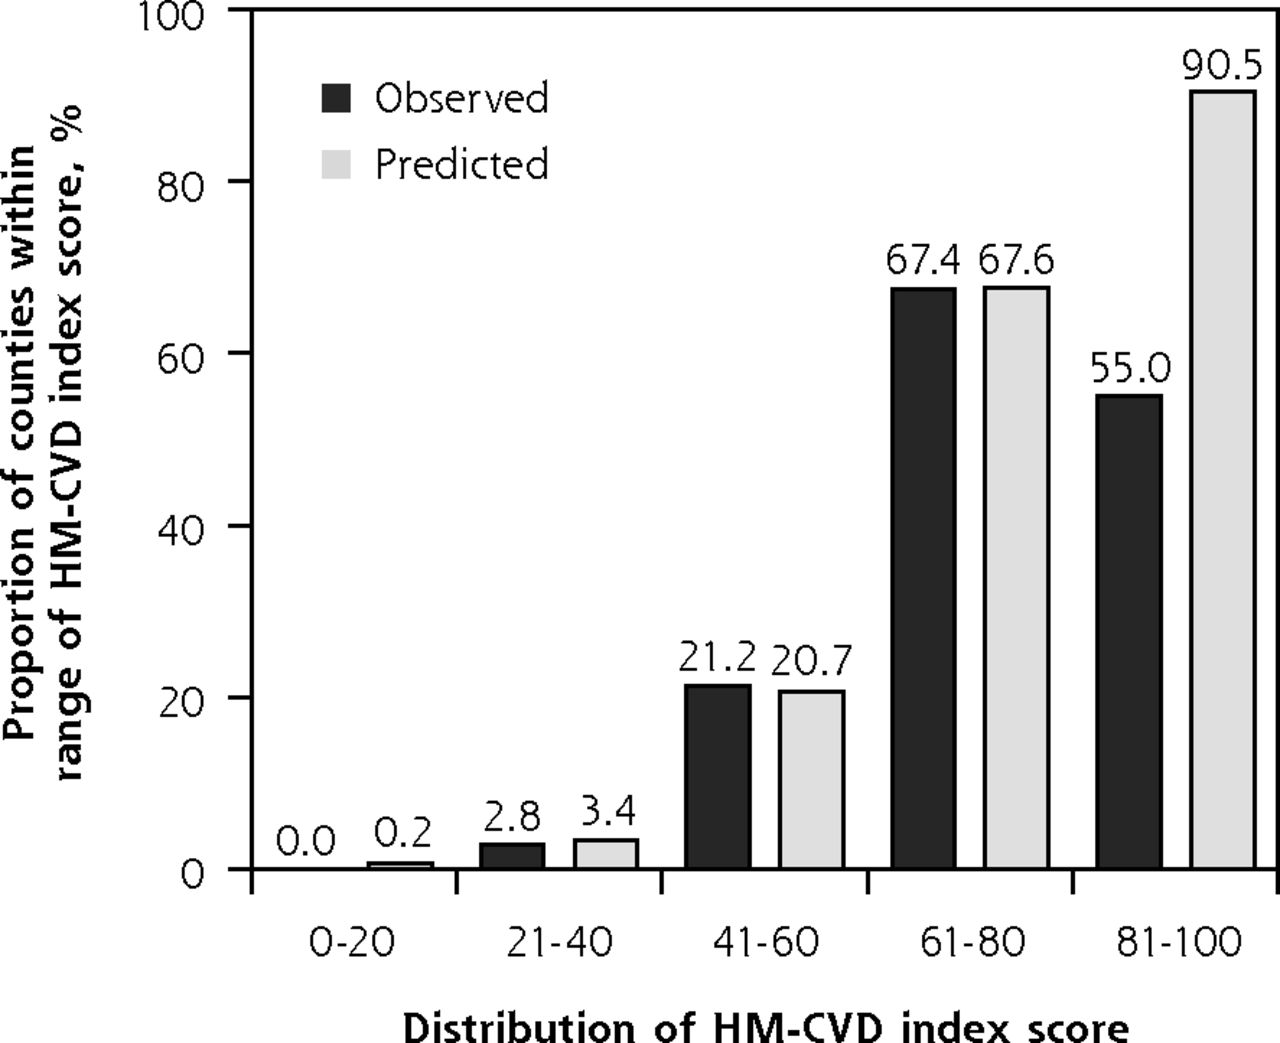
The AUCs for the development and validation models were similar, 0.851 (95% CI, 0.829-0.872) and 0.840 (95% CI, 0.817-0.863), respectively (Figure 1a and Figure 1b), indicating excellent discriminative ability. When index-predicted and observed high CVD burden were compared, the calibration plot suggested the model relatively overestimated the proportion of counties with high CVD burden for the top-quintile group (index score range of 81-100), with a predicted value of 90.5% vs an observed value of 55.0% (Figure 2). Based on the calibration slope (0.998) and intercept (0.001), however, predicted and observed high CVD burden agreed well across the index score quintile groups; therefore, calibration of the model was satisfactory.

ROC curve for the HM-CVD index score in the development group.
AUC = area under the curve; HM-CVD = Hong-Mainous cardiovascular disease; ROC = receiver operating characteristic.

ROC curve for the HM-CVD index score in the validation group.
AUC = area under the curve; HM-CVD = Hong-Mainous cardiovascular disease; ROC = receiver operating characteristic.

Calibration plot for observed and predicted proportions of US counties with high CVD burden.
CVD = cardiovascular disease; HM-CVD = Hong-Mainous cardiovascular disease.
Note: intercept = .001; calibration slope = .998.
Supplemental Table 3 (available at https://www.AnnFamMed.org/content/18/4/318/suppl/DC1/) summarizes the performance of the HM-CVD index across different cut-point scores. Using higher cut-points tended to identify a smaller number of counties with high CVD burden (ie, lower sensitivity) but resulted in higher specificity and positive predictive value. Negative predictive value was high (≥75%) across the cut-point scores. Given the highest positive predictive value and negative predictive value, using a cut-point score of 60 or greater seemed to perform best at identifying counties with high CVD burden.
Comparison of HM-CVD With Other Measures
The AUC of the HM-CVD index was significantly higher than that of the poverty rate (0.851 vs 0.808, P <.001) and the CDC-SVI score (0.851 vs 0.786, P <.001) (Figure 3). The performance of the HM-CVD index appeared to be close to that of the AHRQ-SES index; however, the difference between the AUCs was significant (0.851 vs 0.835, P = .03).

Comparison of predictive performance for counties with high CVD burden.
AHRQ-SES = Agency for Healthcare Research and Quality’s Socioeconomic Status; AUC = area under the curve. CDC-SVI = Centers for Disease Control and Prevention’s Social Vulnerability Index; CVD = cardiovascular disease; HM-CVD = Hong-Mainous cardiovascular disease; ROC = receiver operating characteristic.
DISCUSSION
We developed and validated the HM-CVD index, a county-level score using SDoH to identify counties having high CVD burden. After investigating a variety of SDoH candidate variables, we included 7 in the index: minority population, lack of high school education, poverty rate, grocery stores, fast-food restaurants, average price of soda, and PCP supply. The associations between these SDoH variables and CVD mortality observed herein are consistent with those seen in previous studies of area-level indicators and population health outcomes.1–9,13–16 The HM-CVD index had both excellent discrimination and excellent calibration for predicting which counties had a high CVD burden.
Our index score can be easily calculated using publicly available data from the US Census Bureau and federal agencies (eg, USDA and Health Resources and Services Administration), suggesting its practicability in various settings for identifying communities or populations at high risk for CVD and in need of efficient delivery of interventions to improve neighborhood conditions. Moreover, the index score has potential application as a computerized tool (eg, web-based or integrated into electronic health record system) for assessing county-level resources where patients reside, a SDoH screening tool for use in practice.35 We provide a full list of HM-CVD index scores for US counties as of 2015 in Supplemental Table 3 (available at https://www.AnnFamMed.org/content/18/4/318/suppl/DC1/) for public use and plan to update them using census data.
The construct of SDoH captures neighborhood resources, including socioeconomic and structural conditions of a person’s surroundings. Valid, accurate, and easily reproducible multivariate risk scores to predict morbidity and mortality related to different health conditions have been lacking. The HM-CVD index is therefore a step forward. Moreover, our results add evidence to the growing amount of literature on the importance of SDoH in CVD outcomes and to the general idea of health care outcome assessment.10,11,35 Much evidence has demonstrated that area-level measures, independent of individual-level factors, are associated with CVD outcomes,13–16 suggesting the importance of including SDoH data in assessing those health outcomes. Failure to adequately value the SDoH context may contribute to disproportionate distribution of resources in health care.11,37 By using this index, for example, policy makers and researchers can prioritize county-level interventions to address deficient neighborhood resources. In addition, CVD interventions can be improved based on the index score with an understanding of where a target population lives, availability of lifestyle resources, and access to care.11,38
One challenge to screening for patients’ health-related SDoH is the complex nature of potential interrelationships among those factors (ie, beyond individual-level characteristics). Moreover, many validated tools for SDoH are based on SES factors, such as poverty, income, and education, and are generally designed for research purposes.6,31,32 The HM-CVD index had better predictive utility than poverty rate and the CDC-SVI score, suggesting consideration of neighborhood characteristics other than SES may improve CVD risk assessment. Although performance of the AHRQ-SES index was numerically similar, the HM-CVD index still had significantly better performance, and we believe that our index well reflects the multidimensional character of the neighborhood SDoH status along with community infrastructure (ie, the built environment) and SES factors.
SDoH are important variables affecting the health of populations. As this was an initial effort, we focused on county-level characteristics; however, family physicians can use this score for planning purposes, by understanding where their patient population lives and whether they have a high CVD risk. This is population health at its most basic level in understanding one’s patient population. The next step will be to evaluate whether the HM-CVD index has the potential to contribute more to both individual-level and population-level CVD risk assessment. In clinical settings, in particular, there has been increasing emphasis on screening for health-related socioecologic and environmental circumstances that can be modified for patient health-related behaviors and health outcomes.39,40 Those factors are often overlooked, however, because of difficulties with assessment in clinical settings or a lack of validated multidimensional measures of SDoH.35
Our HM-CVD index has some limitations that may affect generalizability of the results. First, we used data limited to county-level information in the United States; thus, applying the scoring formula to other countries may require modifications of the measure. We note, however, that all of the SDoH factors included in the models have generally been considered and found to be associated with various health outcomes in other countries as well.22,41,42 Second, it might be argued that an index score can be developed using factor analysis, as demonstrated in a previous effort.39 The risk score approach, however, linking candidate variables with an outcome to be assessed or predicted, could be a more straightforward tool to inform users of specific SDoH factors/items associated with the outcome. Third, although SDoH may affect multiple diseases and conditions, we focused on CVD. We believed that focusing on a single disease, the leading cause of death in the United States, was appropriate, useful, and consistent with the creation of many other risk scores. Our index demonstrated utility in predicting high CVD burden among US counties across the nation, suggesting broad generalizability. Further research could examine the value of the HM-CVD index for predicting and altering outcomes other than CVD mortality, such as health services use; for assessing the impact of multisite community-based interventions; and for performing risk adjustment when evaluating hospital performance.11,43 Lastly, the index score was developed based on aggregate county-level data. Additional work should explore how the index affects clinical decision making and individual-level CVD risk assessment (especially for screening or targeted intervention), given the prior effort integrating SDoH factors into existing CVD risk scores.17,44
In conclusion, we developed the HM-CVD index, a multivariate score that systematically synthesizes the effects of SDoH factors associated with county-level CVD mortality. The score was validated and proven to be a better-discriminating tool than poverty rate and other area SES measures for predicting which counties have high CVD burden. Our index has the potential to improve CVD risk prediction and quality of intervention delivery at the county level.
Footnotes
Conflicts of interest: authors report none.
To read or post commentaries in response to this article, see it online at https://www.AnnFamMed.org/content/18/4/318.
Author contributions: Study conception and design; acquisition, analysis, or interpretation of data; drafting of manuscript; critical revision of manuscript for important intellectual content; and statistical analysis: Hong, Mainous; administrative, technical, or material support: Hong; study supervision: Mainous.
Supplemental materials: Available at https://www.AnnFamMed.org/content/18/4/318/suppl/DC1/.
- Received for publication September 11, 2019.
- Revision received December 4, 2019.
- Accepted for publication December 16, 2019.
- © 2020 Annals of Family Medicine, Inc.


