
Abstract
We sought to describe the proportion of patients in contact with a primary care physician, as well as the total number of primary care contacts over a 2-year period, using the 2002-2017 Medical Expenditure Panel Survey. The rate of any contact with a primary care physician for patients in the population decreased by 2.5% over the study period (adjusted odds ratio [aOR] = 0.99 per panel, 95% CI, 0.98-0.99; P <.001). The number of contacts with a primary care physician decreased among individuals with any contact by 0.5 contacts over 2 years (aOR = –0.04 per panel, 95% CI, –0.04 to –0.03, P <.001). The decreases were observed across all age groups at varying rates. The results of this study suggest that the driver for the previously reported decreases in primary care visits is secondary to fewer contacts per patient.
INTRODUCTION
Previous reports suggest there has been a decrease in primary care visits and number of patients per month in contact with a primary care physician over the past 15 years.1-4 It is unclear if this phenomenon is secondary to a decrease in number of visits per patient or absolute number of patients in contact with a primary care physician over time. In this regard, we sought to describe the proportion of patients in contact with a primary care physician, as well as the total number of primary care visits over multiple 2-year periods.
METHODS
A repeated cross-sectional study of the 2002-2017 Medical Expenditure Panel Survey (MEPS) was used to characterize trends in primary care utilization.5 MEPS is sponsored by the Agency of Healthcare Research and Quality and is representative of the US noninstitutionalized population. Individuals and families are included in the survey for 2 years and form part of a panel. Participants are interviewed 5 times over the 2 years as part of the survey. The survey collects demographic, socioeconomic, and medical care utilization data through interviews and other methodologies.5
Individuals were categorized as part of their respective panels (MEPS panels 7-21) and allocated into age groups using age at first survey or age <4 years if they were not born at the start of the survey. Primary care physician contact was defined as an in-person visit or any contact with a primary care physician (primarily telephone calls) with a reported specialty of family medicine, general internal medicine, geriatrics, general pediatrics, or general practice physician. The proportion of individuals with exclusively non-visit contact was low (0.6% of individuals in all survey years).
The proportion of individuals with any primary care physician contact was determined for both the population and by age group using logistic regression models. The number of contacts among people with visits during 2-year periods was determined using negative binomial regression models. The population models adjusted for age, age², sex, and panel. Each age category model included panels as a continuous and, separately, as a categorical variable. Post-prediction marginal effects were used for all models. Sensitivity analyses were conducted within age group models including age and sex with multivariable logistic and negative binomial regressions. Stata 15 (StataCorp LLC) and survey weights were used for all analyses. The OhioHealth institutional review board ruled the study exempt.
RESULTS
From 2002 through 2017, there were 243,919 individuals identified. The rate of any contact with a primary care physician for patients in the population over multiple 2-year periods decreased by 2.5% over the study period (adjusted odds ratio [aOR] = 0.99 per panel, 95% CI, 0.98-0.99; P <.001). Figure 1 shows the rate of primary care physician contact by individuals in each age group. Decreasing rate of contact was observed for patients aged 18-39 years (aOR = 0.99 per panel, 95% CI, 0.98-0.99; P <.001) and patients aged 40-64 years (aOR = 0.99 per panel, 95% CI, 0.99-1.00; P = .002), which corresponds to a predicted cumulative 5% absolute decrease for the younger group and a 2% absolute decrease for the older group.
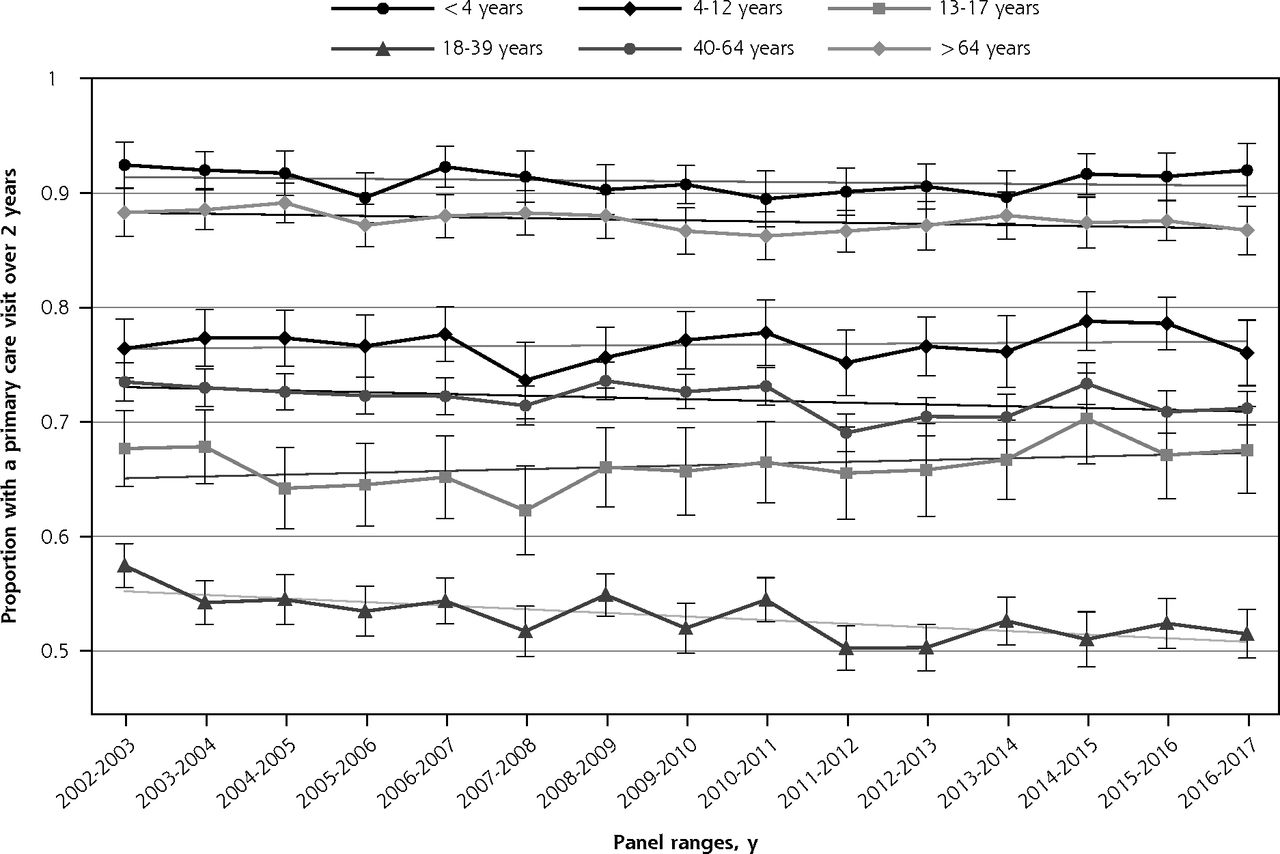
Trends in primary care visits in the United States, 2002-2017.
Note: Figure 1 represents the proportion of patients with a primary care visit over 2-year periods by age group (<4 years, 4-12 years, etc). The points with 95% CIs are derived from the logistic regression models controlling for age, age, and sex with panel as a categorical variable. The trend lines are derived from the same model with panel as a continuous variable.
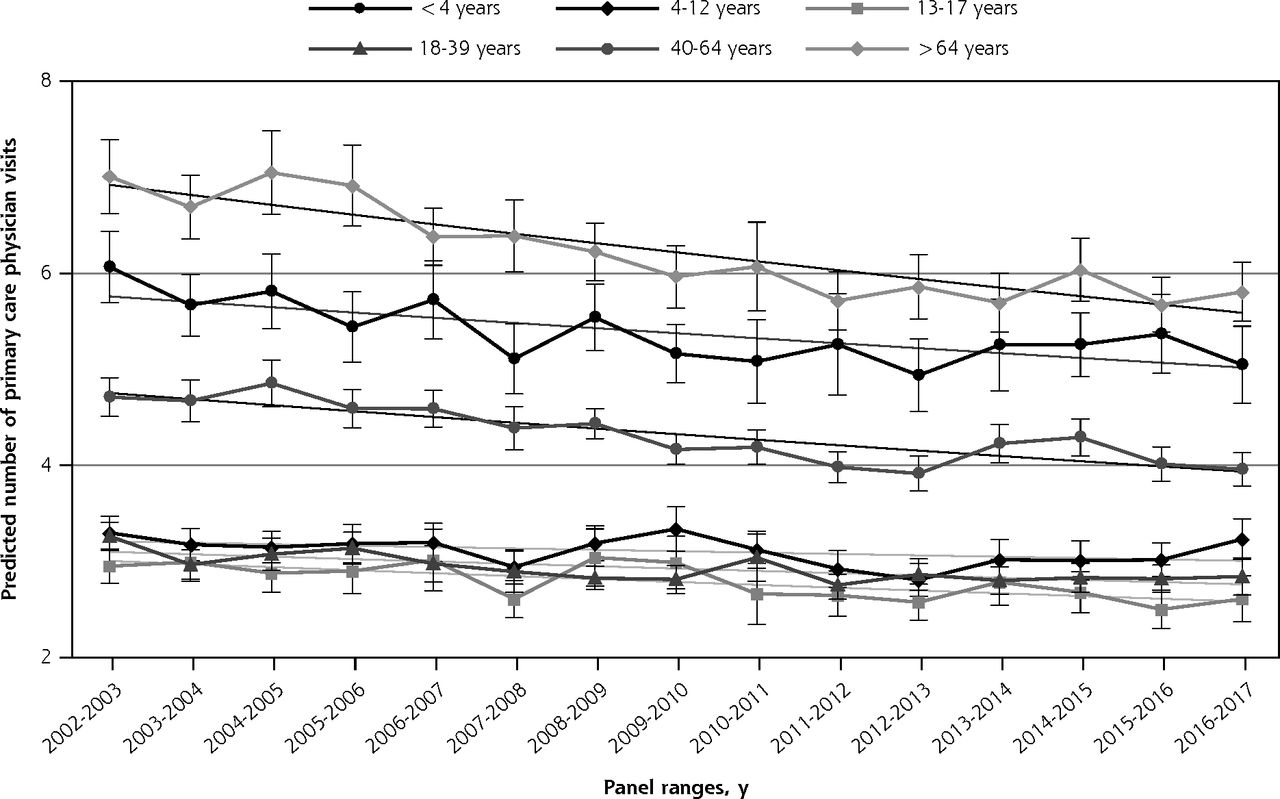
The number of contacts with a primary care physician decreased among individuals with any contact by 0.5 contacts over 2 years (aOR = –0.04 per panel, 95% CI, –0.04 to –0.03; P <.001). A decrease in the number of primary care physician contacts was observed across all age groups (Figure 2; P <.001 for all) with the largest absolute decrease among individuals with higher contact rates (aged <4 years and aged >64 years).

Predicted number of primary care visits in the United States, 2002-2017.
Note: Figure 2 represents the predicted number of visits with a primary care physician using a negative binomial regression model by age group (<4 years, 4-12 years, etc) within each panel with post-prediction marginal effects. The points with 95% CIs are derived from models with panel as a categorical variable. The trend lines are derived from models with panel as a continuous variable.
The majority of the decline in number of contacts in this study is likely secondary to decline in contact rates. Using the above models with a representative 329 million individuals in 2016, the reduction in the number of individuals who visited a primary care physician (70.9% in 2002-2003 and 68.3% in 2016-2017) at the 2002-2003 rate (4.33 visits per 2 years) represents approximately 31 million fewer visits. Comparatively, using the 2016-2017 proportion and adjusting the visit-rate (3.65 visits in 2016-2017 per 2 years) suggests about 153 million fewer visits over 2 years.
Sensitivity analyses did not meaningfully change the results of the study.
DISCUSSION
Consistent with prior research,1,3 the proportion of individuals in contact with a primary care physician over 2 years decreased a few percentage points, which was evident primarily among individuals aged between 18-64 years. The number of contacts with a primary care physician over 2 years declined across all age groups at varying rates.
This study is limited by self-reported categorization among primary vs specialty care physician contact, insufficient accounting for nurse practitioner/physician assistant contact, and improved contact reporting starting in 2013. Furthermore, it is possible that a patient may not contact his/her primary care physician over 2 years, though may still be connected to care.
Despite these limitations, the results of this study suggest that the driver for the previously reported decreases in primary care contact1-4 is secondary to fewer contacts per patient as opposed to an absolute decrease in the number of patients in contact with primary care. Future research is needed to determine whether fewer contacts per patient resulted in clinically meaningful differences in outcomes across disease processes.
Footnotes
Conflicts of interest: authors report none.
To read or post commentaries in response to this article, see it online at https://www.AnnFamMed.org/content/19/1/41.
- Received for publication April 1, 2020.
- Revision received June 12, 2020.
- Accepted for publication June 22, 2020.
- © 2021 Annals of Family Medicine, Inc.
In this issue


Jump to section
Related Articles
Cited By...
- No citing articles found.