
Abstract
PURPOSE To investigate variability in older people’s outcomes according to general practitioner (GP) and practice characteristics in New Zealand and the Netherlands.
METHODS We used data from 2 primary care–based, cluster-randomized, controlled trials to separately fit mixed models of unplanned admission rates, functional ability, and quality of life (QOL) and examine variation according to GP- and practice-level characteristics after adjusting for participant-level characteristics. For the New Zealand sample (n = 3,755 aged 75+ years in 60 practices), we modeled 36-month unplanned admission rates, Nottingham Extended Activities of Daily Living (NEADL) scale, and QOL domain ratings from the brief version of the World Health Organization Quality of Life assessment tool. For the Netherlands sample (n = 3,141 aged 75+ years in 59 practices), we modeled 12-month unplanned admission rates, Groningen Activity Restriction Scale scores, and EuroQOL 5 dimensions (EQ-5D) summary index.
RESULTS None of the GP or practice characteristics were significantly associated with rates of unplanned admissions in the New Zealand sample, but we found greater rates of admission in larger practices (incidence rate ratio [IRR], 1.45; 95% CI, 1.15-1.81) and practices staffed with a practice nurse (IRR, 1.74; 95% CI, 1.20-2.52) in the Netherlands sample. In both samples, differences were consistently small where there were significant associations with function (range, −0.26 to 0.19 NEADL points in the New Zealand sample; no associations in the Netherlands sample) and QOL (range, −1.64 to 0.97 QOL points in New Zealand; −0.01 EQ-5D points in the Netherlands).
CONCLUSIONS In the absence of substantial differences in older people’s function and QOL, it remains unclear whether intriguing GP- or practice-related variations in admission rates represent low- or high-quality practice.
- general practice
- practice patterns, physicians
- hospitalizations
- activities of daily living
- quality of life
- aged
- aged, 80 years and over
INTRODUCTION
With the aging of populations worldwide, the international commitment to experiencing greater healthy longevity is stronger than ever.1 Avoiding unplanned hospital admissions is an important goal for older people and health systems worldwide. Hospital-acquired infections,2,3 adverse events,4,5 and readmissions6 are more common in older patients than in other age groups, and hospitalizations trigger functional decline7-10 and diminish quality of life (QOL) in older persons.11 Function and QOL are arguably the most salient outcomes because these are prioritized by older people themselves,12-14 and improved efficiency of health service delivery should not come at a cost to QOL. The availability of primary health care is valued through the later years in life; older people tend to prefer seeing a particular physician,15 are willing to wait more than 2 days longer to see their preferred general practitioner (GP),16 and tend to stay with their physician of choice over the years.17 The focus of the present study was the manner in which primary care can influence unplanned hospitalizations, function, and well-being.
Individual practice styles of physicians and practice contexts, which provide opportunities and constraints with respect to physician preferences, have long been regarded as drivers of health care utilization,18 but estimates of the contribution of GP and practice factors to variation in unplanned hospital stays are limited. For example, the effect of practice size on admission rates is not consistent; smaller practices have greater rates of admission for asthma but not for chronic obstructive pulmonary disease or cardiovascular conditions.19 In contrast, there is more consistent evidence on case mix of practice populations,20-23 with older patient age, lower socioeconomic status, and the presence of multiple chronic health conditions or multimorbidity as recognized patient-level risk factors for unplanned hospitalizations.24 Thus, attempts to untangle the influence of primary care factors on secondary care utilization should adjust for individual patient health status.
Questions also remain as to whether the characteristics of primary care practices older patients are enrolled in, or the GPs they see, influence functional status and QOL independently of health and social characteristics. Many of the emerging interventions to improve the ways in which primary care is practiced and organized have failed to show substantial improvements of these patient-reported outcomes. A meta-analysis of 8 trials integrating primary care in the Netherlands showed no significant effect in older people25; less than one-half of trials addressing multimorbidity in another review reported improvements in outcomes.26 A total of 12 of the 18 trials in that review focused on change to the organization of care delivery.26 A number of recent intervention trials, including changes to the skill mix,27,28 educational meetings,29,30 and clinical audits,28 regarding the care of older people also failed to show intervention benefit for both functional ability and QOL.
We aimed to estimate and compare variation in unplanned admission rates, functional ability, and QOL according to GP and practice characteristics in New Zealand and the Netherlands. General practitioner services are partially subsidized in New Zealand, where the health system is largely funded via general taxation.31 In the health care system in the Netherlands, which is predominantly financed via compulsory social health insurance, GP services are covered by the government-defined benefit package for basic health services.32 Common health systems features in New Zealand and the Netherlands are GP gatekeeping to secondary services and patient enrollment to GP practices.31,32 With multimorbidity on the rise,33-35 particularly for older people,36,37 there is growing concern about the increasing complexity of coordination of care and medical decision making,38,39 greater treatment burden to patients,39-41 and worsening function and QOL.36,42,43 Thus, we also specifically explored associations in older people with complex care needs and in relatively less-complex older people in this analysis.
METHODS
We performed a secondary analysis of data from 2 cluster-randomized controlled trials on improving primary care for older people: the Brief Risk Identification of Geriatric Health Tool (BRIGHT) trial in New Zealand and the Integrated Systematic Care for Older People (ISCOPE) trial in the Netherlands.
The methods and outcomes of the BRIGHT44,45 and ISCOPE46 trials have been described in detail elsewhere. The BRIGHT trial, which recruited 3,893 participants aged 75+ years (65+ years for New Zealand Māori), showed that proactive postal screening for disability followed by referral to regional geriatric assessment and rehabilitation services was no different from usual care in terms of decreased hospitalizations or increased residential care placement and had minimal effect on functional status and QOL.44 The ISCOPE trial, which recruited 7,285 participants aged 75+ years, found that proactive assessment and care planning for older people was no better than usual care in improving functional ability and QOL.46 Ethics approval for the trials was granted by the New Zealand Health and Disability Multi-Region Ethics Committee (BRIGHT) and the Medical Ethical Committee of the Leiden University Medical Center (ISCOPE). In the present study, we used data from 3,755 BRIGHT participants who completed baseline assessments and 3,141 ISCOPE participants randomly selected for comprehensive baseline assessments to investigate variation in older primary care patients’ hospitalizations, functioning, and QOL attributable to GP and practice characteristics, with adjustment for baseline participant health, demographic characteristics, and trial group assignment to intervention or control. Supplemental Appendices 1 and 2 (https://www.AnnFamMed.org/content/19/4/318/suppl/DC1/) describe BRIGHT and ISCOPE variables used in the analysis, respectively.
Determinants
Determinants for this analysis were personal characteristics of GPs that might shape individual practice styles and practice contexts that provide opportunities and constraints to the realization of GP preferences. We selected a total of 21 GP- and practice-level variables obtained from BRIGHT GP and practice surveys and publicly accessible information on the New Zealand Medical Council database (Supplemental Appendix 1 https://www.AnnFamMed.org/content/19/4/318/suppl/DC1/) and 9 GP- and practice-level variables from personal and practice information provided by participating ISCOPE GPs (Supplemental Appendix 2 https://www.AnnFamMed.org/content/19/4/318/suppl/DC1/).
GP characteristics that were similar between the BRIGHT and ISCOPE data sets included age, sex, experience in general practice, number of older patients, and position in the practice. Similar practice characteristics were type of practice, location, and practice size. Information on home visiting was only obtained for the BRIGHT sample because maintenance of GP registration in the Netherlands requires performance of afterhours duties including home visits. For BRIGHT, the home visiting variable was used by itself and in the summary score for number of proactive processes (along with using assessment tools, auditing the practice, having clinics for frail older patients, and systematically contacting patients). Nurse staffing was a variable of interest only in the ISCOPE sample because practice nurses are universal in New Zealand general practice.
Outcome Measures
We were interested in rates of unplanned admissions, functional ability, and QOL at 36 months in the BRIGHT sample and at 12 months in the ISCOPE sample. For BRIGHT participants, unplanned admissions were defined as acute or arranged (<1 week from decision to admission) hospitalizations in the National Minimum Data Set of hospital events as systematically allocated by New Zealand Ministry of Health data processes; records of unplanned admissions were determined using participants’ National Health Index number, a unique identifier. ISCOPE participants were asked to self-report on hospital admissions in the past year as part of The Older Persons and Informal Caregivers Survey Minimum Data Set data-sharing initiative in the Netherlands.
Functional ability was assessed by the Nottingham Extended Activities of Daily Living (NEADL)47 scale (range, 0-22) in the BRIGHT trial and the Groningen Activity Restriction Scale48 (range, 18-72) in the ISCOPE study. As for QOL, the outcomes comprised 4 domains (physical, psychological, social, and environmental) rated using the brief version of the World Health Organization Quality of Life assessment tool49 (range, 0-100) in the BRIGHT trial and the summary index of the 5 dimensions (mobility, self-care, daily activities, pain, and mood) of the EuroQol EQ-5D50 (Dutch tariff range, −0.38 to 1.00) in the ISCOPE trial.
Analysis
Descriptive statistics were generated for all patient-, GP-, and practice-level variables used in the analysis and presented by study sample and by complexity of care needs where possible. For each outcome, we fitted 3-level random intercepts models separately for the BRIGHT and ISCOPE samples, with participants as level-1 units, GPs as level-2 units, and practices as level-3 units. Poisson mixed models were fitted for models of unplanned admission rates, and linear mixed models were fitted for models of functional ability and QOL.
To adjust for the effects of the original studies’ respective interventions and the individual health and social characteristics of participants, we followed a 4-step procedure for each outcome in both samples: (1) a base model, consisting of group assignment in the respective trial and number of unplanned admissions before baseline, baseline function, or baseline QOL, as appropriate, was first specified; (2) patient-level variables were added to the base model 1 at a time (ie, separate models fitted for each candidate patient-level covariate), and where P ≤05, the variable advanced to the next step; (3) a full base model was specified by simultaneously adding patient-level variables that were significantly associated with the dependent variable as determined in the previous step; and (4) GP- and practice-level variables were then separately added to the full base model. This 4th step yielded an adjusted incident rate ratio (IRR) for unplanned admissions or an adjusted mean score variation in function or QOL attributable to a specific GP or practice characteristic. Adjusted IRRs for the BRIGHT sample additionally accounted for differences in the length of time participants were exposed to the risk of being admitted (eg, for patients who were unable to complete the trial because of poor health, residential care placement, or death). Interval estimates were obtained to a 95% confidence level.
We performed subgroup analysis according to the anticipated complexity of older participants’ care needs. In the BRIGHT sample, the “complex care need” subgroup consisted of participants who reported ≥5 conditions or had myocardial infarction or angina; stroke; or chronic bronchitis, emphysema, or chronic lung problems owing to cigarette smoking. For the ISCOPE sample, participants who reported ≥4 conditions or those with heart failure; stroke, brain hemorrhage, cerebral infarction, or transient ischemic attack; or asthma, chronic bronchitis, or emphysema were considered to have complex care needs. We applied a different cutoff for multimorbidity, owing to differences in data available regarding chronic conditions (Supplemental Appendices 1a and 2a (https://www.AnnFamMed.org/content/19/4/318/suppl/DC1/); rationale in Supplemental Appendix 3 (https://www.AnnFamMed.org/content/19/4/318/suppl/DC1/)). The “noncomplex care needs” subgroup consisted of participants who did not meet our definition of complexity. After model estimation, the expected numbers of unplanned admissions per person-year conditional on model covariates were calculated. The resulting values, which we refer to as adjusted rates, are presented as scatterplot smoothing lines for continuous variables or boxplots for dichotomous variables.
For sensitivity analysis of variation in unplanned admission rates, we fitted negative binomial rather than Poisson models, pooled estimates from multiply imputed participant characteristics, and used alternative thresholds for complexity, which are described in Supplemental Appendix 3 (https://www.AnnFamMed.org/content/19/4/318/suppl/DC1/). We also performed P-value adjustment for multiple comparisons using the Bonferroni method (Supplemental Appendix 3 https://www.AnnFamMed.org/content/19/4/318/suppl/DC1/). We used Stata 11.0 (StataCorp LLC) and R (the R Foundation) to perform the analysis.
RESULTS
Supplemental Appendices 1 and 2 (https://www.AnnFamMed.org/content/19/4/318/suppl/DC1/) present the baseline characteristics of 3,755 BRIGHT and 3,141 ISCOPE participants, their GPs, and practices. In BRIGHT, 38.0% of the sample was categorized as complex; in ISCOPE, 45.6% were complex. On average, BRIGHT and ISCOPE GPs had been working in general practice for 17.4 (SD 8.7) and 19.9 (SD 10.4) years, respectively. BRIGHT GPs handled an average of 65.6 (57.7) older patients, whereas ISCOPE GPs handled an average of 149.0 (102.6). Compared with the BRIGHT GP sample, a smaller proportion of the ISCOPE GPs were female (40.7% vs 56.8% in BRIGHT).
Table 1 shows that the majority of the BRIGHT and ISCOPE samples did not have an unplanned hospitalization before baseline assessment and on follow-up. Good levels of function and QOL were also reported at baseline and on follow-up in both samples.
Unplanned Hospitalizations, Functional Ability, and QOL at Baseline and Follow-Up for the Entire Sample, Subgroup of Complex Participants,a,b and Subgroup of Noncomplex Participants (BRIGHT and ISCOPE Samples)
Variation in unplanned admission rates, functional ability, and QOL according to participant characteristics included in models for fully adjusted analysis are provided in Supplemental Appendix 4 (https://www.AnnFamMed.org/content/19/4/318/suppl/DC1/) (BRIGHT sample) and Supplemental Appendix 5 (https://www.AnnFamMed.org/content/19/4/318/suppl/DC1/) (ISCOPE sample) and show expected associations with hospitalizations and patient-reported outcomes (eg, more health problems associated with greater admission rates, worse function, and worse QOL).
GP- and Practice-Related Variation in Rates of Unplanned Admissions
Variation in rates of unplanned admissions accounted for by GP and practice characteristics after fully adjusting for participant characteristics are summarized in Figure 1 (for BRIGHT) and Figure 2 (for ISCOPE). In the BRIGHT sample, none of the characteristics examined had a significant association with 36-month unplanned admission rates in the fully adjusted analysis (Figure 1).
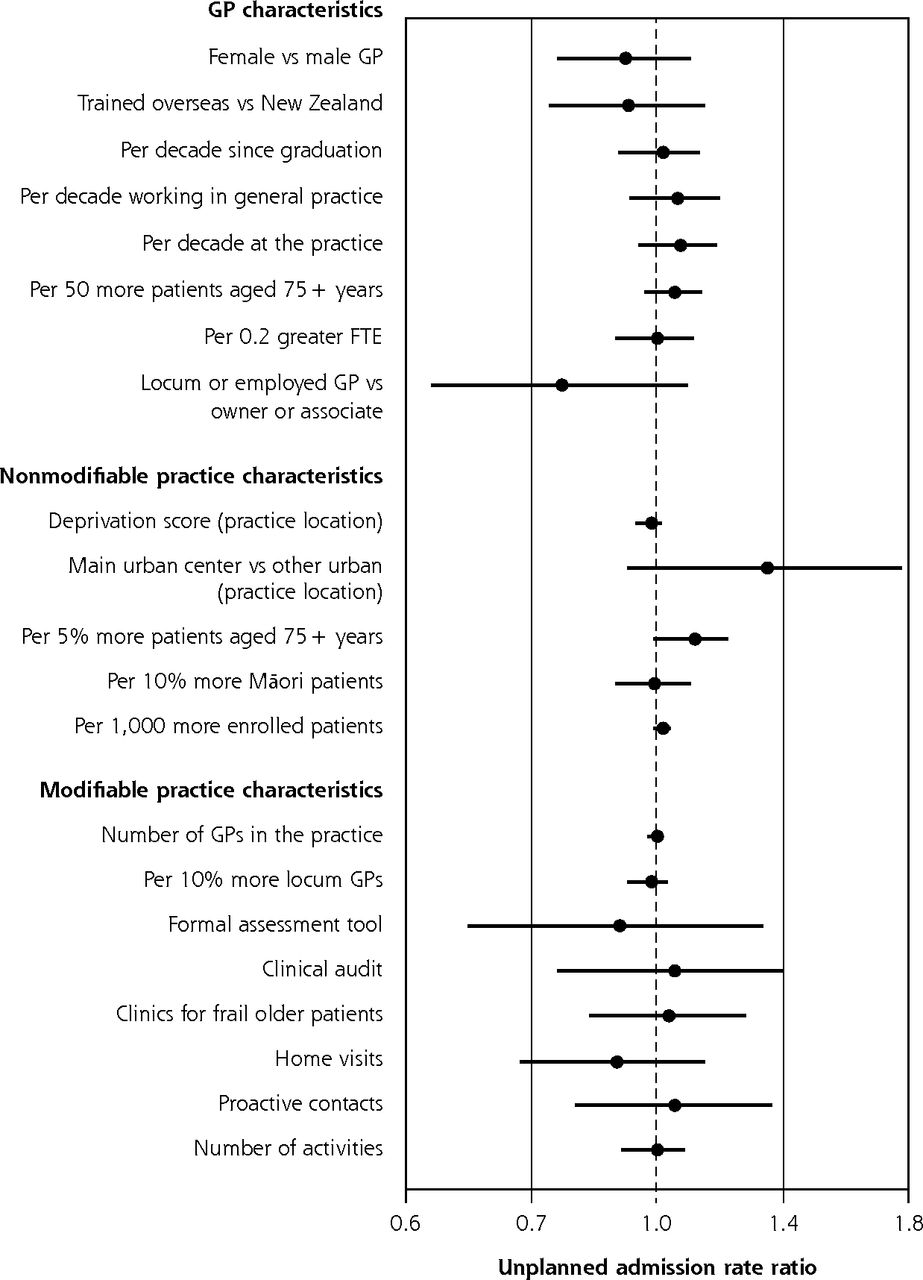
Variation in adjusted rate of unplanned admissions over 36 months according to GP and practice characteristics, for entire BRIGHT sample.a,b
BRIGHT = Brief Risk Identification of Geriatric Health Tool; FTE = full-time equivalent; GP = general practitioner; IRR = incidence rate ratio.
a Full base model for entire sample adjusts for group assignment in BRIGHT trial, number of unplanned admissions in 18-month period before baseline, age, sex, ethnicity, marital status, living arrangement, deprivation decile of participant’s home address, education, number of health problems, number of medications, Abbreviated Mental Test Score (cognition), Geriatric Depression Scale (GDS-15) score (depression), social support score, physical activity, smoking, alcohol consumption, frequency of alcohol intake, and nutritional risk score.
b Estimates to the right of the dotted line (IRR >1.0) imply greater admission rates.
In the ISCOPE sample, 12-month unplanned admission rates were 45% greater in duo or group practices compared to solo practices (Figure 2) (IRR, 1.45; 95% CI, 1.15-1.81). Practices staffed with a practice nurse also had greater rates of unplanned admissions (IRR, 1.74 nurse on staff vs no nurse; 95% CI, 1.20-2.52). There were no other significant associations between GP and practice characteristics and rates of unplanned admissions in the ISCOPE sample.
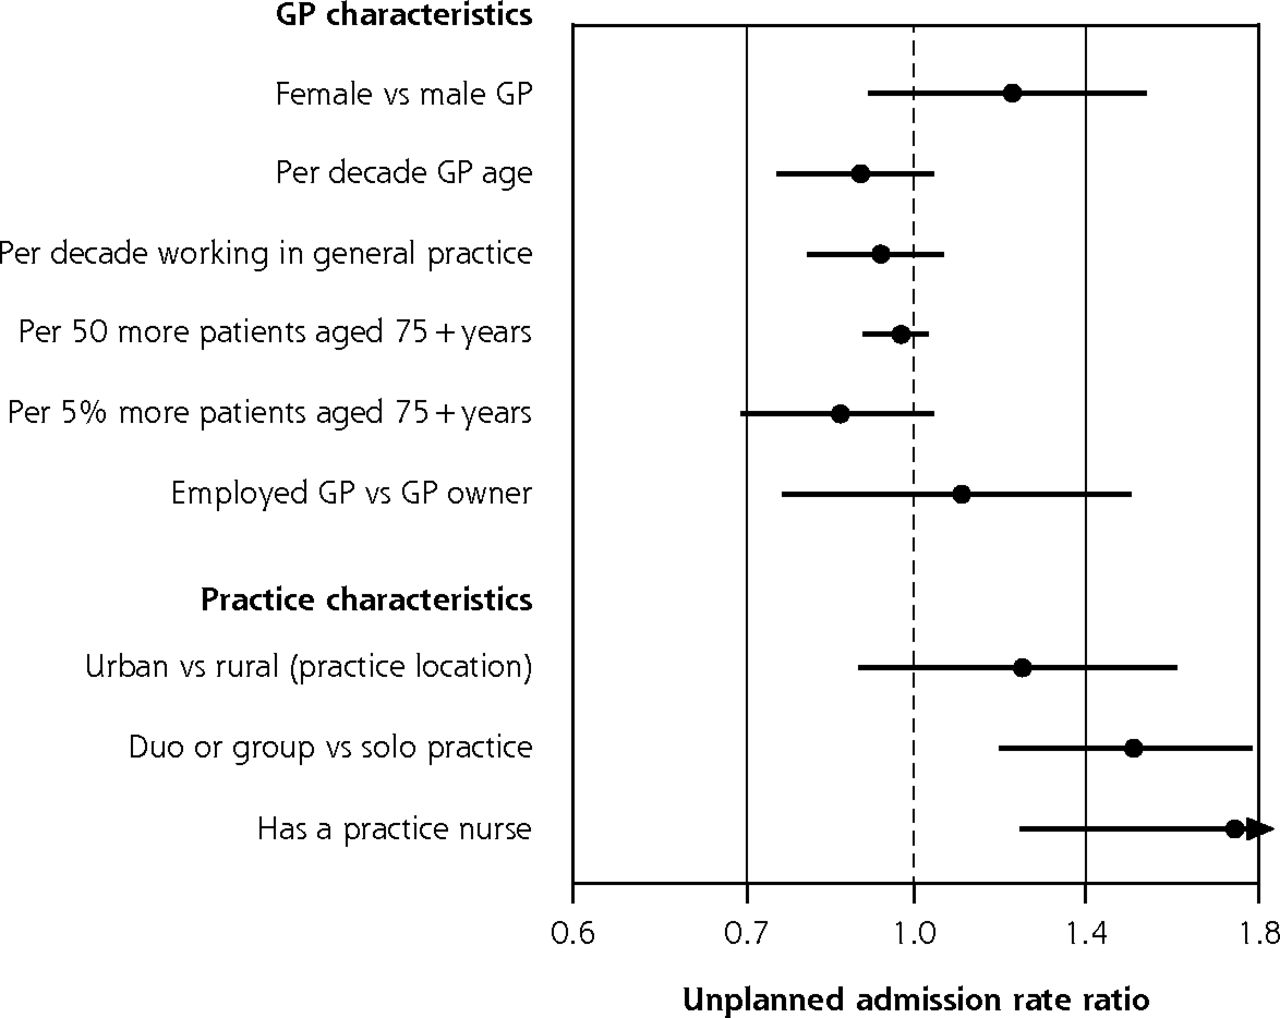
Variation in adjusted rate of unplanned admissions over 12 months according to GP and practice characteristics, for entire ISCOPE sample.a,b
GP = general practitioner; IRR = incidence rate ratio; ISCOPE = Integrated Systematic Care for Older People.
a Full base model for the entire sample adjusts for group assignment in the ISCOPE trial, number of unplanned admissions in the 12-month period before baseline, and number of health problems.
b Estimates to the right of the dotted line (IRR >1.0) imply greater admission rates; practice nurse estimate IRR >1.8 marked as ►.
GP- and Practice-Related Variation in Functional Ability
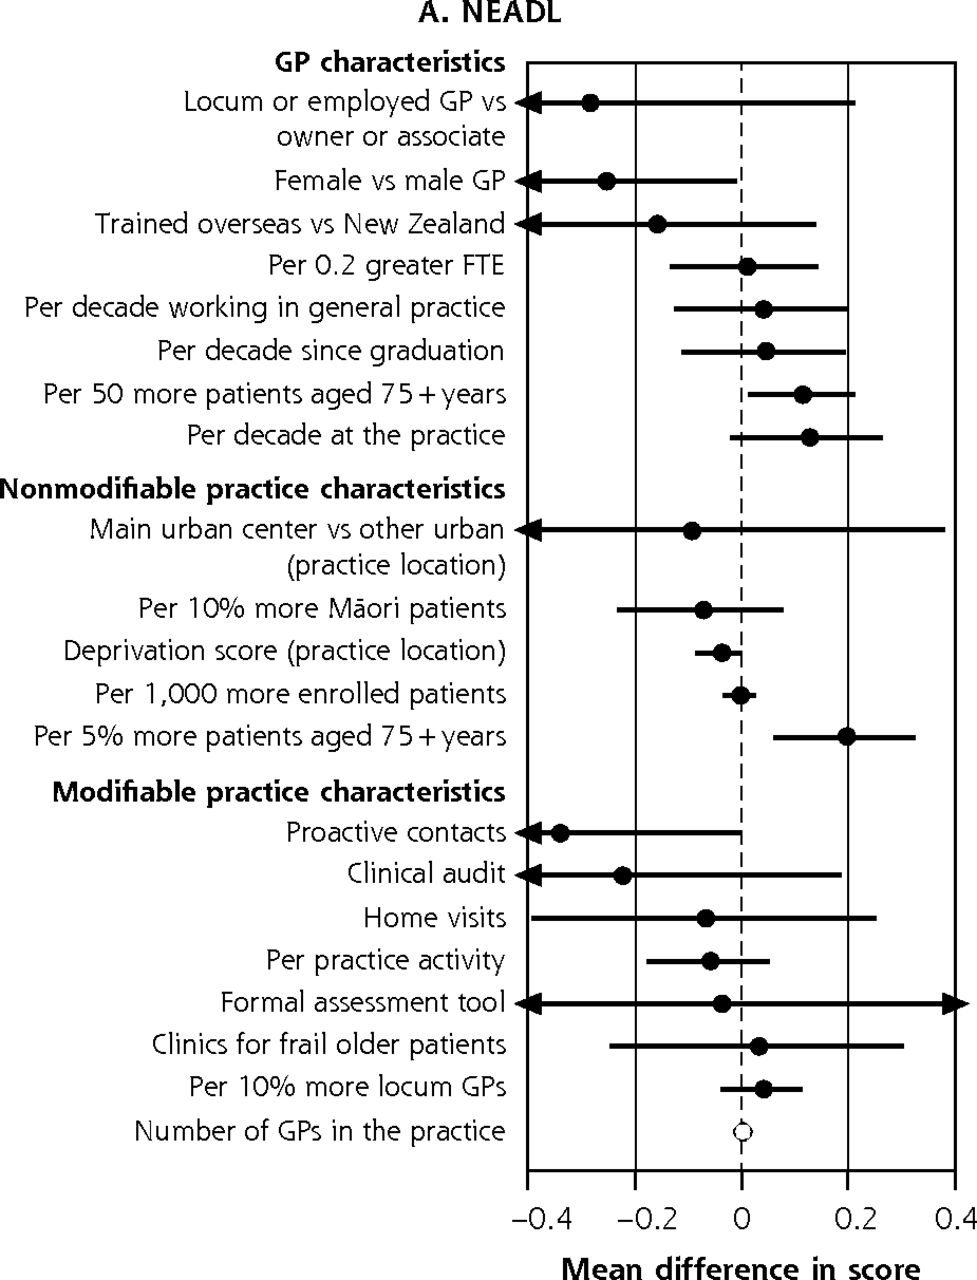
Figure 3a summarizes the contribution of GP and practice characteristics to variation in function after fully adjusting for participant characteristics, ranked by the size of associations. In the BRIGHT sample, participants seen by female GPs obtained 36-month NEADL scores that were 0.26 (95% CI, 0.01-0.51) points lower. The greatest significant positive association was a 0.19-point (95% CI, 0.06-0.33 points) greater NEADL score per 5% more patients aged 75+ years in the practice. In the ISCOPE sample, none of the characteristics examined were significantly associated with functional ability in the fully adjusted analysis (Figure 4a).


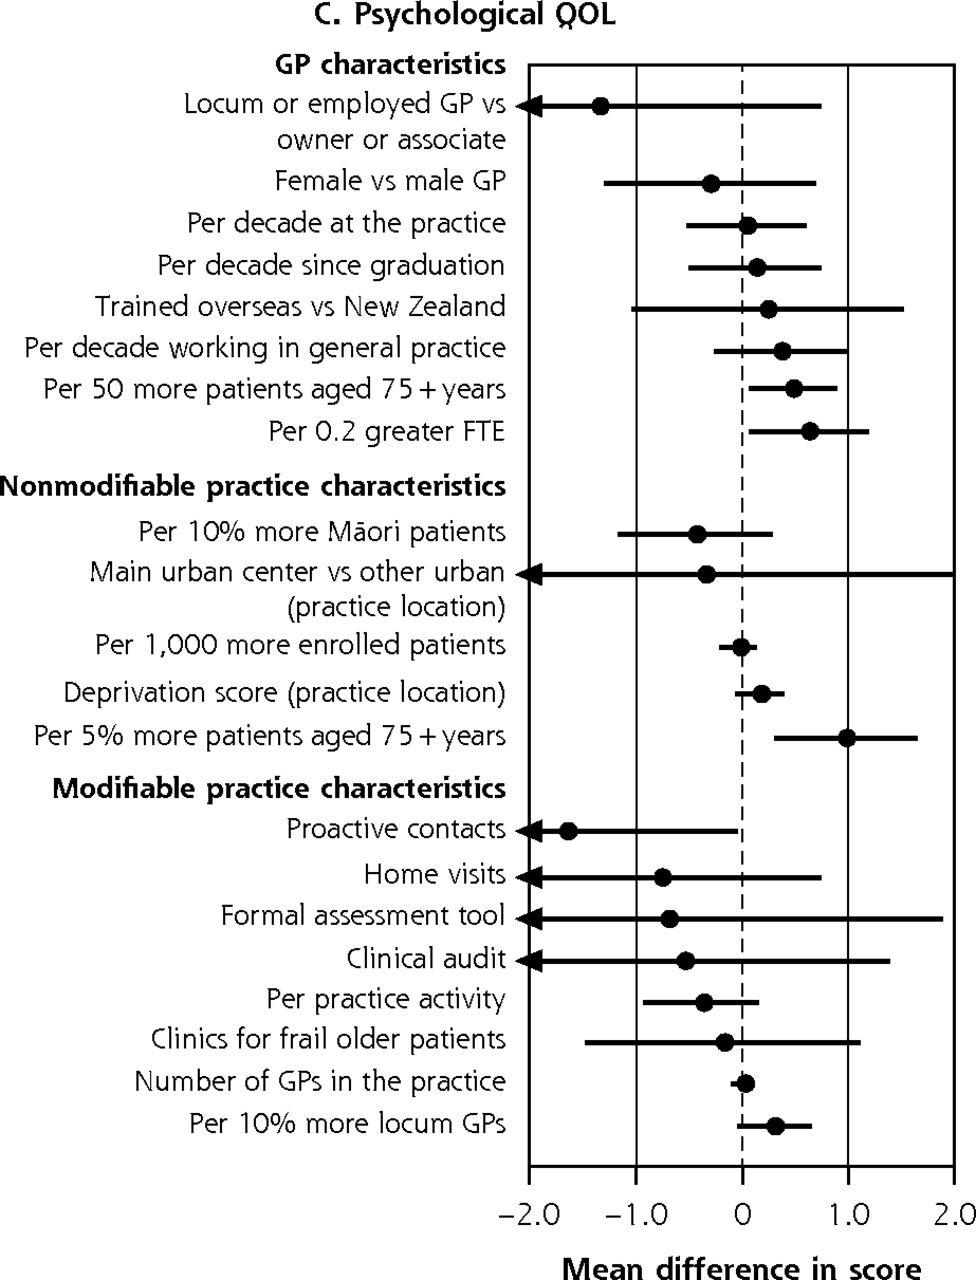


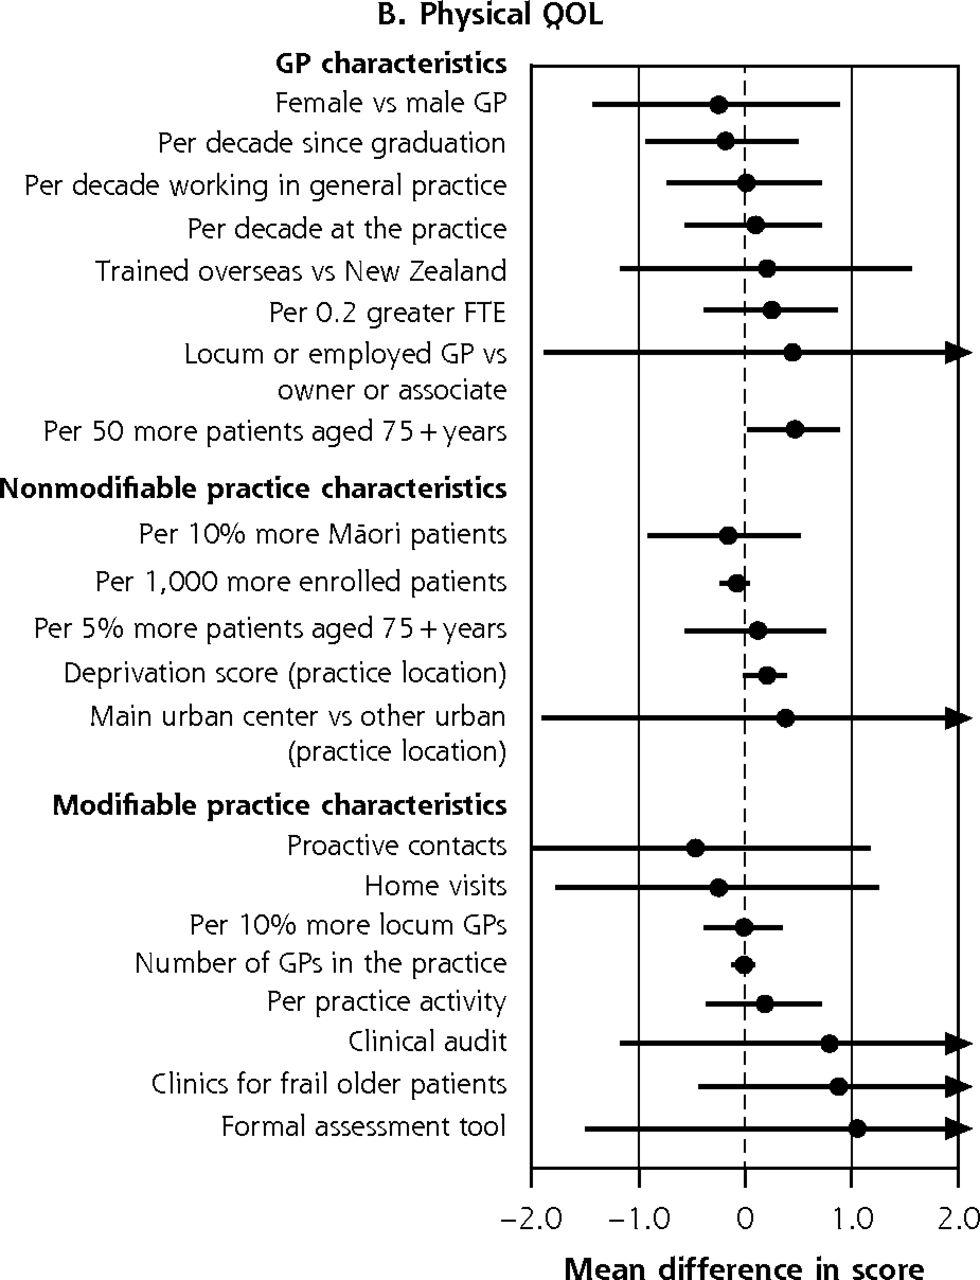
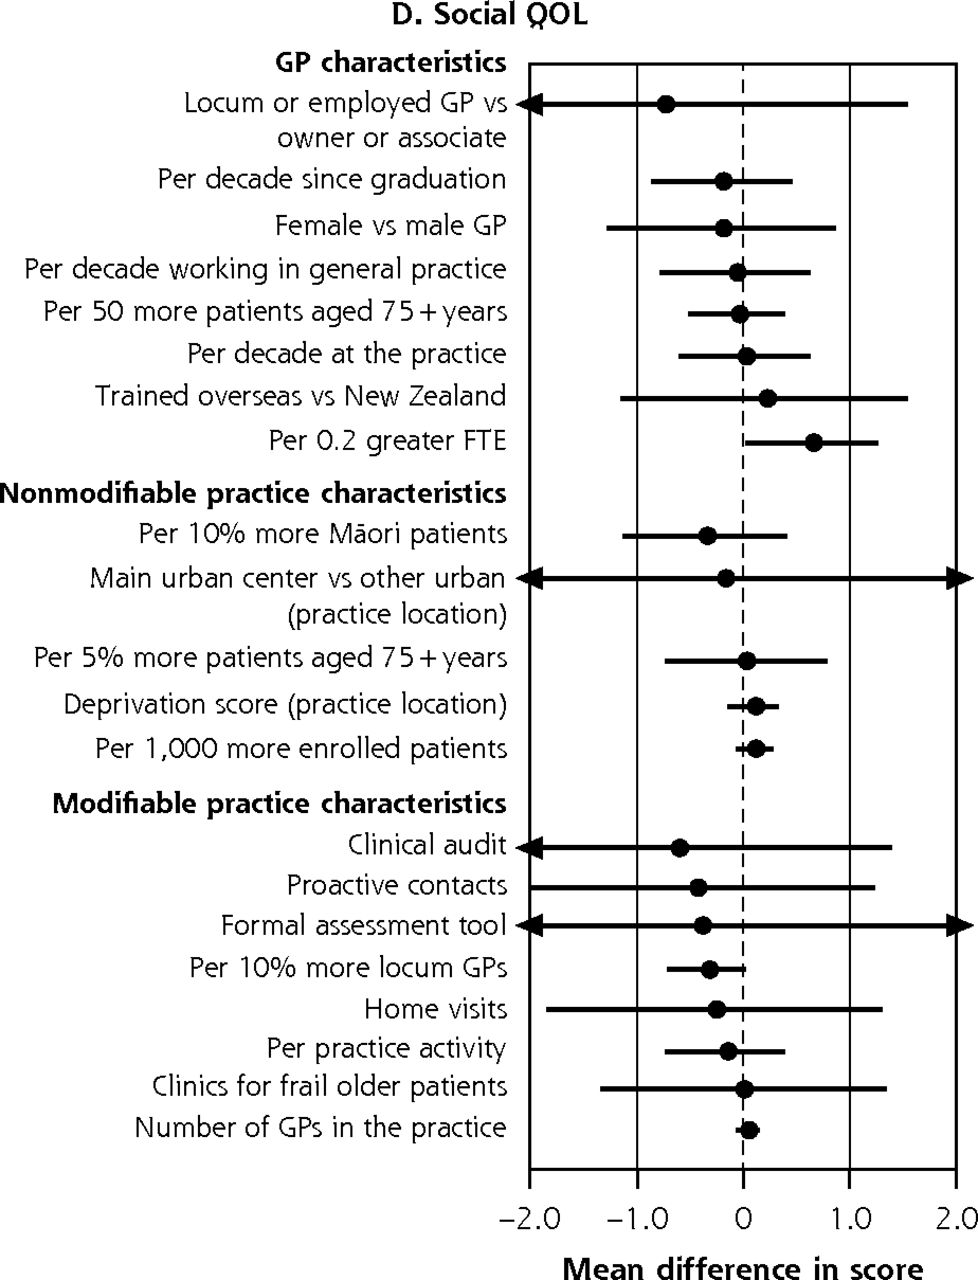
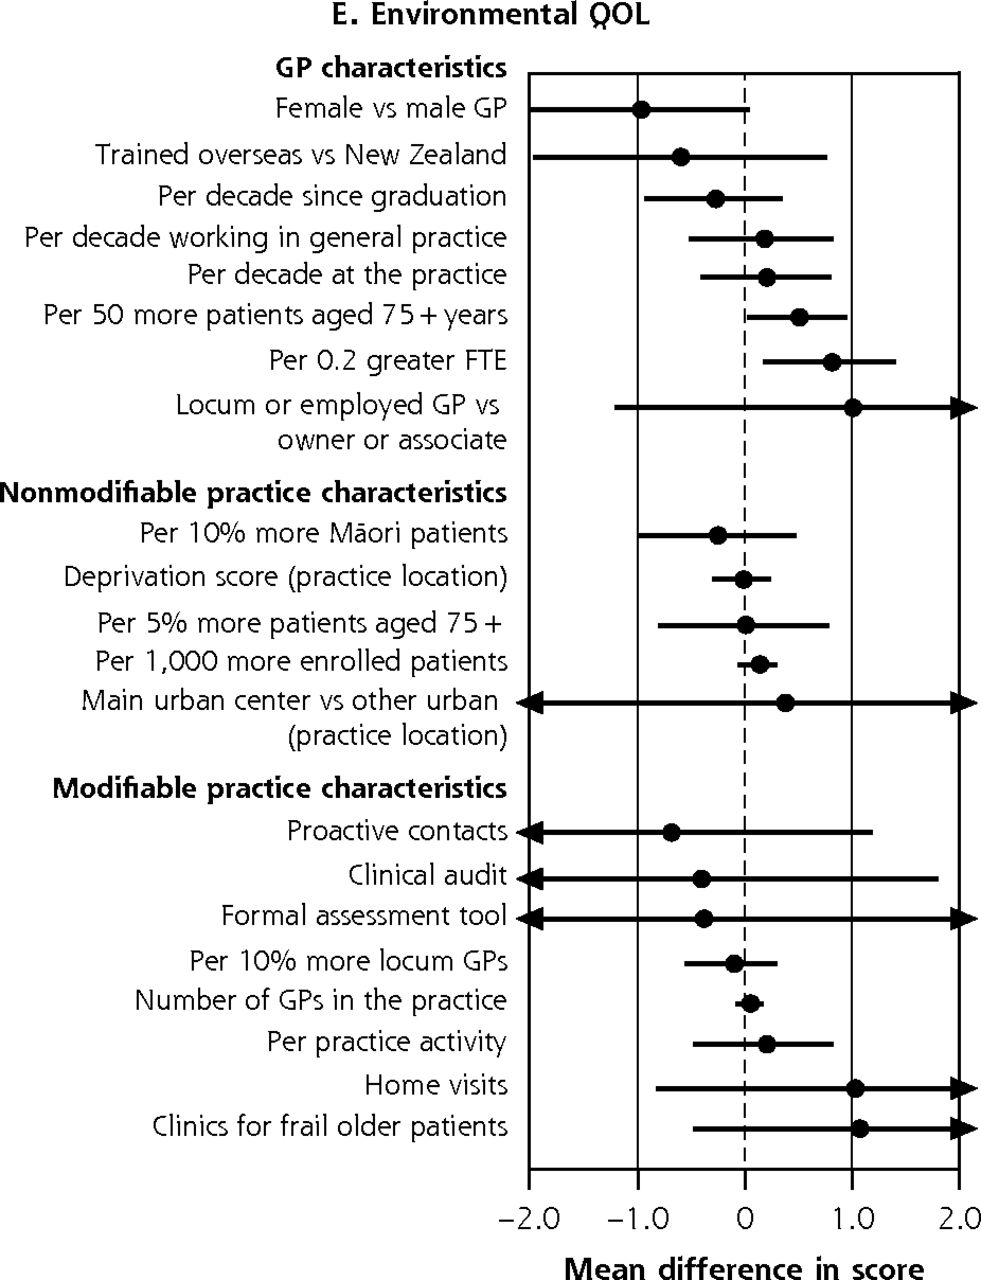
Variation in adjusted NEADL scorea and physical,b psychological,c social,d and environmentale QOL domain ratings at 36 months attributable to GP and practice characteristics, for entire BRIGHT sample.f
BRIGHT = Brief Risk Identification of Geriatric Health Tool; FTE = per 0.2 greater full-time equivalent; GP = general practitioner; NEADL = Nottingham Extended Activities of Daily Living; QOL = quality of life.
a 36-month NEADL full base model for the entire sample adjusts for group assignment in the BRIGHT trial, baseline NEADL score, age, sex, ethnicity, marital status, living arrangement, number of health problems, number of medications, Abbreviated Mental Test Score (cognition), social support score, physical activity, alcohol consumption, frequency of alcohol intake, and nutritional risk score.
b 36-month physical QOL full base model for the entire sample adjusts for group assignment in the BRIGHT trial, baseline physical QOL rating, age, living arrangement, number of health problems, number of medications, Geriatric Depression Scale (GDS-15) score (depression), social support score, physical activity, and nutritional risk score.
c 36-month psychological QOL full base model for the entire sample adjusts for group assignment in the BRIGHT trial, baseline psychological QOL rating, age, ethnicity, living arrangement, number of health problems, number of medications, Abbreviated Mental Test Score (cognition), Geriatric Depression Scale (GDS-15) score (depression), social support score, physical activity, alcohol consumption, frequency of alcohol intake, and nutritional risk score.
d 36-month social QOL full base model for the entire sample adjusts for group assignment in the BRIGHT trial, baseline social QOL rating, age, sex, ethnicity, number of health problems, number of medications, Abbreviated Mental Test Score (cognition), Geriatric Depression Scale (GDS-15) score (depression), social support score, physical activity, smoking, and nutritional risk score.
e 36-month environmental QOL full base model for the entire sample adjusts for group assignment in the BRIGHT trial, baseline environmental QOL rating, age, sex, marital status, living arrangement, number of health problems, number of medications, Abbreviated Mental Test Score (cognition), Geriatric Depression Scale (GDS-15) score (depression), social support score, physical activity, alcohol consumption, frequency of alcohol intake, and nutritional risk score.
f Estimates to the right of the dotted line imply better scores; below the line, worse scores. Models that failed to converge are marked with O (panel A); markings with ► represent estimates less than −0.4 and greater than 0.4 for NEADL and ◄ less than −2.0 and greater than 2.0 for physical QOL.


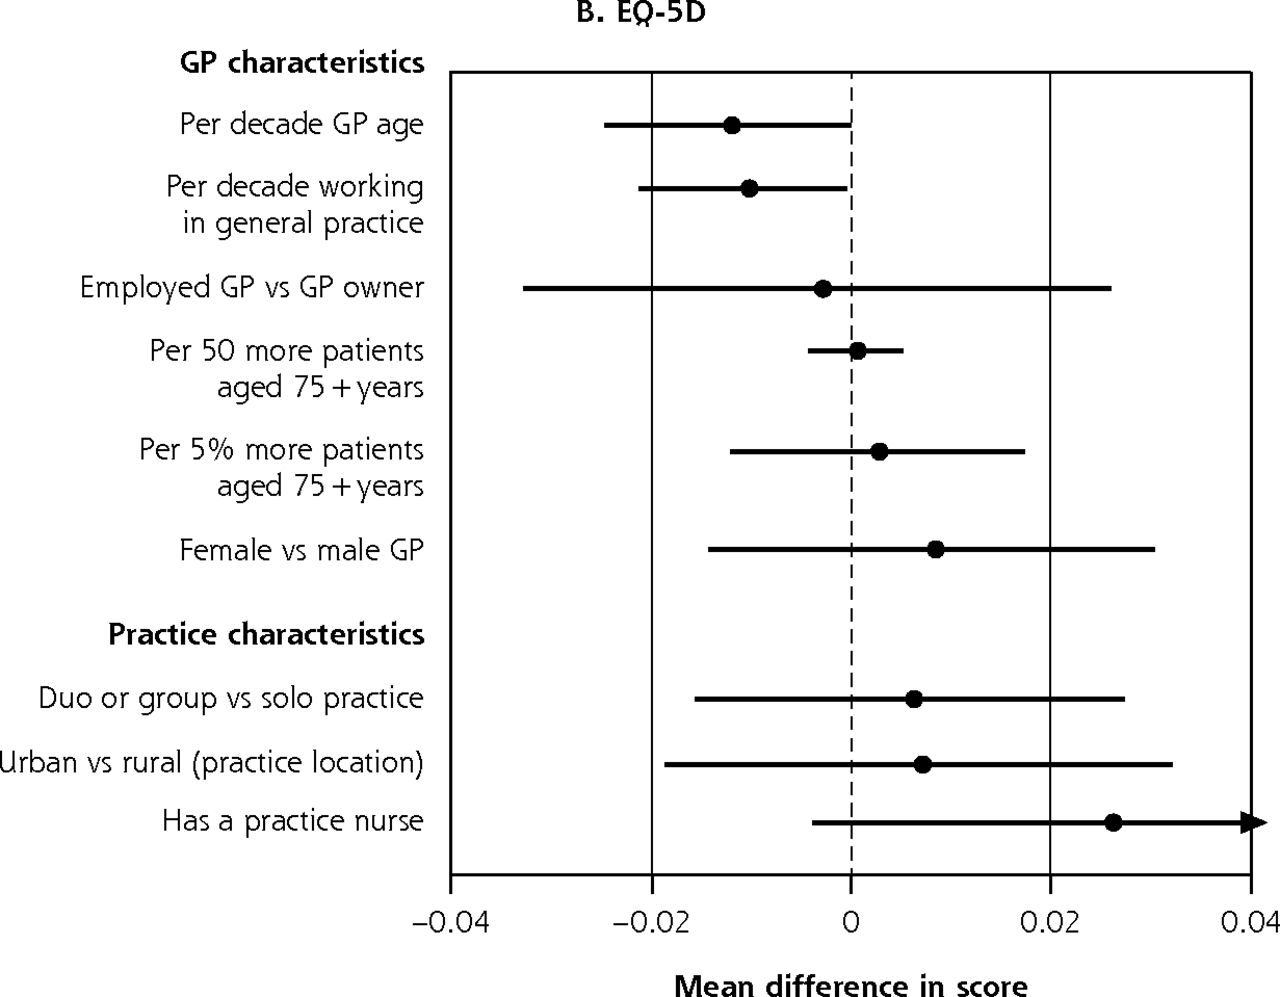
Variation in adjusted GARS scorea and EQ-5D scoreb at 12 months attributable to GP and practice characteristics, for entire ISCOPE sample.c
EQ-5D = EuroQOL 5 dimensions; GARS = Groningen Activity Restriction Scale; GP = general practitioner; ISCOPE = Integrated Systematic Care for Older People;
a 12-month GARS full base model for the entire sample adjusts for group assignment in the ISCOPE study, baseline GARS score, age, living arrangement, Mini-Mental State Examination score (cognition), and Geriatric Depression Scale (GDS-15) score (depression).
b 12-month EQ-5D full base model for the entire sample adjusts for group assignment in the ISCOPE study, baseline EQ-5D score, age, sex, marital status, living arrangement, education, source of income, number of health problems, Mini-Mental State Examination score (cognition), Geriatric Depression Scale (GDS-15) score (depression), and loneliness score.
c GARS estimates to the right of the dotted line imply worse scores; below the line, better scores. EQ-5D estimates above the line imply better scores; below the line, worse scores. Markings with ► represent estimates less than −1.2 and greater than 1.2 for GARS and ◄ less than −0.04 and greater than 0.04 for EQ-5D.
GP- and Practice-Related Variation in QOL
In the fully adjusted analysis of the BRIGHT sample, the size of significant variation across the 4 quality of life (QOL) domains ranged from 1.64 (95% CI, 0.05-3.24) points lower psychological domain ratings in practices that systematically contacted patients to 0.97 (95% CI, 0.30-1.64) points higher psychological domain ratings per 5% greater proportion of older patients in the practice (Figure 3b-e).
In the ISCOPE sample, we observed significant variation in quality of life attributable to GP age and GP experience in the fully adjusted analysis; EQ-5D scores of participants seen by older GPs and more experienced GPs were significantly lower by 0.01 points per decade older age or per decade working in general practice (95% CI, 0-0.02 for GP age and GP experience) (Figure 4b).
Subgroup Analysis
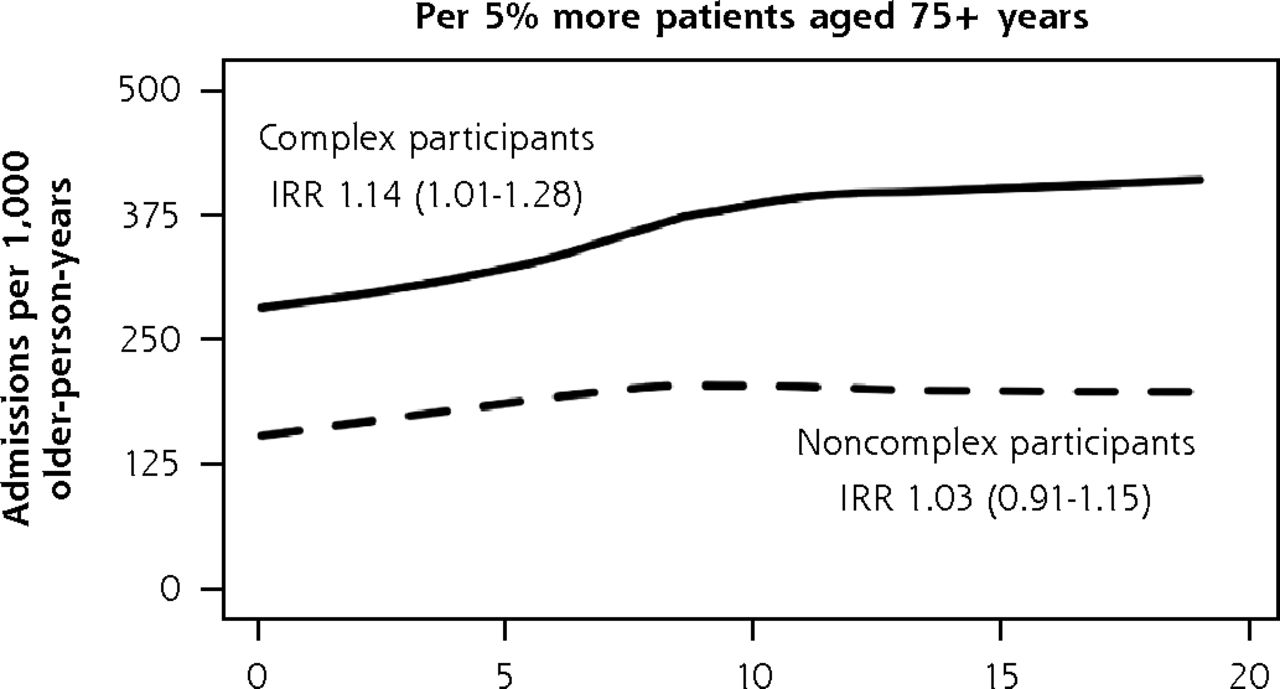
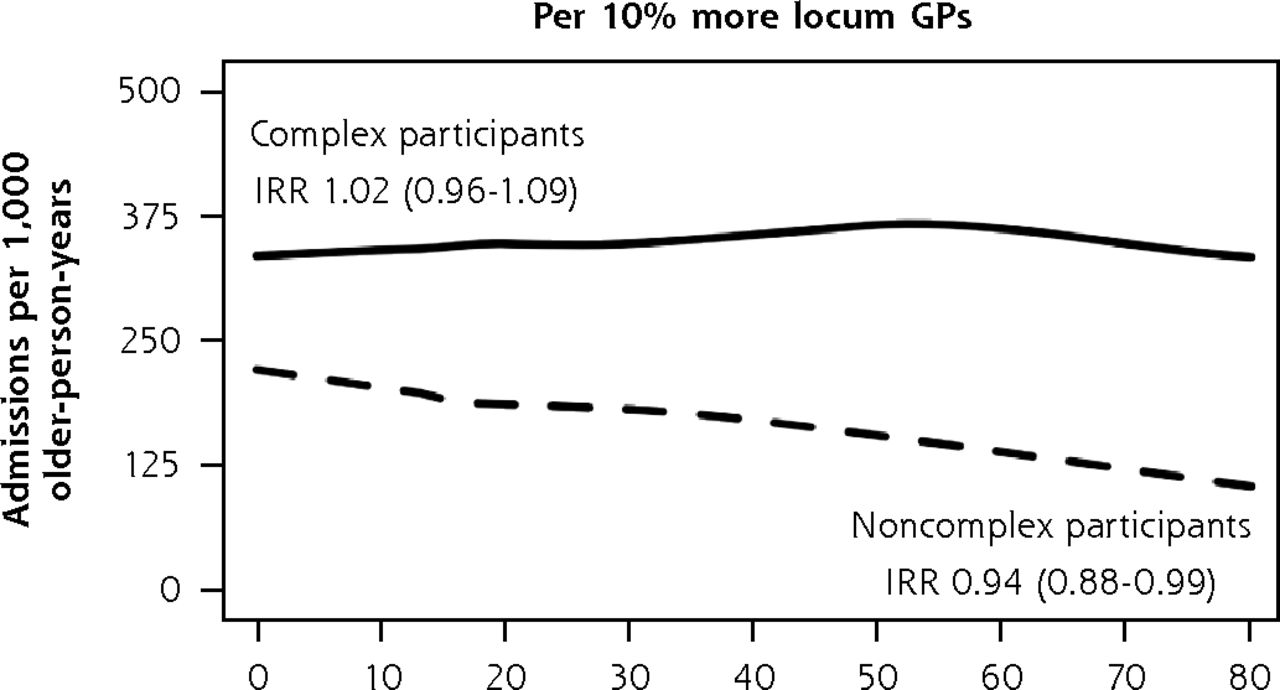
When we separately analyzed BRIGHT participants with complex and noncomplex care needs, 3 practice characteristics were associated with variation in 36-month rates of unplanned admissions (Figure 5). In the complex care needs subgroup, we observed a 14% greater rate of unplanned admissions for every 5% greater proportion of older patients in the practice (incident rate ratio (IRR), 1.14; 95% CI, 1.01-1.28). In noncomplex participants, unplanned admission rates were 69% greater in practices located in main urban centers (IRR, 1.69; 95% CI, 1.13-2.53) and 6% lower for each 10% greater proportion of locum general practitioners in the practice (IRR, 0.94; 95% CI, 0.88-0.99). The Supplemental Appendix 6 (https://www.AnnFamMed.org/content/19/4/318/suppl/DC1/) shows that none of these 3 characteristics were associated with functional ability, but we found slightly greater psychological quality of life domain ratings (1.17 points greater; 95% CI, 0.37-1.97) in complex participants attending practices with a greater proportion of older patients and in noncomplex participants of practices with a greater proportion of locum GPs in the practice (0.43 points greater; 95% CI, 0.05-0.82). The sizes of significant variation in functional ability and QOL according to other general practitioner and practice factors were also minimal.
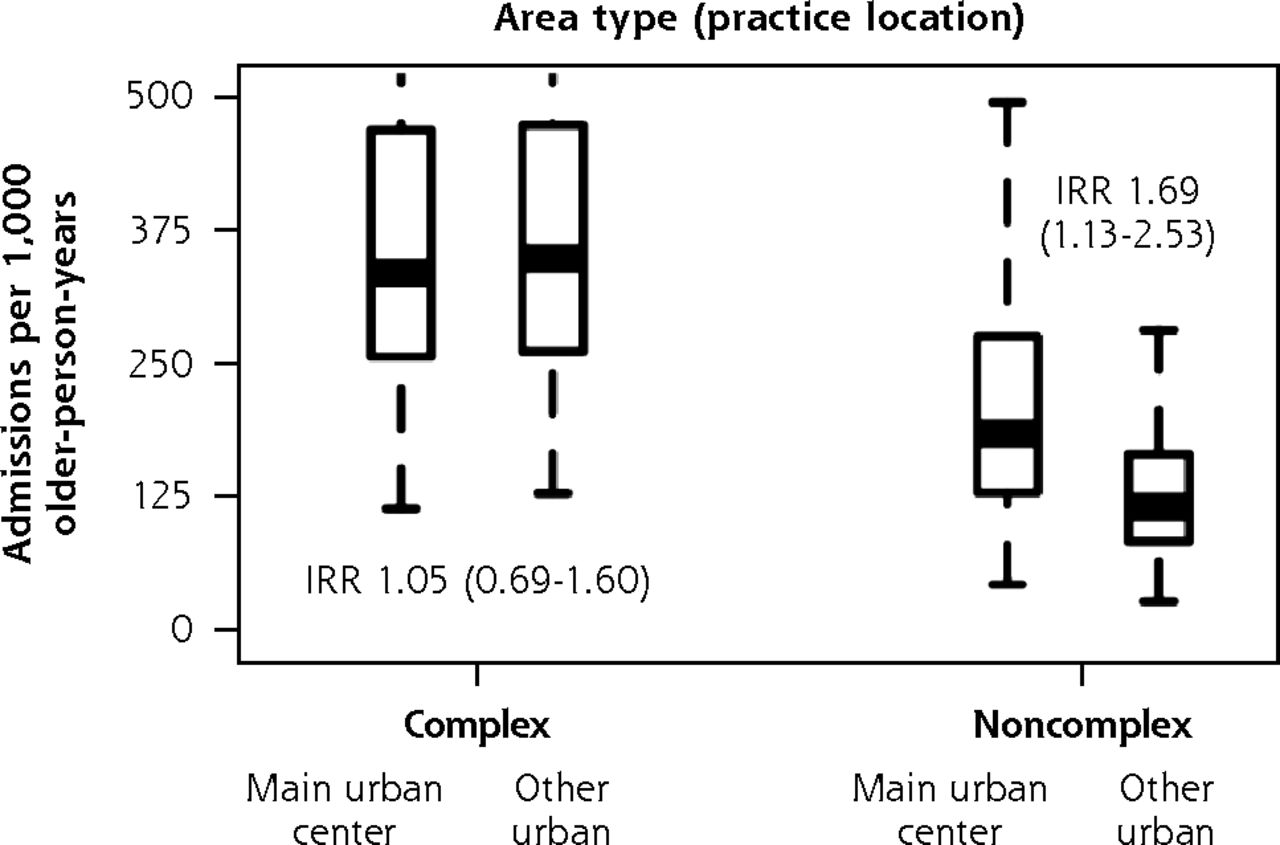


Adjusted numbers of unplanned admissions per 1,000 older-person-years (age 75+ years) in primary care according to participants’ care needs (complexa or noncomplexb) and practice characteristics, BRIGHT sample.
BRIGHT = Brief Risk Identification of Geriatric Health Tool; GP = general practitioner; IRR = incidence rate ratio.
a Full base model for the subgroup of participants with complex care needs adjusts for group assignment in the BRIGHT trial, number of unplanned admissions in the 18-month period before baseline, age, ethnicity, marital status, living arrangement, deprivation decile of participant’s home address, education, number of health problems, number of medications, Geriatric Depression Scale (GDS-15) score (depression), social support score, physical activity, alcohol consumption, frequency of alcohol intake, and nutritional risk score.
b Full base model for the subgroup of noncomplex participants adjusts for group assignment in the BRIGHT trial, number of unplanned admissions in the 18-month period before baseline, age, ethnicity, living arrangement, education, number of health problems, number of medications, Abbreviated Mental Test Score (cognition), Geriatric Depression Scale (GDS-15) score (depression), physical activity, frequency of alcohol intake, and nutritional risk score.
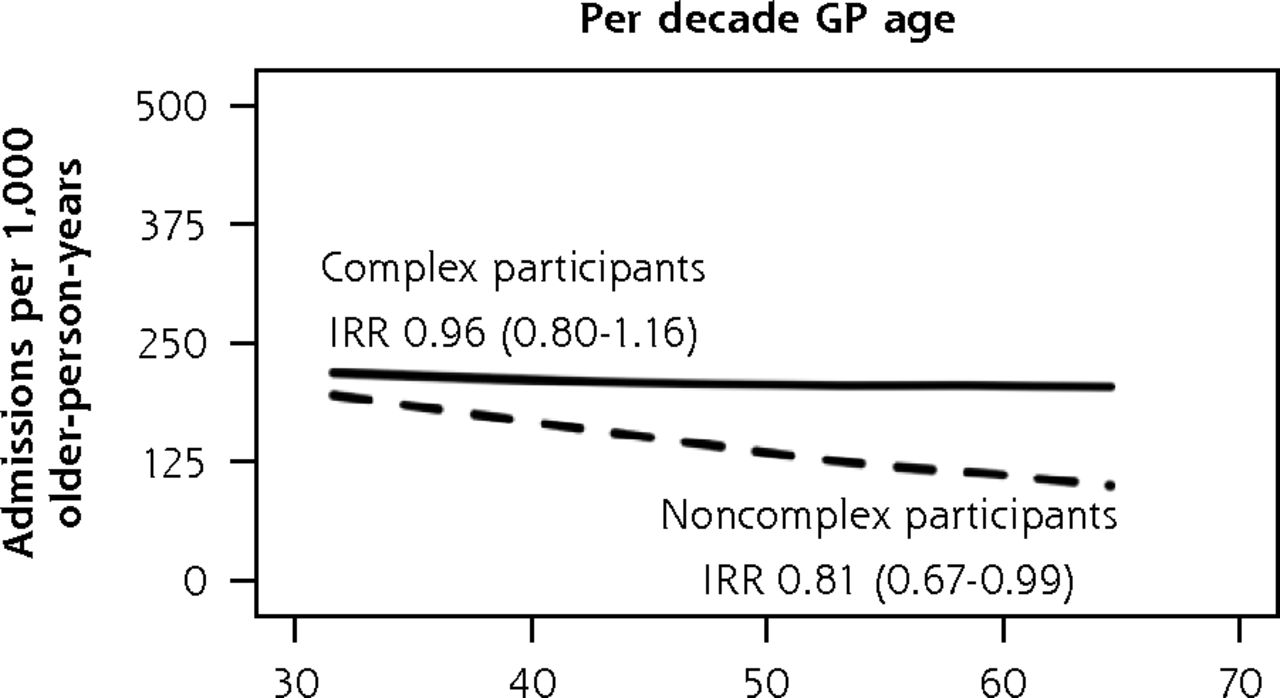
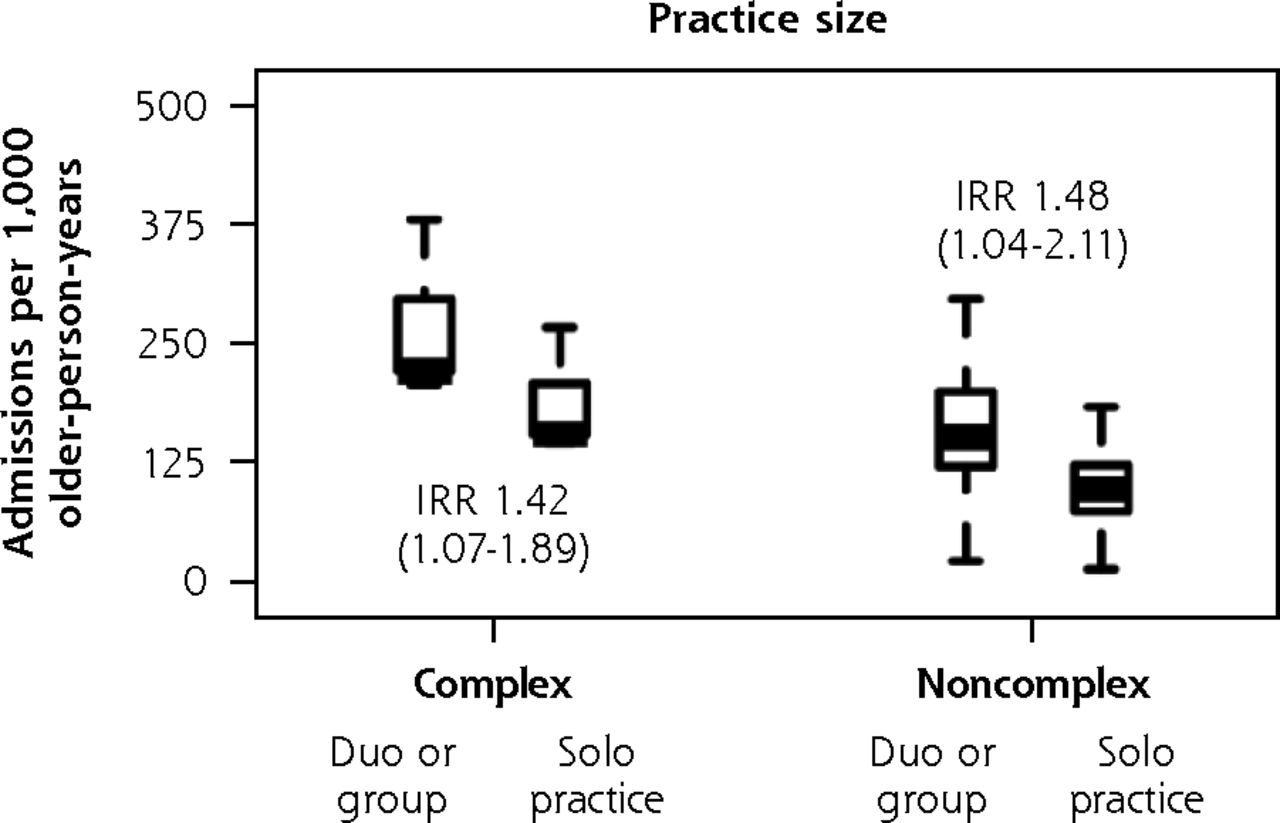
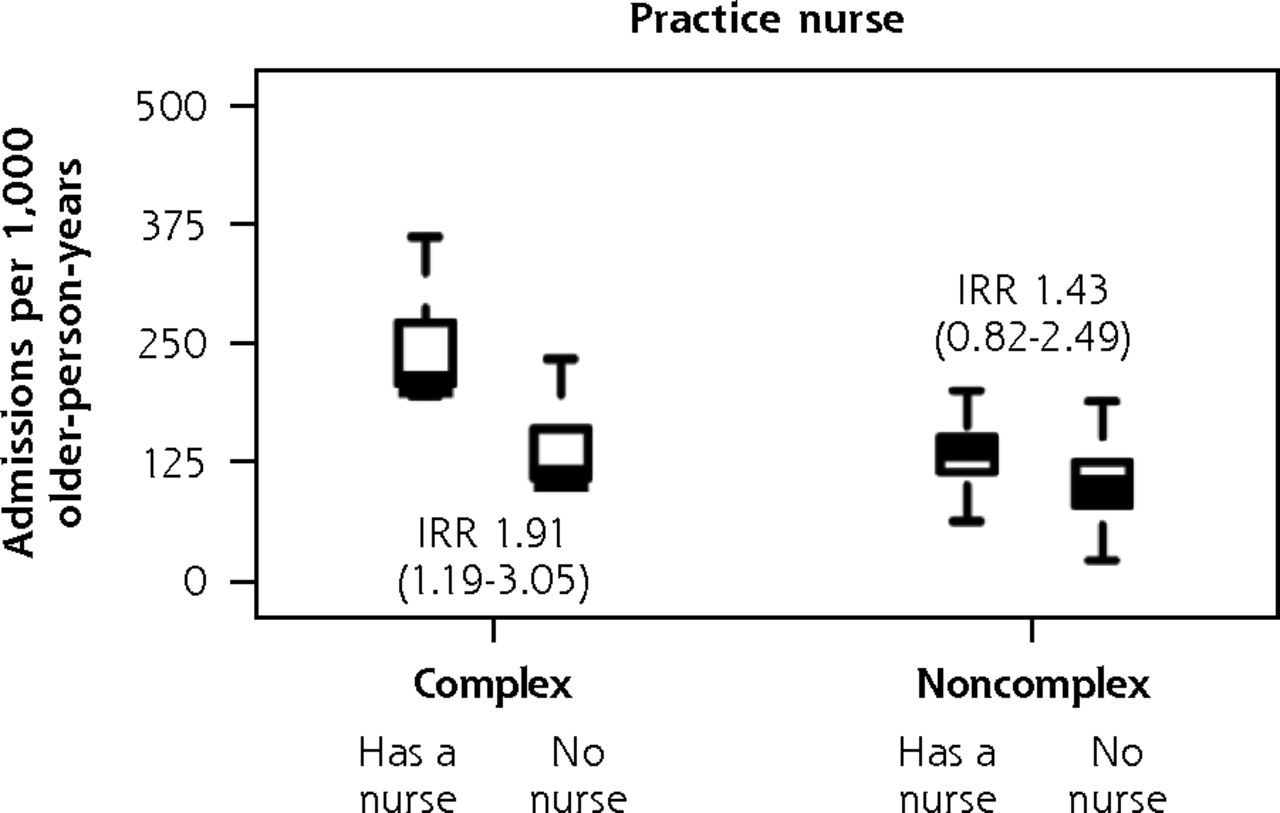
In subgroup analysis of the ISCOPE sample (Figure 6), variation in fully adjusted unplanned admission rates according to practice size remained significant for complex participants (IRR, 1.42 duo or group versus solo; 95% CI, 1.07-1.89) and noncomplex participants (IRR, 1.48 duo or group versus solo; 95% CI, 1.04-2.11). As with the findings in the main analysis, complex participants were also observed to have greater unplanned admission rates in practices that had a practice nurse (IRR, 1.91 nurse on staff versus no nurse; 95% CI, 1.19-3.05). We also found that noncomplex participants had a 19% lower rate of unplanned admissions for each decade older of their general practitioners’ age (IRR, 0.81; 95% CI, 0.67-0.99), and noncomplex participants of female general practitioners had 47% greater unplanned admission rates (IRR, 1.47; 95% CI, 1.03-2.10). We did not observe corresponding associations with functional ability and quality of life in complex participants and noncomplex participants. As with the BRIGHT subgroup analysis, the sizes of significant variation according to other general practitioner and practice factors were minimal (Supplemental Appendix 7, https://www.AnnFamMed.org/content/19/4/318/suppl/DC1/).

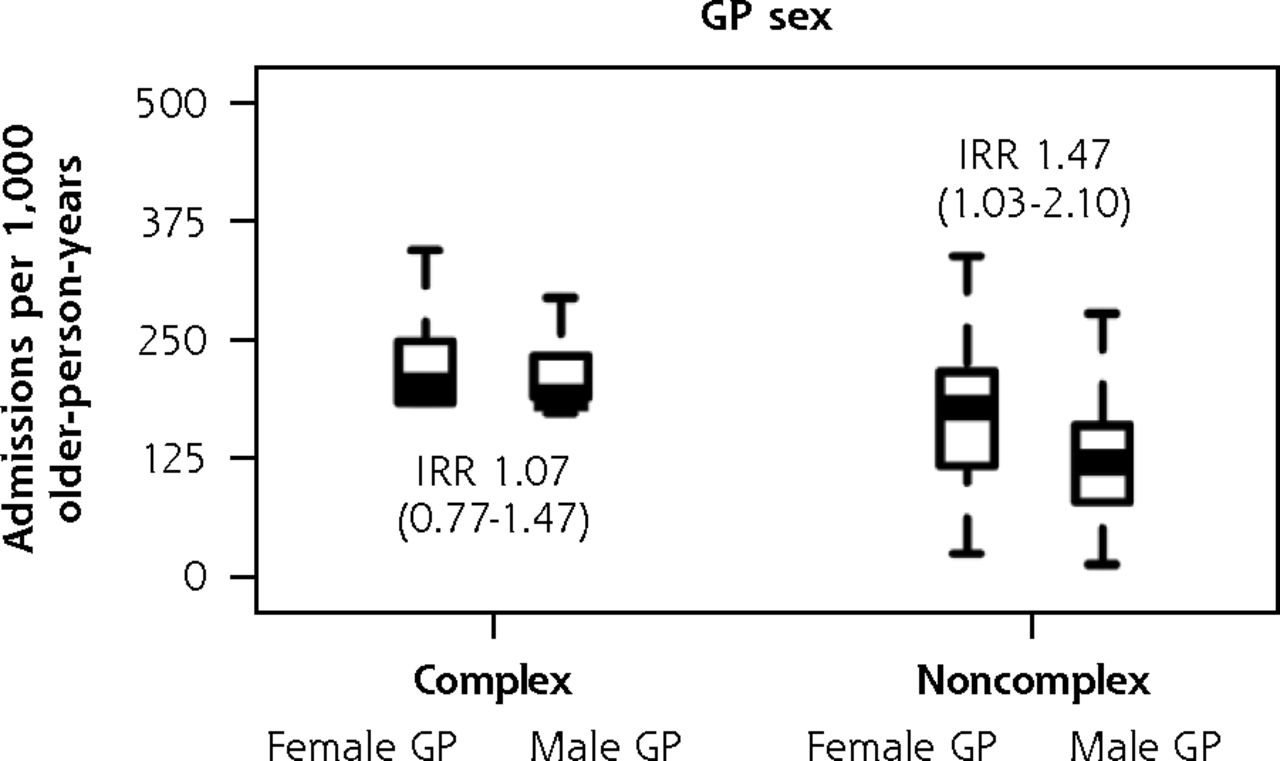


Adjusted numbers of unplanned admissions per 1,000 older-person-years (aged 75+ years) in primary care according to participants’ care needs (complexa or noncomplexb) and GP and practice characteristics, ISCOPE sample.
GP = general practitioner; IRR = incidence rate ratio; ISCOPE = Integrated Systematic Care for Older People.
a Full base model for the subgroup of participants with complex care needs adjusts for group assignment in the ISCOPE study, number of unplanned admissions in the 12-month period before baseline, and sex.
b Full base model for the subgroup of noncomplex participants adjusts for group assignment in the ISCOPE study, number of unplanned admissions in the 12-month period before baseline, living arrangement, and education.
Sensitivity Analysis for Variation in Rates of Unplanned Admissions
Compared with the findings of the BRIGHT subgroup analysis, qualitatively similar patterns of rate differences were observed for most models fitted in sensitivity analysis: greater rates in complex participants of practices with a greater proportion of older patients in the practice, greater rates in noncomplex participants of main urban center practices, and lower rates in noncomplex participants of practices with a greater proportion of locum GPs in the practice (Supplemental Appendix 8, https://www.AnnFamMed.org/content/19/4/318/suppl/DC1/).
We obtained similar results in sensitivity analysis of the ISCOPE sample: greater rates of admissions in duo or group practices in models for the entire sample, the complex subgroup, and the noncomplex subgroup; greater rates in practices staffed with a nurse in models for the entire sample and the complex subgroup; lower rates in noncomplex participants of older GPs; and greater rates in noncomplex participants of female GPs (Supplemental Appendix 9, https://www.AnnFamMed.org/content/19/4/318/suppl/DC1/).
Bonferroni-Adjusted P Values for Variation in Rates of Unplanned Admissions
Using the Bonferroni-adjusted significance threshold of P <.0008 for the BRIGHT sample, none of the characteristics examined had a significant association with unplanned admission rates in the main analysis, complex subgroup analysis, or noncomplex subgroup analysis. In the main analysis of the entire ISCOPE sample, unplanned admission rates in duo or group practices remained significantly greater than in solo practices when we adjusted the significance threshold to P <.0019.
DISCUSSION
Very little variation in unplanned admission rates was accounted for by GP and practice characteristics in the group of New Zealand practices included in a trial about care of older people; however, in the Netherlands sample, we found greater unplanned admission rates in larger practices and in those staffed with a practice nurse. In both countries, the sizes of the differences in older participants’ functional ability and QOL associated with GP and practice characteristics were very small after adjusting for individual health and social characteristics.
Larger practices might have better organizational capacity, including use of technologies such as electronic health records and clinical decision support, to support activities to improve quality of care.51,52 Patients of larger practices, however, are less likely to see their preferred GP compared to those registered with smaller practices,15 suggesting better continuity of care in smaller practices.53,54 In the present analysis, we found greater rates of unplanned admissions in larger practices in the ISCOPE sample. This finding might represent lower-quality practice given that previous studies have shown that poorer continuity of care is associated with more hospitalizations.53,55,56 Alternatively, it might suggest identification of patient needs requiring hospitalization that would otherwise be undetected, that is, a higher-quality practice. Considering patient-reported outcomes alongside unplanned hospitalizations might help explain this perplexing pattern of rate differences. We did not observe greater functional ability or QOL associated with larger practices in the ISCOPE sample. In the BRIGHT sample, practice size had no influence on patient-reported outcomes or admission rates. Interventions focused on the practice and organization of primary care have also shown limited success in improving function and QOL.25,26 It is possible that these broad outcome measures are less sensitive to structural changes in health care compared to other outcomes such as patient satisfaction, intermediate disease-specific outcomes, or process indicators, thus emphasizing the importance of including a mix of measures in describing intervention effects. We caution against interpreting low- or high-quality primary care practice based on variation in admission rates alone.
Prior studies have shown that practice nurse staffing is associated with better quality of care for chronic conditions such as diabetes,57-60 possibly via increased primary care engagement, thus enabling closer monitoring and improved support for self-management.61,62 In the present analysis, we observed unexpectedly greater rates of unplanned admissions in ISCOPE practices that had a practice nurse, mainly driven by the complex care needs subgroup. Practice nurses were introduced in the late 1990s in the Netherlands.32 They carry out home visits and consultations in various formats (face-to-face, telephone, e-mail) and are in charge of patients with diabetes and cardiovascular disease.32 As we suggested in relation to practice size, questions remain as to whether greater admission rates in ISCOPE practices staffed with a nurse represent low- or high-quality practice, given that functional ability and QOL were comparable to that of practices that did not have a nurse. Practices choosing to add a practice nurse in response to a sicker practice population (uncontrolled confounding) or to already high admission rates (reverse causation) are other possible explanations for our finding. In New Zealand, practice nurses have been universal in general practice since the 1970s, with variable roles,63 thus constraining the ability to examine effect.
There were patterns of rate differences associated with GP staffing that appeared to be sensitive to complexity of care needs. Noncomplex participants of older and male GPs in the ISCOPE sample had lower rates of unplanned admissions and comparable functional ability and QOL. In the BRIGHT sample, lower admission rates were observed in noncomplex participants of practices with more locum GPs; slightly greater ratings of psychological QOL were given by noncomplex participants attending practices with more locum GPs. These associations in older people who might be sufficiently healthy to recover from an acute episode of illness added yet another layer of difficulty to interpretation. The case for unmet needs requiring correction (ie, missed admissions) can be argued, but fewer admissions might also point to potential opportunities for safely avoiding hospital stays in older people whose health does not appear to be on a declining trajectory.
For both the BRIGHT and ISCOPE samples, variation in older participants’ functional ability and QOL related to GP and practice characteristics was consistently small after adjustment of individual characteristics. It is possible that in health care settings where there is universal access to a consistent point of care, older people who share similar characteristics have comparable health outcomes over time regardless of which practice or GP they choose. This is broadly consistent with work on the social determinants of health and well-being.64
A key strength of the present study is the linking of GP- and practice-level data to patient-level data, which allowed us to adjust for practice case mix using an extensive set of baseline health variables in examining variation in admission rates, functional ability, and QOL. We were unable to infer causality in this observational study but aimed to shed some light on how the practice older patients choose to enroll with, or the GP they see, influences their outcomes. In addition, considering the number of primary care factors examined, it is possible that the few significant associations were chance findings. Given the unresolved debate on routine P-value adjustment for multiple comparisons65-67 and questions regarding its usefulness when presenting the planned analysis as we did, we chose to approach interpretation by focusing on the magnitude of associations, the country context of the original study, and opposing plausible explanations, where appropriate, to assist the reader in judging whether the findings were detected by chance. Other significant associations observed in the present study are consistent with the literature; greater admission rates were observed in complex participants attending practices with a greater proportion of older people,68,69 and greater admission rates were observed in noncomplex participants attending main urban center practices.24 Qualitatively similar findings from subgroup and sensitivity analyses suggested that our overall findings are robust.
The data used in the present study were from the BRIGHT trial, which had response rates of 47% and 52% at the participant and practice levels, respectively,45 and the ISCOPE trial, which had response rates of 63% and 19% at the participant and GP levels.46 In both the BRIGHT and ISCOPE samples, the majority of participants did not have an unplanned hospitalization and had good levels of function and QOL at baseline and follow-up. Given the response rates of the original studies and the low variability in outcomes in the present analysis, an important limitation is the possibility of participation bias. That is, if there was a true positive relation between practice characteristics and older people’s outcomes, but practices already working toward improving care for older people were more likely to participate, the associations observed might have been biased toward the null. The findings of the present study are generalizable to at least the types of older primary care patients and practices who chose to participate in a trial about care of older people, and the expected nature of association between health and social status and outcomes at the individual level increase the generalizability of these findings. Other limitations from analyzing existing data include differences in the studies’ timing of follow-up visits, measures of outcomes, and availability of candidate patient-level covariates such as self-reported health problems and number of medications. Thus, we were unable to explore conditions contributing to final-pathway diagnoses or include an assessment of medication appropriateness in defining complexity. We were also unable to examine the effect of other factors that might characterize the relational aspect of primary care, such as patient-centeredness of GPs, satisfaction of patients, and continuity of care, because these were beyond the scope of the original studies.
In summary, our findings suggest that it can be difficult to determine whether GP- and practice-related variation in admission rates represents low- or high-quality practice in the absence of substantial differences in levels of function and QOL. In addition, increasing practice size and use of practice nurses might not necessarily decrease hospital admission rates. Thus, the central focus of international health policies on decreasing hospital overuse70 should approach primary health care structural reform carefully.
Further investigations are needed to determine how these primary care factors affect older people’s outcomes in settings in which primary care might be less accessible, enrollment of patients with practices might not be as widespread, or in countries where primary care funding and structure differ. Adding a qualitative component exploring older people’s perceptions, preferences, and experiences with their primary care providers before and after admission might provide a richer understanding of the context surrounding an unplanned hospitalization and should thus be considered in future studies.
CONCLUSION
Examining GP and practice characteristics from primary care–based trials of older patients in New Zealand and the Netherlands, we found intriguing associations with unplanned hospitalizations and consistently small associations with functional ability and QOL. Questions remain as to whether variation in admission rates in older people represents low- or high-quality practice when there is no clear evidence of benefit to patient-reported outcomes.
Footnotes
Conflicts of interest: authors report none.
To read or post commentaries in response to this article, go to https://www.AnnFamMed.org/content/19/4/318/tab-e-letters.
Funding support: The BRIGHT trial was funded by the Health Research Council of New Zealand (06-068, 09-068), and the ISCOPE study was funded by ZonMw, the Netherlands Organisation for Health Research and Development (ZonMw No. 311, 060, 201).
Previous presentations: The analysis on unplanned hospitalizations was presented at the 50th Australian Association of Gerontology Conference; November 8-10, 2017; Perth, Western Australia, and findings on the New Zealand sample were presented at the Primary Health Care Research Conference; August 1-3, 2018; Melbourne, Australia (all outcomes), and the International Association of Gerontology and Geriatrics World Congress; July 23-27, 2017; San Francisco, California (functional ability and QOL only).
Supplemental materials: Available at https://www.AnnFamMed.org/content/19/4/318/suppl/DC1/.
- Received for publication December 11, 2019.
- Revision received October 13, 2020.
- Accepted for publication January 4, 2021.
- © 2021 Annals of Family Medicine, Inc.


