
Abstract
PURPOSE Relationship continuity of care has declined across English primary health care, with cross-sectional and longitudinal variations between general practices predicted by population and service factors. We aimed to describe cross-sectional and longitudinal variations across the COVID-19 pandemic and determine whether practice factors predicted the variations.
METHODS We conducted a longitudinal, ecological study of English general practices during 2018-2022 with continuity data, excluding practices with fewer than 750 patients or National Health Service (NHS) payments exceeding £500 per patient. Variables were derived from published data. The continuity measure was the product of weighted responses to 2 General Practice Patient Survey questions. In a multilevel mixed-effects model, the fixed effects were 11 variables’ interactions with time: baseline continuity, NHS region, deprivation, location, percentage White ethnicity, list size, general practitioner and nurse numbers, contract type, NHS payments per patient, and percentage of patients seen on the same day as booking. The random effects were practices.
RESULTS Main analyses were based on 6,010 practices (out of 7,190 active practices). During 2018-2022, mean continuity in these practices declined (from 29.3% to 19.0%) and the coefficient of variation across practices increased (from 48.1% to 63.6%). Both slopes were steepest between 2021 and 2022. Practices having more general practitioners and higher percentages of patients seen the same day had slower declines. Practices having higher baseline continuity, located in certain non-London regions, and having higher percentages of White patients had faster declines. The remaining variables were not predictors.
CONCLUSIONS Variables potentially associated with greater appointment availability predicted slower declines in continuity, with worsening declines and relative variability immediately after the COVID-19 lockdown, possibly reflecting surges in demand. To achieve better levels of continuity for those seeking it, practices can increase appointment availability within appointment systems that prioritize continuity.
Annals Early Access article
- primary health care
- continuity of patient care
- physician-patient relationship
- health workforce
- delivery of health care
- office visits
- COVID-19
- allied health personnel
- telemedicine
- organizational change
INTRODUCTION
Continuity in primary (community-based) health care can be understood in different ways.1-3 We aimed to study therapeutic longitudinal (relationship) continuity of care (LCoC), defined as the repeated contact between an individual and the same general practitioner (GP)4 (Supplemental Table 1). LCoC is widely regarded as a key feature of primary care,5 valued by both clinicians6 and patients.7-9 Greater LCoC has benefits,10-20 but also potential harms.5,21-24 The national level of LCoC in England, using a recognized measure (described later), decreased from 27.0% to 16.6% of practice patients between 2018 and 2022.5,25,26
Patient characteristics,9,25,27,28 practice organization, and whether patients achieve their preferences can influence LCoC levels.27 Levels of these factors and their interactions may determine the type of continuity achieved.29 Even in the National Health Service (NHS), a single health system, changes in workloads,30 practice structures (eg, practice sizes, non-GP clinician numbers31,32), and practice processes (eg, triage potentially limiting choice) can affect the availability of preferred clinicians.
Demand for LCoC varies between patients and problem types, challenging appointment systems. LCoC is possibly a lower priority for managers of commercially owned groups of practices, which provide an increasing proportion of primary care in the United Kingdom.33
We previously examined variations in LCoC between English general practices during 2012-2017.25 Mean LCoC declined from 37.5% to 27.2%, with parallel decreases across all levels of patient socioeconomic deprivation. Population and organizational variables predicted variations, but effect sizes were small. The subsequent COVID-19 pandemic in 2020 transformed patients’ access to health care and how practices responded, potentially sparking further LCoC declines.
We hypothesized that persistent widespread declines in LCoC occurred, possibly exacerbated by pandemic lockdowns, with population and practice factors predicting variations between practices. We aimed to (1) describe cross-sectional and longitudinal variations of LCoC across English general practices during 2018-2022, and (2) determine whether practice-related factors predicted the longitudinal variations, after adjusting for practice population characteristics. Identifying such predictors could inform planned remedies in postpandemic health systems.
METHODS
Overview
This study was an ecological, longitudinal retrospective cohort study. All data used were published summary statistics. We used Organisation Data Service codes34 to define practices and then merge the data sets. The data used are highly aggregated and present no risk to patient confidentiality; therefore, no ethical approval was deemed necessary for this research.
Study Population
England’s primary health care system is comprehensive and free. To access health care, almost all residents are registered with a general practice. The study population was English general practices with LCoC data from the General Practice Patient Survey (GPPS) in 2018-2022. In every practice nationwide, GPPS questionnaires are administered annually to weighted patient samples, which resemble the practices’ population in terms of characteristics such as age, gender, ethnicity, and marital status. The NHS England website publishes these results annually, further weighted to account for response patterns.26
To focus on active general practices above a minimum size, we used the General Practice Practice Profiles database,35 which includes only active practices, that is, those with current-year data in the national pay-for-performance Quality and Outcomes Framework,36 and with at least 750 registered patients. We also excluded extreme outliers for the average NHS payments per patient (exceeding £500/ year). Many excluded practices were missing data for several activity-related variables. Supplemental Figure 1 gives the numbers of practices remaining at each stage of our analysis.
Dependent Variable
Our dependent variable (outcome) was the level of LCoC in a practice. To compare practices, we calculated an overall practice LCoC measure for each year by multiplying the weighted patient responses to 2 GPPS questions,5,25 using practice-level data from all active practices: (1) percentage of patients with a preferred GP (“yes” response to “Have a preferred GP to see or speak to”), and (2) percentage of patients able to see preferred GP (combined percentage of “always or almost always” and “a lot of the time” responses to “Frequency of seeing preferred GP” among those responding “yes” to the first question). The GPPS uses this combination to represent higher continuity in their reports.26,37
Independent Variables
Included independent variables (potential predictors of LCoC) had to meet several criteria: they had to be consistently defined available data; they had to be conceptually plausible, using a population health research framework38 (Supplemental Figure 2); and they had to show no strong correlation (correlation coefficient <0.4) with any other independent variables. We excluded variables that did not meet these criteria (Supplemental Table 2).20
We categorized the included variables as context, population characteristics, practice characteristics, or appointment uptake (influencing access). Where available, we included all 5 years of values for numeric variables. We additionally determined LCoC in 2018 as a baseline.
Context
Context variables describe the geographic area and socioeconomic setting of practices and their populations. We included 3 context variables. (1) The NHS Commissioning Region is responsible for the performance of all NHS organizations within their region.39 England has 7 of these regions (East of England, London, Midlands, North East and Yorkshire, North West, South East, and South West), and London was the reference. (2) The Index of Multiple Deprivation (IMD), last updated in 2019, is an area-based relative measure of socioeconomic status. Its formula combines indicators from 7 domains (income, employment, education, health, crime, barriers to housing and services, and living environment).40 Higher scores indicate greater deprivation. General Practitioner Practice Profiles publishes practices’ IMD scores, calculated by averaging IMD scores for each small area within the practice, weighted by its number of practice patients.35 (3) Practice location was included, whereby practices were designated as being in either a rural or an urban location based on their postal code.41,42
Population Characteristics
We included the self-reported percentages in the GPPS of patients in the White ethnicity group,26 as defined in the England and Wales 2021 census, in which 19 groups43 are condensed into 5 broad bands: Asian, Black, Mixed, White, and Other. Values less than 0.5% were not reported; we coded those values as 0%. All 5 bands were highly intercorrelated; however, only the White band was uncorrelated with other variables. Lower LCoC levels have been reported in some non-White ethnicity groups.44
We excluded the following variables, all percentages, because they correlated either with each other or with IMD: registered patients aged 75 years or older,31 GPPS respondents with a self-reported long-term health condition,26 practice list patients aged 17 years or older on a Quality and Outcomes Framework diabetes register,36 and GPPS respondents sick or permanently registered as disabled (as self-reported).26 We sought to include a specific measure of morbidity as an offset; however, our potential morbidity variables correlated highly with other variables.20 We therefore used IMD, which includes a health component, to reflect morbidity in our model.
Practice Characteristics
We included 5 practice characteristics in analyses. (1) List size was the number of patients registered with the practice in March of each year.31 (2) Type of NHS primary care contract (Supplemental Appendix, Supplemental Tables 1-9, and Supplemental Figures 1-10) consisted of 3 mutually exclusive categories: General Medical Services, Personal Medical Services, or Alternative Provider Medical Services contracts.42,45 A few practices changed contract type during the study period. We selected General Medical Services, the commonest, as the reference and the year 2020, as this was the middle study year and correlated best with other years. (3) Average NHS payments per unweighted registered patient were ascertained for each year.42 We excluded 2018, as the methodology changed in 2018-2019. (4) Numbers of full-time equivalent (37.5 hours/ week) GPs of all grades, including those in training, per 1,000 patients32 were included, as the GPPS continuity questions did not specify the type of GP patients preferred. We used every September in 2018-2022 when data definitions were stable. (5) Numbers of full-time equivalent nurses (all types) per 1,000 patients32 were also included as nurses can free up GP time and have important roles in anticipatory and planned care, and in the management of minor illness.
Appointment Uptake
We used a single uncorrelated variable as a measure of uptake of GP appointments: the percentage of GPPS respondents who reported having their appointment on the same day they booked it.26
Analyses
In data cleaning, we replaced implausible published percentage values (those outside 0% to 100%) with missing values.
We calculated descriptive statistics and performed univariate analyses. For each year’s LCoC, we calculated the coefficient of variation, the standard deviation divided by the mean. This statistic measures the relative variation within a variable’s distribution.
In multivariate analyses, we fitted a multilevel mixed-effects model: the random effects were practices and the fixed effects were the 11 potential predictors, all simultaneously introduced. The model included only eligible practices active in all 5 years. Our focus was the variables’ interactions with time. Positive coefficients represented slower declines in LCoC over time, whereas negative coefficients represented faster declines. Model performance was assessed for collinearity, homogeneity of variance, and normality of residuals, and we performed a posterior predictive check.
Our sensitivity analyses included comparing descriptive statistics of eligible practices with those of all practices to assess potential sampling bias, and generating cross-sectional robust regression models for each year (Supplemental Table 6). All analyses were performed in R version 2022.12.0+353 (R Foundation for Statistical Computing).
RESULTS
Study Cohort
Our model included 6,010 general practices, which comprised 83.6% of all 7,190 active general practices and 97.9% of all 6,139 eligible active general practices (Supplemental Figure 1). Descriptive statistics of the model’s continuous and categorical variables are summarized in Table 1 and Table 2, respectively.
Continuous Variables in the Model (N = 6,139 Eligible Practices)
Categorical Variables in the Model (N = 6,139 Eligible Practices)
Trends in Continuity Over Time
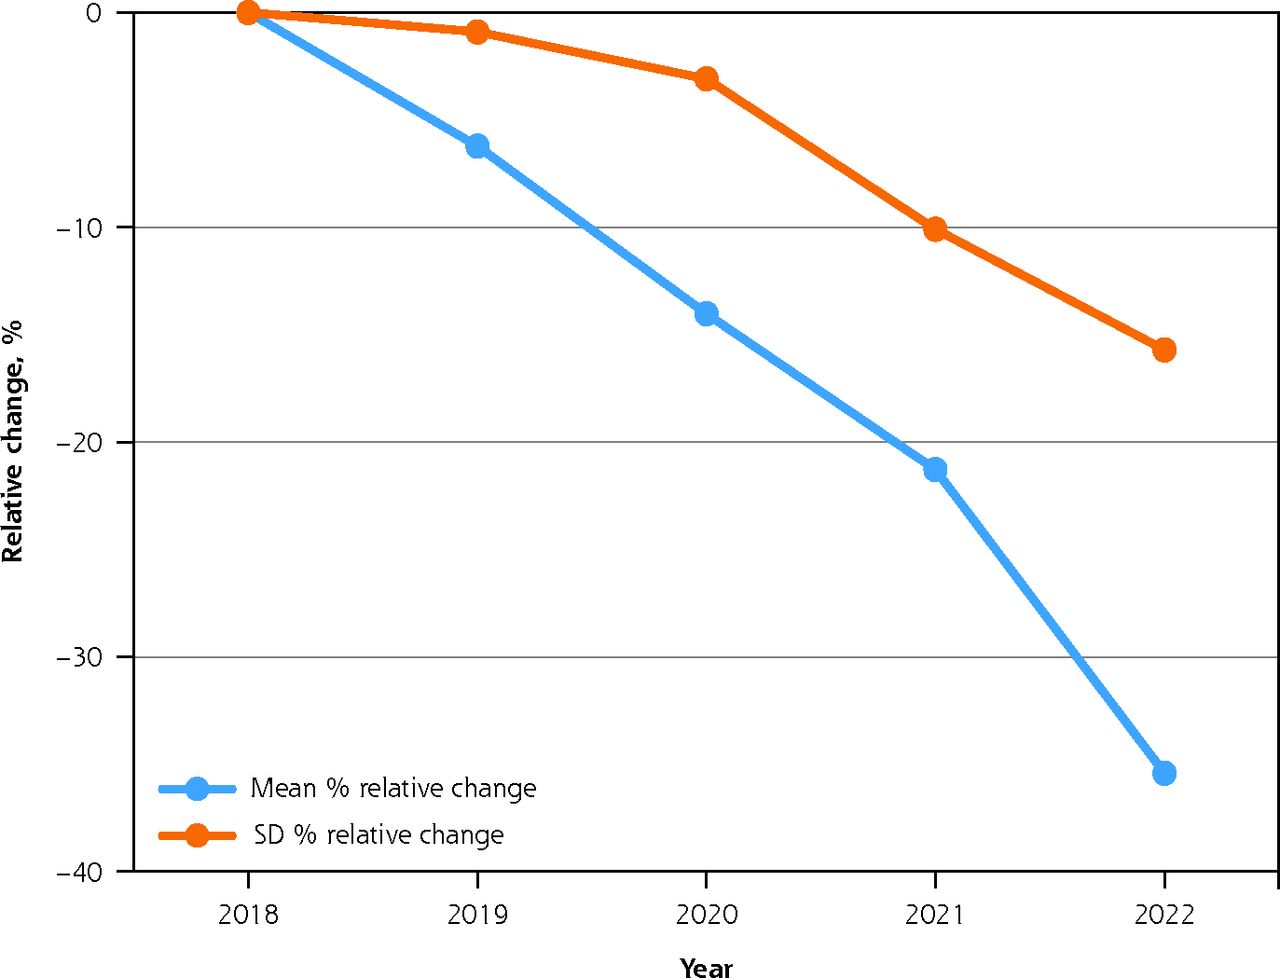
The percentage of practice patients reporting LCoC declined consistently and widely from 2018 to 2022 (Figure 1). The slope was steepest in 2021-2022, after the COVID lockdown.

Relative changes in English practices’ longitudinal continuity of care, 2018-2022.
GP = general practitioner; LCoC = longitudinal continuity of care.
Notes: Figure shows relative change in percentage of practice patients reporting LCoC. LCoC was calculated as 100 × (percentage of patients with preferred GP × percentage of patients able to see preferred GP).
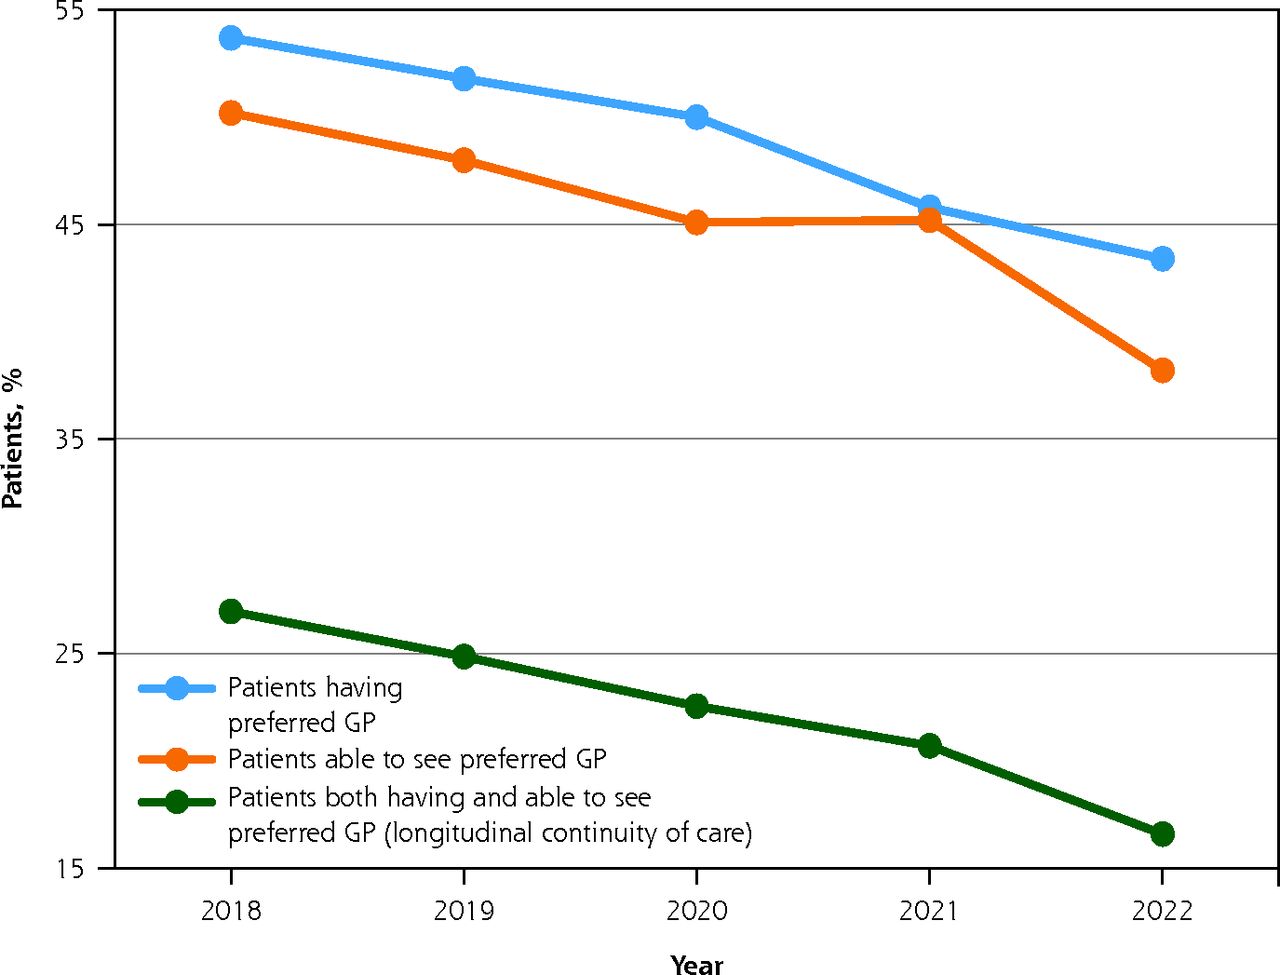
The pattern differed somewhat for the 2 component measures of continuity (Figure 2). At the national level, the percentage of patients able to see their preferred GP increased slightly in 2020-2021 (in contrast to a declining percentage with a preferred GP), before declining more steeply than the percentage with a preferred GP in 2021-2022.

Practice-level continuity of care measures as reported by patients on the GPPS, 2018-2022.
GP = general practitioner; GPPS = General Practice Patient Survey.
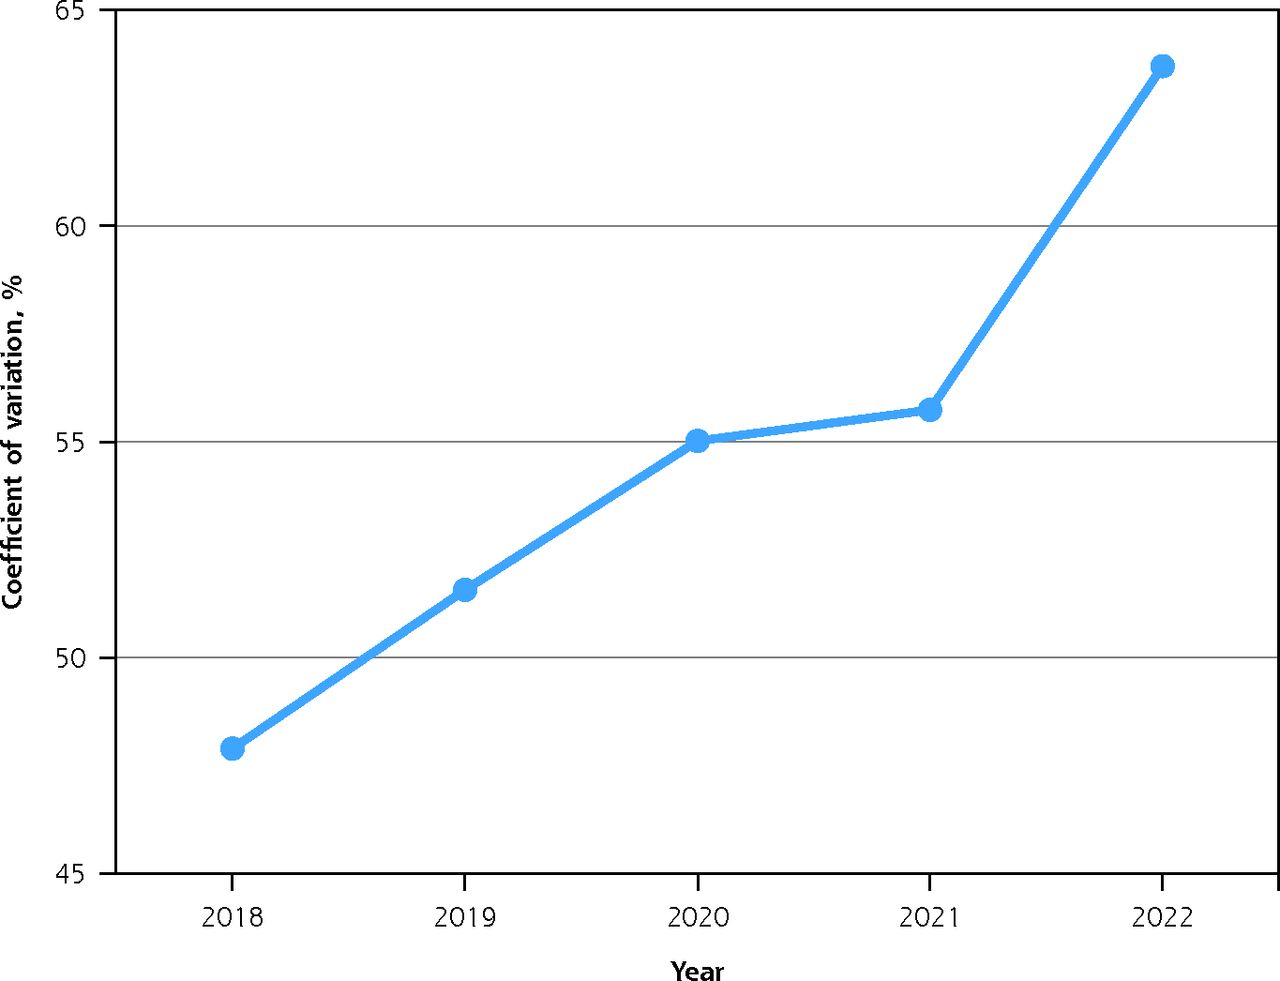
Although the mean LCoC decreased from 29.3% to 19.0% between 2018 and 2022, a relative decline of 35.3%, the standard deviation declined proportionally less, from 14.1% to 12.1%, a relative decline of “only” 14.4% (Table 1). The LCoC coefficient of variation across practices increased from 48.1% in 2018 to 63.6% in 2022, but it increased particularly steeply in 2021-2022 (Figure 3).

Variation across practices in longitudinal continuity of care, 2018-2022.
Note: Coefficient of variation is calculated as the SD divided by the mean. Exact values are 48.1% (2018), 51.0% (2019), 54.5% (2020), 55.4% (2021), and 63.6% (2022).
Data sources are summarized in Supplemental Table 3. Full descriptive statistics are summarized for practices with any data and for eligible practices in Supplemental Table 4 and Supplemental Table 5, respectively. The only normally distributed continuous variables were LCoC, percentage of White patients, and percentage of patients seen the same day. Across all variables, less than 3.2% of values were missing, with the exception of White patients in 2018-2021 (range = 6.3% to 12.8% missing).
Univariate Analyses
Univariate analyses identified several potential predictor variables that showed high correlation with others. Those excluded from subsequent analyses because of high correlation are shown for each study year in Supplemental Figure 3 through Supplemental Figure 7.
Multivariate Analyses
In multivariate analyses, practices having more GPs and a larger share of patients seen the same day had slower declines in LCoC over time (Table 3). Practices having higher baseline LCoC, situated in 4 of the 6 regions outside London, and having more White patients had faster declines. Deprivation, South West or North East region, location, list size, nurse numbers, contract type, and NHS payments were not predictors.
Predictors of Decline in Longitudinal Continuity of Care During 2018-2020
In the model, the estimated mean marginal effects of time on continuity were negative (model scale = −5,475 to −5,486 during 2018-2022) (Supplemental Table 8). The intraclass coefficient of 0.51 indicated strong clustering within practices. The conditional R2 value was 0.83. All models’ residuals were approximately normally distributed, and there was homogeneity of variance. The plots of the residuals vs the predicted values showed no pattern (Supplemental Figures 7-9). Taken together, these findings suggest our model was a suitable fit for the data. We did not identify any multicollinearity between the variables (Supplemental Table 9).
Sensitivity Analyses
The characteristics of eligible practices and of all practices with any data (Supplemental Table 4) were similar, except for list size and NHS payments, both of which were criteria for exclusion and not predictors in the model.
Some variables predicted differently in regression models assessing continuity at one point in time as opposed to a model assessing continuity over a period of time (Supplemental Table 6). Greater deprivation, larger list sizes, higher numbers of nurses, more patients seen the same day, and urban location all predicted lower LCoC. Higher payment and contract types other than Alternative Provider Medical Services predicted higher LCoC. Other variables were predictors in only some study years (eg, percentage of White patients in 2020, some regions) or in none of the study years (eg, GP numbers, some regions).
DISCUSSION
Summary of Findings
Levels of LCoC declined substantially in just 4 years across English general practices, in parallel with increasing relative variability. Both slopes were steepest immediately after the COVID-19 lockdown, but we do not know yet whether these trends will persist. Also, at the national level, the fact that the percentage of patients able to see their preferred GP increased slightly in 2020-2021 before declining faster than the percentage with a preferred GP in 2021-2022 may reflect a post-lockdown surge in demand.
Some practice population variables (4 of 6 non-London regions, larger share of White patients, and higher baseline LCoC) predicted faster declines, whereas 2 practice variables (more GPs and larger share of patients seen on the same day) predicted slower declines. The latter 2 predictors might influence GP appointment availability. Increased triage during the pandemic and substitution with other types of health care professionals, such as advanced nurse practitioners, may have contributed to these trends.
We cannot explain why deprivation, NHS payments, and nurses did not predict, or why London was an outlier, or why practices with more White patients had faster declines. Data on non-GP and non-nurse clinician types were incomplete. The payments variable measured overall levels of funding and not the payments’ allocation within practices. Also, very low levels of LCoC could possibly be masking the effects of independent variables.
Strengths and Limitations
Study strengths included our use of practice-level data, which allowed us to incorporate practice-related variables in our model. Some measures of LCoC, such as the Usual Provider of Care Index, the Herfindahl–Hirschman Index, and the Bice-Boxerman Index, are calculated from anonymized electronic health records. English studies often use the Clinical Practice Research Datalink.37 This resource captures one-quarter of the population and one-third of practices; our LCoC measure included all active English practices.
Multiplying responses to the 2 GPPS questions yields a broader measure of LCoC than the response to individual questions. Although records-based measures are considered objective, the most frequently seen physician is not always the preferred physician, and patients’ reports may better reflect the qualitative aspect of LCoC.
We included a high percentage of eligible practices and used a robust process to select variables, excluding highly correlated variables. Our multilevel model addressed clustering within practices. The R2 value (0.83) explained slightly more than four-fifths of the longitudinal variation observed and, when combined with the normally distributed residuals, indicated that our model was a suitable fit for the data.
Possible study limitations included unavailable data, bias due to excluded practices (although most did not fulfil the criteria of activity or minimum size), and low GPPS response rates. Characteristics of the eligible practices and all practices were similar, except for list size and payments (criteria for exclusion). We treated practice payments values cautiously, as some patients may be double counted, for example, because of practice closure or unknown patient list sizes in a few practices. Excluded practices were often missing substantial data, so their inclusion would have risked distorting the analyses.
Low response rates to the GPPS increase the risk of nonresponse bias (national average response rates in 2018-2022 were between 23.7% and 29.1%). The GPPS, however, has developed sophisticated weighting strategies to adjust for both practice population characteristics and response rates.26 Research has supported both the validity and reliability of the GPPS output,27,46-48 and previous studies have used GPPS data.20,25,27
Finally, our analysis was ecological, examining longitudinal associations between our variables but not causation.
Comparisons With Existing Literature
Multiple studies have documented a decline in LCoC over more than a decade.25-28 Previously, we used the same outcome measure, but slightly different practice exclusion criteria and sets of independent variables.25 In that study, ethnicity and list size, but not deprivation or region, predicted LCoC variations. The individual GPPS continuity questions have been used as outcomes. In one study, IMD quintile, location, and chronic conditions predicted longitudinal variations.27 Differences between LCoC studies are often due to different methodologies and to evolving practice structures and processes.
Our practice characteristic variables were conceptually relevant to practices’ capacity to provide continuity. The pandemic’s onset in early 2020 led to increased remote consulting and triage but reduced overall access. Despite substantial reversals, remote consulting and triage remain above prepandemic levels,30 possibly driving the continuing decline in LCoC.49
Implications for Practice and Research
The decline in LCoC has coincided with decreasing patient satisfaction in practice services,26 suggesting widening perceptions of a crisis in English primary care.50 However, changing predictors with small effect sizes in individual practices, if replicated nationally, could increase LCoC levels sufficiently to improve both physician productivity51 and population health outcomes.
Further research might examine detailed practice-level appointments data published since October 202230 to investigate possible associations between LCoC, appointment uptake, health workforce type, and the pandemic’s subsequent effects. Further qualitative, mixed methods, and/or real-world research is needed, however, to better understand these associations, and to ascertain the effects of increased use of triage and non-GP clinicians. Physician-patient relationships remain at the core of clinical practice, but need updating and improving as health needs and health care systems change.52
Is there a vicious cycle whereby continuity’s progressive decline discourages patients from expecting and then seeking a continuous relationship with their GP? We would argue that better levels of continuity are achievable for those who wish it by prioritizing continuity and by improving appointment availability (levels and distribution) within flexible systems where triage is not used to limit patient choice. This is time-critical: without appropriate decisive action now, LCoC could effectively disappear in England, leading to future adverse effects across a range of health-related outcomes.
Footnotes
Conflicts of interest: authors report none.
Author contributions: L.L. conceived the research. L.L. and R.B. collated data. All authors were involved in developing the analysis plan. L.L. undertook data analysis. C.N. provided methodologic advice. All authors were involved in interpretation of the findings. L.L. produced the first draft. All authors were involved in subsequent revisions.
Disclaimer: The views expressed are solely those of the authors and do not necessarily represent official views of UK government agencies, the NHS, or the authors’ affiliated institutions.
Previous presentation: We gave a short in-person presentation of this study’s preliminary results, accompanied by an e-poster, on October 19, 2023, at the Royal College of General Practitioners (RCGP) Annual Conference, Scottish Event Campus, Glasgow, United Kingdom.
- Received for publication September 11, 2023.
- Revision received March 21, 2024.
- Accepted for publication April 8, 2024.
- © 2024 Annals of Family Medicine, Inc.


