
Abstract
PURPOSE We wanted to examine the relationships between quality of diabetes care delivered, the type and length of encounter, and time to the next follow-up encounter.
METHODS The content of the physician-patient encounter was directly observed in 20 primary care clinics for 211 patients with type 2 diabetes mellitus. The quality of diabetes care was measured as the percentage of the 5 following services delivered during the encounter if they had not been offered in the previous year: foot examination, referral for an eye examination, a glycosylated hemoglobin (HbA1c) measurement, a lipid panel, and a urine microalbumin test.
RESULTS All indicated services were performed in 33% of encounters. Compared with encounters for an acute illness, patients visiting for chronic disease follow-up were 4.8 (95% CI, 1.95%–12.01%) times more likely to receive 100% of all indicated services. Length of encounter was associated with percentage of services delivered, but only during chronic disease follow-up encounters (P = .02). Encounters during which 100% of all indicated services were delivered had a mean length of 19.4 minutes. The time to the next scheduled encounter was shorter if fewer services were delivered during the observed encounter (P = .009).
CONCLUSIONS Competing demands during primary care encounters require patient and physician to prioritize services delivered and defer indicated services to subsequent visits. Current models of patient care in primary care settings are inadequate to address the multitude of tasks facing clinicians, especially among patients with complex chronic illnesses. Innovative approaches and new models are needed to improve the quality of diabetes care.
INTRODUCTION
More than 80% of patients with type 2 diabetes mellitus in the United States are cared for by clinicians in primary care specialties, and 76% of all outpatient encounters by adults with diabetes are with primary care clinicians.1,2 Studies continue to document gaps in the quality of diabetes care in the primary care setting.3,4 A recent study of the quality of diabetes care in managed care systems in the United States found that during the preceding 12 months, only 28% of patients had a documented dilated eye examination, 50% had a documented annual foot examination, and 81% had a screening urine test for nephropathy.5 A study conducted in community health centers in the United States found that in the preceding year, 80% of patients had at least 1 glycosylated hemoglobin (HbA1c) measurement, 36% had a referral for an eye examination, 55% had a lipid panel assessment, and 40% either had a foot examination or a referral to a podiatrist.6
Previous studies of primary care settings have shown that multiple complex demands during the average physician-patient encounter force most clinicians to prioritize those demands and deal only with the most pressing or symptomatic problem.7–9 As a result, less urgent demands or asymptomatic problems, such as disease-specific preventive services, are often not addressed and are deferred to subsequent encounters. Competing demands have been found with initiation and completion of depression care during the course of 6 months,10 mammography screening in primary care settings,11 tobacco cessation counseling efforts in family physician offices,9 and treatment of unrelated medical disorders in patients with a chronic illness.12
Given that competing demands exist during most primary care encounters, the purpose of this study was to test the following hypotheses:
-
During encounters for an acute illness, the quality of diabetes care will be lower than diabetes care during routine chronic illness follow-up encounters.
-
The quality of diabetes care will increase as the duration of the encounter increases.
-
The time to the next scheduled follow-up encounter will decrease as the quality of diabetes care during the observed encounter decreases.
METHODS
The Direct Observation of Diabetes Care study was begun in 2002 with the primary aim of conducting an in-depth examination of the quality of care delivered to patients with type 2 diabetes mellitus across a wide variety of primary care settings. The study design was cross-sectional and included direct observation of physician-patient encounters: no interventions were performed, and patients received their usual care from their primary care physician. Twenty primary care clinics were recruited from across south Texas in a snowball method with an attempt to identify and recruit primary care settings where patients with type 2 diabetes are mostly likely to seek care: solo practice physicians, group practice settings, community health centers, and city-county health clinics for uninsured patients.
Participants and Data Collection
A trained observer spent 2 to 4 weeks in each practice. Within each clinic, consecutive patients with an established diagnosis of type 2 diabetes were recruited to participate in the study. The trained observer accompanied a minimum of 10 patients in each clinic to the examination room and directly observed the encounter. The observer used a checklist of services performed during the encounter to record the reason for the encounter; the number of topics, symptoms, or questions brought up by either the patient or the physician; the duration of the encounter; the number of prescriptions refilled; the number of diabetes-specific services accomplished; discussions of diet; the number of physical examination items done; and the number of days to the next follow-up visit. After each encounter, patients completed a questionnaire, and their medical records were abstracted by the trained observer. This study was reviewed and approved by the Institutional Review Board at the University of Texas Health Science Center, San Antonio, Tex.
Definition of Variables
Reason for encounter was divided into 2 categories: an encounter for an acute illness, or an encounter for follow-up of a chronic disease. The trained observer listened closely during the first few minutes of the visit to how the physician and patient identified issues or problems that would be addressed during the visit. The observer defined a visit as acute if the primary issue or problem to be addressed was a symptom or new problem. By symptom, we mean any type of physical or emotional distress. For example, in one encounter the patient stated that the visit was for knee pain, which was a new complaint. In another encounter the patient told the physician the visit was because of allergies. Chronic disease follow-up visits were determined by how the physician and patient framed the visit during the first few minutes, ie, whether they centered their discussion around a chronic disease. It was possible that later during this type of visit, the patient brought up a physical or emotional symptom or complaint, but it was not the primary organizing focus of the visit.
Quality of care for the observed encounter was measured first by determining through chart review whether 1 of 5 American Diabetes Association recommended services had been performed in the past year: comprehensive foot examination, referral for an eye examination, a glycosylated hemoglobin (HbA1c) measurement, a fasting lipid profile, or a screening urine microalbumin test. If not performed, they were considered to be indicated during the observed visit. A diabetes quality-of-care checklist was completed by the observer after the encounter to record whether any of these services had been performed during the visit. The percentage of these indicated services that were performed during the encounter was then computed as a measure of the quality of care delivered during the encounter. We also divided encounters into 2 types: those in which 100% (all) of the indicated diabetes services were performed, and those in which less than 100% of the indicated diabetes services were performed. Demographic data on each patient was obtained from the patient’s completed questionnaire.
Analysis
Using descriptive statistics, we examined the central tendency of the observed variables. We used a χ2 test for categorical data and calculated odds ratios when appropriate. For continuous data, we calculated a Spearman rank order correlation coefficient if the data were not normally distributed. A robust regression model used percentage of indicated services delivered as the dependent variable to determine the independent contributions of those variables found to be associated with quality of care in the univariate analyses. We used a 1-way analysis of variance (ANOVA) to describe the relationship between categories of percentage of services delivered and the number of days to the next scheduled appointment.
RESULTS
A total of 23 clinics were invited to participate. Two did not qualify because they referred patients with type 2 diabetes to a specialist for care, and 1 declined to participate. Of the 20 practices/clinics that participated in the study, 12 were solo or 2-physician practices, 2 were single-specialty practices with 3 or more physicians, 3 were city-county health clinics, 1 was a federally qualified community health center, and 2 were out-patient clinics in a local Veterans Affairs health system.
Of the patients recruited to participate, only 3 declined. A total of 211 encounters were directly observed in 20 different clinics. Characteristics of the patient sample are found in Table 1⇓. Most patients were Hispanic, and their mean age was 59.1 years. In addition to diabetes, patients had a mean of 4.8 chronic disease diagnoses documented in their medical record and were taking an average of 6.4 medications. For 23% of encounters, the reason for the encounter was an acute illness; 77% of encounters were for follow-up of chronic diseases. Of those visiting for follow-up of a chronic illness, 72% also mentioned a symptom or complaint during the encounter.
Characteristics of Observed Participants
Details about the content of the encounter are displayed in Table 2⇓. A family member or significant other was present during approximately one third of the encounters. Of note are the findings that approximately 1 minute was devoted to each topic discussed and that diet was discussed in 70% of visits. Of 11 possible physical examination items, a mean of 4.8 (SD 2.8) were performed per encounter. A referral to another clinician was made in approximately one third of encounters. Of those referrals, 20.9% were to podiatrists and 37.3% were to an eye specialist (optometrist or ophthalmologist). A follow-up encounter was scheduled after 92% of observed encounters, and the mean length of time to the next scheduled encounter was 63.0 (SD 43.3) days.
Content of Encounters
The number and percentage of indicated diabetes-specific services performed during the encounter are shown in Table 3⇓. Because of the definition of “indicated,” as described above, the numbers vary for each service. The most frequently performed diabetes-specific service was ordering an HbA1c measurement. The least frequently performed service was referral for an eye examination. Across all encounters the mean percentage of the 5 diabetes-related services that were performed, if indicated, was 73.1% (SD 24.9%), and the median was 80.0%. We also divided encounters into 2 categories based on indicated services: those in which 100% (all) of the indicated services were delivered, and those in which less than 100% of all indicated services were delivered. In 33.2% of encounters, 100% (all) of the services that were indicated were performed.
Delivery of Indicated Services (N = 211 Encounters)
None of the patient characteristics – age, race/ethnicity, sex, number of diagnoses, or number of chronic medications – were associated with percentage of indicated services delivered. Patients visiting for follow-up of a chronic disease were 4.8 times more likely to receive all (100%) of the services that were indicated (95% CI, 1.95–12.01) than those visiting for an acute problem. A higher percentage of indicated services were completed during a chronic illness follow-up visit, 80.0%, than during an acute illness encounter, 60.3% (P <.001). Of the indicated services delivered across all observed visits, however, 23.7% were delivered during an acute visit.
In addition to type of encounter, length of encounter was associated with percentage of indicated services delivered, but only during encounters for chronic disease follow-up (Spearman r = 0.18, P = .02) but not for acute illness encounters (Spearman r = 0.07, P = .62). As the duration of encounter increased for chronic illness follow-up visits, so did the percentage of indicated services delivered. Chronic illness follow-up encounters in which all indicated services were delivered averaged 19.3 minutes, compared with 13.0 minutes for encounters during which less than 50% of indicated services were delivered. In a robust regression model, however, both length of visit (P <.001) and type of visit (P = .03) were significant predictors of the percentage of indicated services delivered (model F = 11.78, R2 = 0.10)
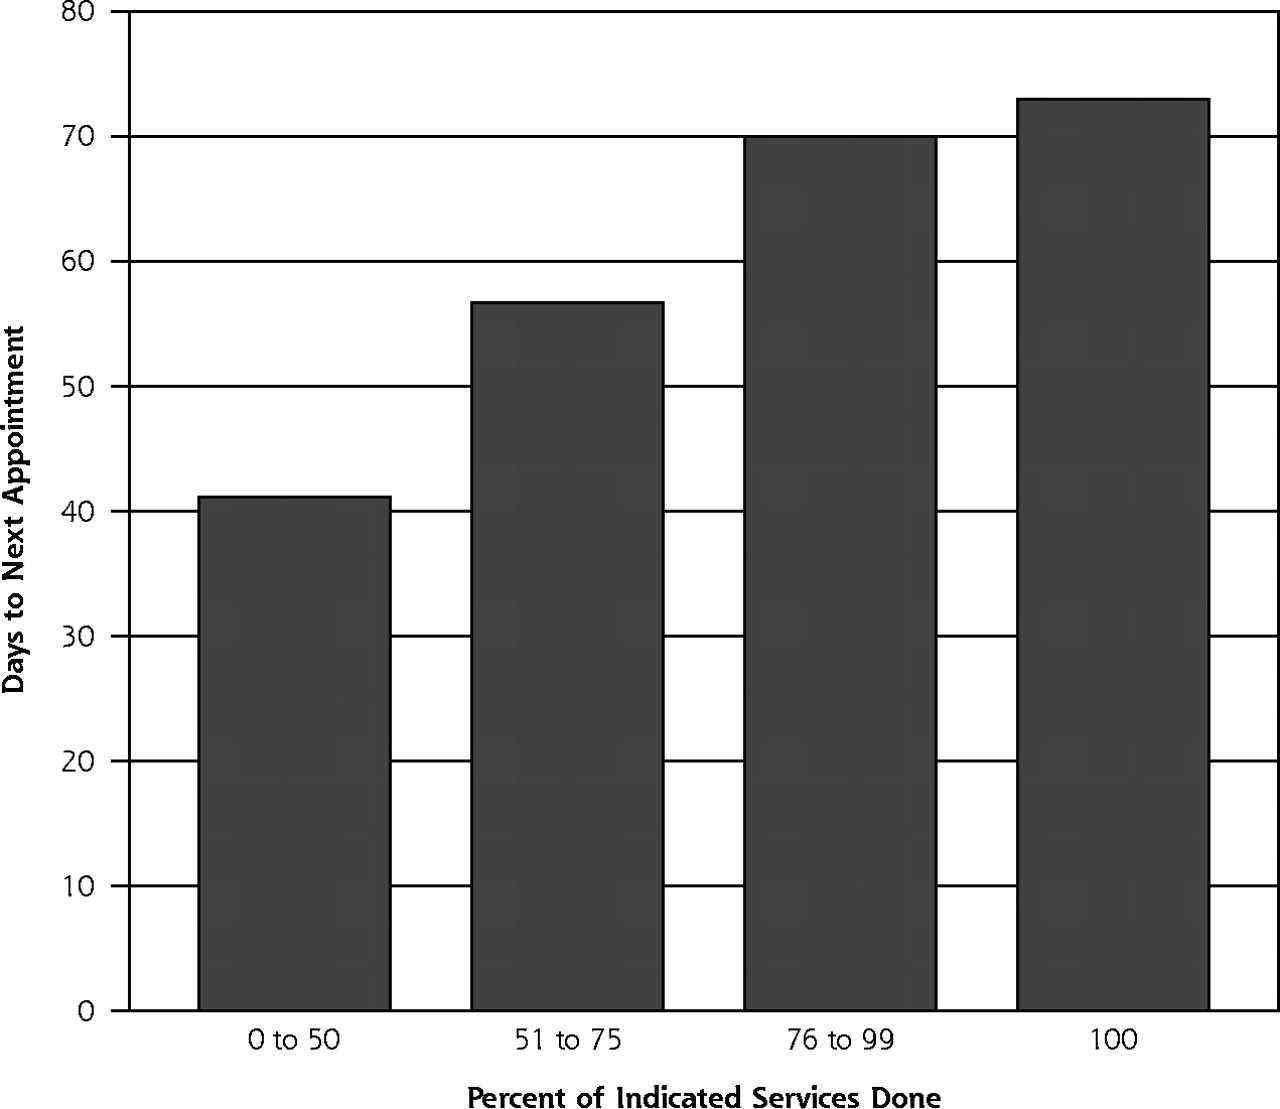
A follow-up visit was scheduled after 92% of the observed encounters. The mean interval between the observed visit and the scheduled follow-up visit was 63.0 days (SD 43.3 days). The number of days to the next scheduled encounter was positively associated with the percentage of indicated services delivered (Figure 1⇓, F = 3.94, P = .009); that is, as the percentage of indicated services delivered decreased, so did the time between scheduled appointments.

Time to next appointment and indicated services delivered.
DISCUSSION
Primary care physician encounters with patients who have type 2 diabetes are complex and demanding, and the competing demands during these visits may be a major barrier to delivering indicated diabetes services. This conclusion is supported by the following findings: (1) indicated diabetes services were less likely to occur during encounters for acute illness; (2) the percentage of indicated services delivered increased as the duration of visit increased; and (3) follow-up visits were scheduled sooner if fewer of the indicated services were delivered.
When the reason for the encounter was follow-up of a chronic disease rather than for an acute illness, patients were much more likely to receive indicated diabetes services, such as a foot examination, referral for an eye examination, or an order for an HbA1c measurement. Some have found that during acute visits, more pressing or symptomatic concerns may take precedence over the delivery of routine diabetes care services.9,10 What is surprising is that an average of 60% of indicated diabetes services were performed during encounters for an acute illness; in fact, across all encounters, 23% of indicated services were performed during encounters for an acute illness. This finding may be analogous to the observed “opportunistic” delivery of preventive services, such as tobacco cessation counseling observed during encounters for an acute illness in other primary care settings.7
For chronic illness follow-up visits, as the length of the encounter increased, so did the percentage of indicated diabetes services delivered. Encounters with 100% of all indicated services delivered averaged approximately 20 minutes; however, the average length of encounters was 17.5 minutes. These findings may explain why almost one half of physicians in the United States reported that “not having enough time with patients is a major problem,”13 and why older patients report declines in the quality of their interaction with their primary care physician.14 In a compelling illustration of the problem, investigators in a recent study estimated that 10.6 hours a day would be necessary for a primary care physician to provide guideline-concordant care for the 10 most common chronic diseases in a panel of 2,500 primary care patients with an age-sex distribution and chronic disease prevalence similar to that of the general population (if the chronic diseases were not well controlled), leaving little time for acute problems or social interaction.15
The time to the next scheduled encounter decreased as the percentage of indicated services delivered decreased during the observed encounter. This finding suggests that physicians might be aware that they did not perform all the indicated services and want patient to return sooner to complete them. It might be that physicians must defer indicated services so they can deal with other more pressing concerns related to diabetes care or to the other 4.8 chronic illnesses that, on average, are found in this patient population. Deferral of services to the next visit may also increase the importance of continuity of physician care to ensure completion of all indicated services.
One limitation of this study is the possibility that having an observer present during the patient encounter resulted in a Hawthorne effect, in that the study was biased toward overestimating the quality of diabetes care provided. Our method of direct observation, however, was replicated from a landmark study of 4,454 encounters of 138 primary care physicians,16 during which the investigators found that after only 2 or 3 observed encounters, physician behavior was unaltered by having an observer in the examination room with the patient.17
Direct observation of encounters might also be considered a strength of the study. Most studies of patients with diabetes in primary care settings are conducted using secondary administrative data or medical chart reviews. With these studies, however, some have found a discrepancy between administrative data or what is documented in the chart and what actually occurs during the patient encounter.18–20
It is also worth noting that our definition of quality of care is unique. In most quality-measurement studies, the outcomes are measured as services that are completed, eg, HbA1c results, rather than those that are ordered or recommended by the physician. The former approach is often taken because the most easily available data are administrative billing or claims data. Our approach was to document physician action rather than services actually completed. This method removes the possibility that the physician may have ordered the test, but the patient never had the service performed. In other words, the patient may have been handed a request for an HbA1c level measurement but failed to go to the laboratory to have the test performed. Our approach is a more direct measure of behavior of physicians regarding quality of care for type 2 diabetes.
It is possible that competing demands during primary care encounters with patients who have type 2 diabetes may partially explain the previously documented gap found between generalists and specialists in quality of care provided.21,22 A specialist who is only responsible for managing diabetes may have the luxury of focusing all the encounter time solely on managing diabetes and defer other patient questions or complaints to other physicians. One option for a “new model” of care by family physicians is the use of disease-specific group clinics for patients with diabetes. These clinics explicitly focus on providing diabetes-specific services and intensifying therapy, as appropriate, for blood glucose, blood pressure, or lipid control, each a risk factor for complications from type 2 diabetes. Other problems or issues are deferred to future visits. In one study, HbA1c levels were associated with the number of group clinic sessions attended.23 In a separate study, HbA1c levels declined in patients randomized to a group clinic compared with control patients.24
In summary, the quality of diabetes care delivered in primary care settings is better in chronic encounters than in acute encounters, improves as the duration of visit increases, and is associated with the number of days to the next scheduled visit. Interventions to improve the quality of diabetes care in primary care settings may need to target changes within the practice setting. As suggested by the Future of Family Medicine report, the brief-visit model of ambulatory care is no longer consistent with the tasks facing the family physician.25 New models of care, such as group visits, coupled with information technology that allows for population management of groups of patients with multiple complex chronic illnesses, are needed. Facilitating change within primary care practices is no small task, however. Innovative and novel approaches may be required to implement sustainable new systems of care to improve the quality of type 2 diabetes in the primary care setting.26–28
Footnotes
-
Conflicts of interest: none reported
-
Funding support: This study received support from the Agency for Healthcare Research and Quality (Grant #K08 HS013008-02); the South Texas Health Research Center; and the Office of Research and Development, Health Services Research and Development Service, Department of Veterans Affairs.
-
Disclaimer: The views expressed in this article are those of the authors and do not necessarily represent the views of the Department of Veterans Affairs.
- Received for publication July 16, 2005.
- Revision received October 3, 2005.
- Accepted for publication October 24, 2005.
- © 2006 Annals of Family Medicine, Inc.
REFERENCES


Jump to section
Related Articles
Cited By...
- Development of a tool for assessing quality of comprehensive care provided by community health workers in a community-based care programme in South Africa
- Patient-Defined Visit Priorities in Primary Care: Psychosocial Versus Medically-Related Concerns
- Implementation of self management support for long term conditions in routine primary care settings: cluster randomised controlled trial
- Shared Medical Appointments in Diabetes Care: A Literature Review
- A Logic Model Framework for Evaluation and Planning in a Primary Care Practice-based Research Network (PBRN)
- The Chronic Care Model and Exercise Discussions during Primary Care Diabetes Encounters
- Participatory Decision Making, Patient Activation, Medication Adherence, and Intermediate Clinical Outcomes in Type 2 Diabetes: A STARNet Study
- Cardiovascular disease in type 2 diabetes: Attributable risk due to modifiable risk factors
- Primary Care Provider Views of the Current Referral-to-Eye-Care Process: Focus Group Results
- An Assessment of Attitudes, Behaviors, and Outcomes of Patients with Type 2 Diabetes
- The Gordian Knot of Chronic Illness Care
- Glucose Control, Self-Care Behaviors, and the Presence of the Chronic Care Model in Primary Care Clinics
- Competing Demands or Clinical Inertia: The Case of Elevated Glycosylated Hemoglobin
- Advancing Evidence-Based Care For Diabetes: Lessons From The Veterans Health Administration
- In This Issue: Diabetes Quality of Care