
Abstract
PURPOSE We wanted to evaluate the feasibility of conducting syndromic surveillance in a primary care office using billing data.
METHODS A 1-year study was conducted in a primary care practice; comparison data were obtained from emergency department records of visits by county residents. Within the practice, a computer program converted billing data into de-identified daily summaries of International Classification of Diseases, Ninth Revision (ICD-9) codes by sex and age-group; and a staff member generated daily summaries and e-mailed them to the analysis team. For both the practice and the emergency departments, infection-related syndromes and practice-specific thresholds were calculated using the category 1 syndrome codes and an analyitical method based upon the Early Aberration Reporting System of the Centers for Disease Control and Prevention.
RESULTS A mean of 253 ICD-9 codes per day was reported. The most frequently recorded syndromes were respiratory illness, gastrointestinal illness, and fever. Syndromes most commonly exceeding the threshold of 2 standard deviations for the practice were lymphadenitis, rash, and fever. Generating a daily summary took 1 to 2 minutes; the program was written by the software vendor for a fee of $1,500. During the 2003–2004 influenza season, trend line patterns of the emergency department visits reflected a pattern consistent with that of the state, whereas the trend line in primary case practice cases was less consistent, reflecting the variation expected in data from a single clinic. Still, spikes of activity that occurred in the practice before the emergency department suggest the practice may have seen patients with influenza earlier.
CONCLUSIONS This preliminary study showed the feasibility of implementing syndromic surveillance in an office setting at a low cost and with minimal staff effort. Although many implementation issues remain, further development of syndromic surveillance systems should include primary care offices.
- Communicable disease control
- bioterrorism/surveillance
- disease/surveillance
- primary health care
- methodological study
INTRODUCTION
Syndromic surveillance has been proposed as a method for early and enhanced detection of emerging infections, including intentionally released bioterrorist agents. Syndromic surveillance is defined as the “ongoing, systematic collection, analysis, interpretation and application of real-time indicators for disease outbreaks that allow for their detection before public health authorities would otherwise note them.”1 Although syndromic surveillance has been tested in acute care settings, little research has been conducted on its application in primary care.
Indicators for disease outbreaks can include absenteeism data, pharmacy records, poison center calls, chief complaints, and diagnostic codes. In North Carolina, the State Health Department mandates the reporting of chief complaints and International Classification of Disease, Ninth Edition (ICD-9), diagnosis codes from all hospital emergency departments as a means of performing syndromic surveillance. Although free text is available on a daily basis from emergency departments, the final diagnostic codes are often not available for several weeks.
Primary care practices may be able to provide more timely surveillance than emergency departments because patients with developing illness often come first to a primary care office with their initial symptoms. Furthermore, primary care practices generally assign diagnostic codes at the time of the visit, and electronic versions of diagnostic codes are created daily. As a result, it is potentially feasible to develop a surveillance system that evaluates primary care visits on a daily basis.
The concept of syndromic surveillance in primary care is not new. The Centers for Disease Control and Prevention (CDC) conducts national surveillance for influenza-like activity in sentinel physicians’ offices each year.2 In that system, participating physicians screen patients based on a simple case definition (fever with cough or sore throat) and report weekly the number of cases, visits by age-group and patient sex, and total visits observed. The surveillance is useful for monitoring influenza epidemics but, if applied to multiple diseases or syndromes, would require considerable effort from each practice; so the time demands of adapting that model to screen for all infectious syndromes would be prohibitive. Automated transfer of ICD-9 discharge diagnostic codes from primary care practices to a central processing system could provide a simple and rapid method of case identification and data reporting. Such a mechanism would link primary care practices into a near–real-time surveillance system for multiple syndromes with minimal effort.
To determine the feasibility of such a method at the practice level, we implemented a program of automated transfer of ICD-9 diagnostic codes in 1 rural family medicine office. In this article, we describe the implementation of that pilot program, present the results generated over 1 year, and discuss the possible public health implications for the broader use of such a system.
METHODS
This study was conducted jointly by Dayspring Family Medicine and the University of North Carolina at Chapel Hill (UNC-CH), with the approval of the Institutional Review Board of the University of North Carolina School of Medicine. Dayspring Family Medicine is a private family medicine office in Eden, NC, a small town approximately 40 miles northeast of Greensboro. The practice consists of 4 physicians, 2 physician’s assistants, 6 nurses, 1 phlebotomist, and 24 administrative staff. The practice does not use an electronic medical record but does perform electronic coding of encounter data for billing purposes. Clinicians record ICD-9 codes after each visit, and these data are entered daily into the practice’s billing system. The billing system uses proprietary software developed and maintained by a vendor in Virginia.
To conduct syndromic surveillance using the practice’s billing data, we contacted the management company responsible for the billing system, and one of their staff wrote a computer program that converted the encounter data to de-identified daily summaries. Each daily summary consisted of a row for each ICD-9 code registered, and columns of counts by ICD-9 code, sex, and age-group (0–5, 6–19, 20–44, 45–64, 65+ years). Daily summaries were generated by a practice staff member and sent by e-mail to UNC-CH. Generating a daily summary took 1 to 2 minutes; the program was written by the software vendor for a fee of $1,500.
The study used the codes for category 1 infection-related syndromes, developed by the CDC.3 The CDC system includes 10 syndromes: botulism-like, hemorrhagic illness, lymphadenitis, localized cutaneous lesion, gastrointestinal, respiratory, neurological, rash, fever, and severe illness or death potentially caused by infectious disease. Each of these syndromes is defined by a group of ICD-9 codes; together they represent potential clinical signs and symptoms of category A bioterrorist agents, ie, infections that can be easily disseminated or transmitted person-to-person, cause high mortality, and are likely to cause public panic and social disruption.4 The CDC identified 3 categories of ICD-9 codes: category 1 includes general symptoms and diagnoses most highly approximating the target infectious diseases; category 2 expands the group to include less-specific codes; and category 3 consists only of specific diagnoses that fit into the syndrome category.3 For these analyses, we used category 1 codes, which were believed to provide the most appropriate combination of simplicity and sensitivity for the primary care setting. Table 1⇓ lists the syndromes and the ICD-9 codes used to define each syndrome.
CDC Syndrome Codes and Definitions
One year’s data (July 1, 2003 to June 30, 2004) were received, entered, and analyzed. We converted daily de-identified files into a SAS dataset, with the date of encounter included as a variable. The composite file contained 20,649 records, with each record representing entries for 1 ICD-9 code on 1 day. Using this file, category 1 syndrome codes were identified, and a new dataset was created summarizing the total number of codes for a given syndrome per day. For comparison purposes, we obtained emergency department visit data for the same period for a large public hospital and from sentinel hospital emergency department visits made by the residents of Rockingham County and the 5 surrounding counties, using data routinely collected and sent to a state data repository, the North Carolina Emergency Department Database. Data elements collected included date, time, ICD-9 code, chief complaint, and county of residence.
Once data were compiled into daily frequencies of syndromes, we graphed them using Microsoft Excel 2000 (Version 9.0) for trending analysis. Next, we conducted statistical analyses using SAS/STAT software, Version 8.01 of the SAS System for Windows5 and Microsoft Excel 2000 (Version 9.0). Thresholds for syndromes were determined by applying a formula based upon the Early Aberration Reporting System (EARS), nonhistorical version, a software package developed by the CDC.6 The EARS system defines a unique daily threshold for the number of patients seen with each syndrome, above which is considered a significant aberration or “signal”; thresholds are calculated based on the average daily syndrome count for a week starting 10 days before the date of interest. Using this method, we computed thresholds for both 2 and 3 standard deviations above the previous week’s average. Percentages were expressed in terms of the total number of codes assigned each day. Analyses were performed on weekday data only; weekend ICD-9 distribution patterns were sufficiently different from weekdays to not conform to a weekday-based prediction model.
RESULTS
Daily Frequency of CDC Syndromes in a Family Medicine Office
Table 2⇓ displays the mean, standard deviation, and range of weekday visit codes by syndrome type in Dayspring Family Medicine. The mean number of total codes recorded per day was 253, with a standard deviation of 59 and a range of 56 to 394. Among individual syndromes, respiratory illness was recorded most frequently, with a mean of 27 codes per day, followed by gastrointestinal illness (4 codes per day) and fever (2 codes per day). All other syndrome codes were recorded less than once per day.
Daily Frequency of Syndrome Codes in 1 Family Medicine Practice for 1 Calendar Year (n = 239 days)*
Frequency and Distribution of Signals
Table 3⇓ displays the percentage of days in 1 year with significant aberrations (signals), by threshold level in Dayspring Family Medicine, with comparison data from emergency department visits made to UNC hospitals. Threshold levels of 2 and 3 standard deviations are displayed.
Frequency and Distribution of Significant Aberrations (Signals) by Threshold Level and Site
For Dayspring Family Medicine, syndromes that accounted for the highest percentage of days exceeding the 2 standard deviation threshold were lymphadenitis, rash, and fever, all occurring on 11% of days. Syndromes exceeding the same sensitivity threshold level for the emergency department were hemorrhagic illness (13%), botulism-like (13%), neurological (12%), and rash (11%) syndromes. When the threshold for 3 standard deviations was applied to Dayspring Family Medicine data, the syndromes occurring most often above the threshold were rash (7%), lymphadenitis (6%), and fever (6%). In comparison, syndromes making up the most signals for the emergency department data were hemorrhagic illness, cutaneous lesion, neurological, and botulism-like (6% each). Syndromes comprising the fewest signals in the clinic data for either sensitivity level were botulism-like, severe illness/death, and hemorrhagic illness; the fewest signals generated by the emergency department data for varied depending on the threshold.
Timing of Above-Threshold Signals During Influenza Epidemic
The occurrence of influenza in the region during the data collection period provided the opportunity to compare ICD-9 surveillance curves between Dayspring Family Medicine and sentinel emergency departments. Comparison data for the mid-November to mid-January influenza peak season are displayed as Figure 1⇓. Threshold limits were exceeded 3 times at Dayspring Family Medicine and 8 times in the emergency departments. Trend line patterns of the emergency department visits reflect a pattern consistent with that of the 2003–2004 NC influenza season,7 whereas the trend line in primary care practice cases is less consistent and reflects the variations expected in data from a single clinic. The occurrence of spikes in the practice before those of the emergency department suggests that perhaps the practice did indeed see patients with influenza earlier.
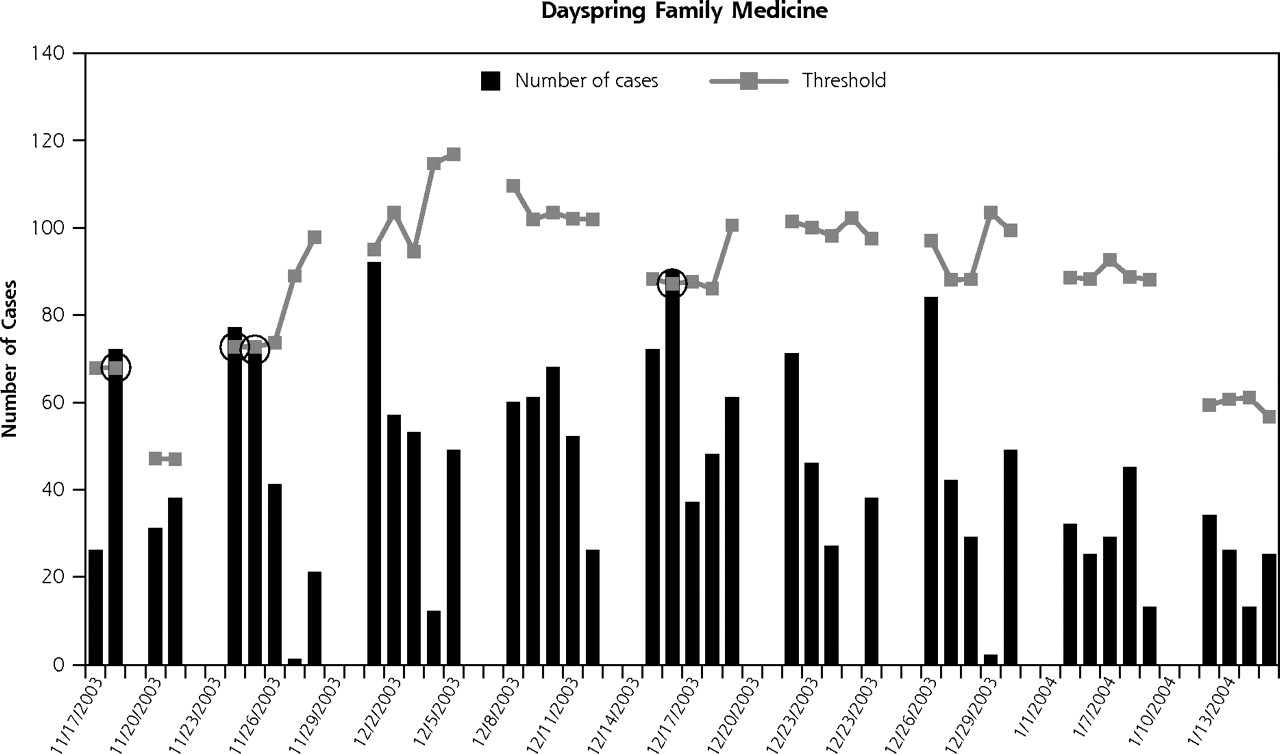
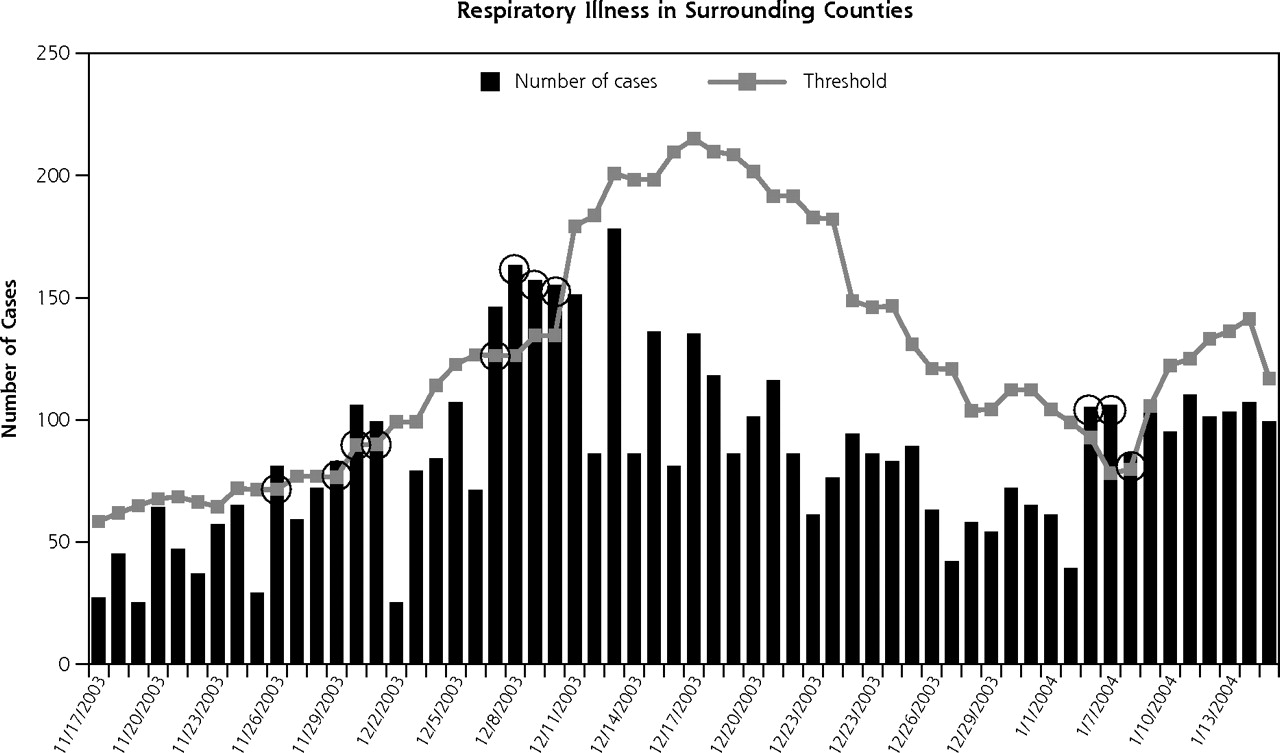
Daily number of respiratory syndrome codes reported by Dayspring Family Medicine and by emergency departments in the 6 surrounding counties, 15 November 2003 through 15 January 2004.
Note: Circles represent days when the surveillance threshold of 2 SD was exceeded.
DISCUSSION
Surveillance is critical to the detection and monitoring of diseases and conditions. This preliminary study shows the feasibility of implementing syndromic surveillance in an office setting at a low cost and with virtually no staff effort. The data generated were able to be used in a manner similar to those obtained by an emergency-department–based system, with the potential added benefits of earlier reporting and an expanded surveillance network. Thus, the study shows that primary-care–based syndromic surveillance is practical. Furthermore, the expansion of electronic data systems makes data processing and transfer increasingly simple and inexpensive. In addition to determining feasibility of data collection and analysis at the practice level, this study identified several key issues and considerations that must be addressed before widespread implementation of syndromic surveillance in primary care. These issues include selection of meaningful syndromes, accommodation to daily visit fluctuation, adjusting the threshold level, investigation of signals, variation in practice information systems, and coordination with health departments.
Which syndromes to study is an important consideration in implementing syndromic surveillance. We have found that in 1 practice only 3 (fever, respiratory, and gastrointestinal) of the 10 syndromes produced an average of more than 1 case per day. This finding suggests that individual practice-based surveillance may need to focus on these syndromes, in that they produce the greatest numbers of cases. Aggregate data across multiple practices could, however, address all syndromes.
Another consideration is whether and how to address daily and seasonal fluctuations in visit frequency and type. In this study, we omitted weekend data from our analyses, because their data patterns varied markedly from weekday data. In a larger system, however, this variation between weekdays and weekends or holidays could be adjusted for statistically. The military-based Electronic Surveillance System for the Early Notification of Community-Based Epidemics (ESSENCE), which analyzes encounter data from a variety of practice settings in the Washington, DC, area, has developed regression models that adjust for visit fluctuations on weekends and holidays, using categorical variables to represent the day and varying the statistical model (Poisson vs linear regression) depending on the commonness of the syndrome.8
Relatively straightforward methods for assigning thresholds have been established, such as the EARS method that was used in this study.6 These thresholds can guide clinicians to investigate selected cases. Threshold computation and clinician-alert messages can be programmed to notify clinicians automatically on days when the number of cases exceeds the threshold. This method can be adjusted easily by modifying the standard deviations used if a threshold is found to be too sensitive.
ICD-9 diagnostic codes are generally available from primary care clinics immediately after an encounter and have been found to have better accuracy and sensitivity than chief complaint data for syndromic surveillance.8 Although most practices use ICD-9 codes for billing, there is little uniformity in technology and information systems across practices. Standardized reporting and transmission of data across practices would, therefore, be needed to implement a primary-care–based surveillance system; however, as was shown in this study, they can be accomplished by a relatively simple programming step.
Other efforts to pilot syndromic surveillance in the community setting have been reported. The military-based syndromic surveillance system, ESSENCE, uses ICD-9 diagnostic codes to define a set of syndromes that, while not identical, are similar to those developed by the CDC.9 For aberration detection within ESSENCE data, users may choose among a temporal detector, the project-modified and exponentially weighted moving average technique, or algorithms based upon EARS.10 Additional practice-based surveillance systems have been piloted in Massachusetts and Minnesota.11
Although the tabulation and statistical analysis of syndromes can be automated, investigation of positive signals requires attention by clinicians or epidemiologists. Some investigation of above-threshold signals can be conducted by drilling down in the existing electronic data; for example, by comparing patterns across adjacent practices and seeking corroboration from other sources (eg, laboratories, emergency departments). 12 Some follow-up investigation will require clinician review of cases, however, and most likely telephone contact between public health staff and primary care clinicians. This study did not address the issue of case follow-up, and the current workload of primary care physicians may make it challenging to add this task to a day’s responsibilities. An electronic medical record system in primary care practice, by providing the reviewing clinician with rapid access to case histories, would probably streamline this task.
The best method for conducting surveillance for bioterrorism attacks and emerging infections remains controversial. To date, all outbreaks of anthrax and other bioterrorist events have been brought to light by observant clinicians who made the diagnosis and reported the case or cases using traditional disease-reporting systems, generally a telephone call to the local or state health department. Thus, syndromic surveillance remains unproved in spite of considerable investment of time and energy to its implementation. Some events, however, particularly those that are not initially lethal or that resemble common infections, may be best detected by syndromic surveillance, if systems can be developed that are timely, sensitive, and not excessively costly.13
The rapid conversion of primary care practices to electronic medical records opens up the possibility of new, potentially low-cost, early detection systems for emerging infectious diseases. As has been shown in this study, daily ICD-9 codes can be readily converted to de-identified data sets, aggregated into CDC syndrome classes, and compared with daily site-specific thresholds. The time and cost associated with integration of such a procedure into a surveillance system, and, in particular, the potential impact of false-positive signals, remains a challenge, but one that may be worth pursuing. Figure 2⇓ represents our recommendations for the design of such a system. It combines on-site review by a lead clinician with region-specific evaluations, most likely by a centralized health department office, and ready lines of communication between practice staff and the local and state health departments. Such a comprehensive system, integrating data from multiple primary care practices with data from hospitals and emergency medical service providers and coordinated with local and state health department staff, may constitute the best model of detection of emerging infections and bioterrorist events.14

Flow chart of proposed primary-care–based syndromic surveillance system.
ICD-9 = International Classification of Diseases, Ninth Revision.
Footnotes
-
Conflicts of interest: none reported
-
Funding support: Supported by grant # R21 HS13521 from the US Agency for HealthCare Research and Quality.
- Received for publication June 9, 2005.
- Revision received November 11, 2005.
- Accepted for publication November 21, 2005.
- © 2006 Annals of Family Medicine, Inc.


Jump to section
Related Articles
Cited By...
- Clinical Population Medicine: Integrating Clinical Medicine and Population Health in Practice
- Physician surveillance of influenza: Collaboration between primary care and public health
- Observing the Spread of Common Illnesses Through a Community: Using Geographic Information Systems (GIS) for Surveillance
- On TRACK: 'Allows Readers and Authors to Go One Step Further'
- In this Issue: Mixed Methods and Diverse Perspectives