
Abstract
PURPOSE Universal coverage of physician services should serve to reduce socioeconomic disparities in care, but the degree to which a reduction occurs is unclear. We examined equity in use of physician services in Ontario, Canada, after controlling for health status using both self-reported and diagnosis-based measures.
METHODS Ontario respondents to the 2000–2001 Canadian Community Health Survey (CCHS) were linked with physician claim files in 2002–2003 and 2003–2004. Educational attainment and income were based on self-report. The CCHS was used for self-reported health status and Johns Hopkins Adjusted Clinical Groups was used for diagnosis-based health status.
RESULTS After adjustment, higher education was not associated with at least 1 primary care visit (odds ratio [OR] = 1.05; 95% confidence interval [CI], 0.87–1.24), but it was inversely associated with frequent visits (OR = 0.77; 95% CI, 0.65–0.88). Higher education was directly associated with at least 1 specialist visit (OR = 1.20; 95% CI, 1.07–1.34), with frequent specialist visits (OR = 1.21; 95% CI, 1.03–1.39), and with bypassing primary care to reach specialists (OR = 1.23, 95% CI 1.02–1.44). The largest inequities by education were found for dermatology and ophthalmology. Income was not independently associated with inequities in physician contact or frequency of visits.
CONCLUSIONS After adjusting for health status, we found equity in contact with primary care for educational attainment but inequity in specialist contact, frequent visits, and bypassing primary care. In this setting, universal health insurance appears to be successful in achieving income equity in physician visits. This strategy alone does not eliminate education-related gradients in specialist care.
- Access to health care
- healthcare disparities
- primary health care
- specialist care
- health services research
- educational status
- socioeconomic factors
- Canada
- health care delivery
INTRODUCTION
Most health systems strive to provide care to those who need it regardless of their socioeconomic status (SES). The degree to which health systems are successful is of major importance to policy makers and has a large effect on the nature of clinical practice. Achieving equity in care provision is challenging, though, because health follows SES gradients: individuals of lower SES have higher levels of morbidity, disability, premature mortality, and mortality.1–6 A health system that provides equitable care would therefore tend to provide more services to those in low-SES groups in response to these higher health needs.
Canadian health care is unusual in its universal insurance coverage of required physician and hospital services for all permanent residents.7 These services are provided without such financial barriers as deductibles or co-payments. Their use, therefore, should generally follow population need. Previous studies of equity in Canadian health care have relied on self-reported use of physician services8–13 or have used administrative data with limited ability to control for health status.14,15 Overall, studies have failed to agree on whether primary care is equitable8,10,14,16,17 or not9,11–13 and on whether specialist care is equitable17 or not.8–16 Several studies have found inequity in contact with physicians or frequency of visits, but not both.9–13 Previous studies have not examined potential mechanisms of inequitable care, such as bypassing primary care to reach specialists, or how equity in utilization of services varies by physician subspecialty.
As low SES is known to be associated with poor health, adjustment for health status is necessary for interpretation of SES gradients in care. Our objective was to examine equity in primary care and specialist office visits in a universal health insurance setting after controlling for health status using multiple self-reported and diagnosis-based measures. Secondary objectives were to examine whether groups of high SES bypass primary care to reach specialists and whether equity in office visits varies among physician specialties.
METHODS
Ontario is Canada’s largest province with a population approaching 11.5 million people in 2001. The Ontario Ministry of Health and Long-Term Care provides coverage of all necessary physician services in the province without co-payments or deductibles.
Canadian Community Health Survey
Statistics Canada’s Canadian Community Health Survey (CCHS)—Cycle 1.1, conducted in 2000–2001,18 used a multistage, stratified cluster design with a target population that included household residents in all provinces and territories. The principal exclusions were populations on Indian reserves, Canadian Armed Forces bases, and some remote areas. The CCHS response rate was 84.7%. The Ontario portion of the CCHS consisted of 37,681 respondents in 37 health regions. We limited our analyses to respondents aged 20 to 79 years and excluded pregnant women based on health care claims.
Socioeconomic measures used from the CCHS included education and income. We categorized education as low (not completed high school), medium (high school completion and some postsecondary education), and high (university degree). Income was defined using total household income adjusted for the number of people living in the household and categorized as low (Statistics Canada’s lowest and lower middle income), medium (upper middle income), and high (highest income). For a household with 2 or fewer people, these income levels correspond with Canadian dollar incomes of less than $30,000, $30,000 to $59,999 and $60,000 or more, respectively. Education was chosen as the primary socioeconomic variable because it has greater stability throughout adult life and it had fewer missing values than was the case for income. Nonetheless, we chose to analyze and report both education and income.
Self-Reported Health Status Measures
Measures of health status used from the CCHS included self-rated health, reporting 2 or more chronic conditions, depression, and self-reported disability. We categorized self-rated health as poor/fair vs good vs very good/excellent ratings of general health. Chronic conditions were included as a checklist in the CCHS, with room for additional reported conditions. We measured depression as a 90% probability in the past 12 months using the World Health Organization’s Composite International Diagnostic Interview short form (CIDI-SF).19 We defined disability as self-report of needing help with at least 1 instrumental activity of daily life.
Diagnosis-Based Measures of Health Status
The John Hopkins Adjusted Clinical Groups Case-Mix System measures the morbidity burden of patient populations based on disease patterns, age, and sex.20–22 It uses diagnostic information found on health claims to generate a family of measures that include patterns of morbidity, comorbidity, and resource use. This system is in wide use in the United States, Canada, and internationally for understanding case-mix differences in care, and in many jurisdictions it is used for adjustment of capitation payments. Aggregated diagnosis groups (ADGs) are groupings of diagnostic codes that are similar in terms of severity and expected persistence. The number of ADGs a patient has is a robust measure of comorbidity.23 For this study, we summed and categorized the number of ADGs as 10 or more (high), 6 to 9 (medium), and 0 to 5 (low). Resource utilization bands (RUBs) are aggregations of age-sex diagnostic groups that are associated with different levels of expected resource use and represent the expected burden on the health care system.20,24,25 RUB values vary from 0 to 5, with higher values associated with higher utilization levels. For this study, we categorized RUBs as 4 or more (very high), 3 (high), 2 (medium), and 0 to 1 (low). We measured Adjusted Clinical Groups for the period from April 2001 to March 2002 to assess health status at a time similar to that of the CCHS.
Subsequent Health Care Utilization
CCHS respondents were asked to provide their Ontario health numbers, and 87.2% of respondents were linked to the universal Ontario Health Insurance Plan (OHIP) for 2 fiscal years from April 2002 to March 2004. We applied poststratification weighting to the final linked sample to attain population-representative estimates. All health numbers were scrambled, and all names and other identifying information were removed before data analysis. The OHIP database included all physician fee-for-service claims, consisting of approximately 94% of all physician services in Ontario. Analyses were limited to office visits and determined specialist status using OHIP specialty coding based on the pattern of services billed. Specialist referrals are initiated in writing by another physician, and a written report to the referring physician is required. Although specialist visits without a referral are not prohibited in Ontario, consultations resulting from referrals have specific codes for each specialty and are paid at a higher fee than other office visits. General internists and gynecologists have largely referral practices in Ontario, and for that reason they were included as specialty and not primary care physicians.
We measured access to family physicians/general practitioners (FP/GPs) and specialists by the occurrence of any office visit during 2002–2004 and calculated frequency of visits among those with a visit. We categorized the number of visits as above or below the median number of visits (10 visits for FP/GPs, 5 visits for specialists). To assess whether patients were bypassing primary care to reach specialists, we calculated the proportion of specialist visits with a referral. We identified the first specialist visit during 2002–2004 as a referral if it had a consultation code or if a referral had been made to the same specialist in the office, emergency department, or hospital in the 2 years before 2002.
Analytic Approach
We calculated rate ratios by age and sex for education and income according to self-reported and use-based measures of health status. Using logistic regression, we modeled none vs at least 1 FP/GP and specialist visit, and infrequent and frequent FP/GP visits (1 to 9, and 10 or more visits) and specialist visits (1 to 4, and 5 or more visits) among those with a visit. Models included education, income, urban-rural residence, age, and sex (model 1), the above factors plus self-reported measures of health status (model 2), and all of the above factors plus diagnosis-based measures of health status (model 3). We used model 3, comparing high with low education, to examine interspecialty differences in having at least 1 office visit. Sensitivity analyses were performed using Poisson regression, modeling the number of FP/GP and specialist visits. For a sensitivity analysis, we modeled education and income as binary variables. Bootstrap weights provided by Statistics Canada were used with 500 replications to obtain 95% confidence intervals. We expected this study to have a sample of more than 25,000 linked Ontario respondents. This sample size is sufficient to have statistical significance (α=.05; 1–β = 0.8) for rate ratios approaching 1.1.26 Analyses of specific specialties involved subgroups of the overall sample that were expected to have limited power. For that reason, we did not adjust those analyses for multiple comparisons but report them here as hypothesis generating. All analyses were performed using SAS 9.1 (SAS Institute, Cary, North Carolina).
The Research Ethics Board of Sunnybrook Health Sciences Centre, Toronto, Canada approved this study.
RESULTS
The linked study group consisted of 26,995 individuals aged 20 to 79 years, which decreased to 25,558 after pregnant women were removed, representing slightly more than 8,367,000 Ontarians. The proportion of the study population with low, medium, and high education was 18.3%, 30.8%, and 50.9%, respectively (Table 1⇓). Poor-fair self-rated health, at least 2 chronic conditions, depression, and disability were reported by 12.8%, 41.6%, 11.7% and 13.9%, respectively. High counts of ADGs and high RUBs were found for 30.3% and 12.1% of the sample, respectively. Female participants were older, had lower SES, and had worse health status than male participants (all P <.001).
Sociodemographic and Morbidity Measures by Sex for Population-Weighted Canadian Community Health Survey, 2000–2001 for Ontario, and Johns Hopkins Adjusted Clinical Groups, 2001–2002
The rate ratios on Table 2⇓ indicate consistently better health status among those with higher education and higher income. This finding applies to every age and sex group and to both self-reported and diagnosis-based measures of health status.
Distribution of Morbidity Measures by Education and Income, Population-Weighted Canadian Community Health Survey, 2000–2001, for Ontario, and Johns Hopkins Adjusted Clinical Groups, 20001–2002
A total of 22,278 respondents had a FP/GP visit, and 14,350 a specialist visit during the 2 years, corresponding with 82.5% and 53.2% of the study population, respectively. Contact with FP/GPs and specialists, as measured by at least 1 visit, was similar across education and income levels, with most rate ratios close to 1.0 (Table 3⇓). Frequency of visits, as measured by more than the median number of visits (10 for FP/GPs and 5 for specialists), was lower for respondents with high education and income, with rate ratios for FP/GPs and specialists generally below 1.0.
Patient Utilization of Family Physicians/General Practitioners and Specialists by Education and Income, Population-Weighted Canadian Community Health Survey, 2000–2001, for Ontario, and Ontario Health Insurance Plan Claims, 2002–2004
The analyses displayed on Tables 4⇓ and 5⇓ were run separately for men and women and examined to assess potential interactions by sex in the association of education and income with health care utilization. As no major differences were found, and interactions were not significant, results are presented for both groups combined, adjusting for sex. After controlling for income, urban-rural location, age, and sex, education was not associated with contact with FP/GPs, as measured by having at least 1 visit (Table 4⇓, partially adjusted model). Higher education was associated with less-frequent FP/GP visits, as measured by having fewer than 10 visits. These findings remained similar after further adjusting for self-reported and diagnosis-based morbidity (Table 4⇓, fully adjusted model).
Patient Utilization of Family Physicians/General Practitioners by Education and Income, Population-Weighted Canadian Community Health Survey, 2000–2001, for Ontario, and Ontario Health Insurance Plan Claims, 2002–2004
Patient Utilization of Specialists by Education and Income, Population-Weighted Canadian Community Health Survey, 2000–2001, for Ontario, and Ontario Health Insurance Plan Claims 2002–2004
Income followed a similar pattern when controlling for education. Education was not associated with contact with or frequency of specialist visits after controlling for income, urban-rural location, age, and sex (Table 5⇑, partially adjusted model). After further controlling for self-reported and diagnosis-based morbidity (Table 5⇑, fully adjusted model), however, higher education was significantly associated with greater contact with and frequency of specialist visits. This increase was approximately 20% more than those with lower education for both access to and frequency of specialist visits. After controlling for education, income was not associated with specialist visits in any model.
Urban location, increasing age, and female sex were generally associated with higher levels of utilization (Tables 4⇑ and 5⇑, fully adjusted models). Poor-fair health was associated with lower access to FP/GPs but greater frequency among those who had a visit and greater access to and frequency of specialist visits. Higher levels of diagnosis-based morbidity were strongly and significantly associated with greater access to and frequency of FP/GP and specialist visits. Poisson regression analysis produced similar results, as did using education and income as binary variables (results not shown).
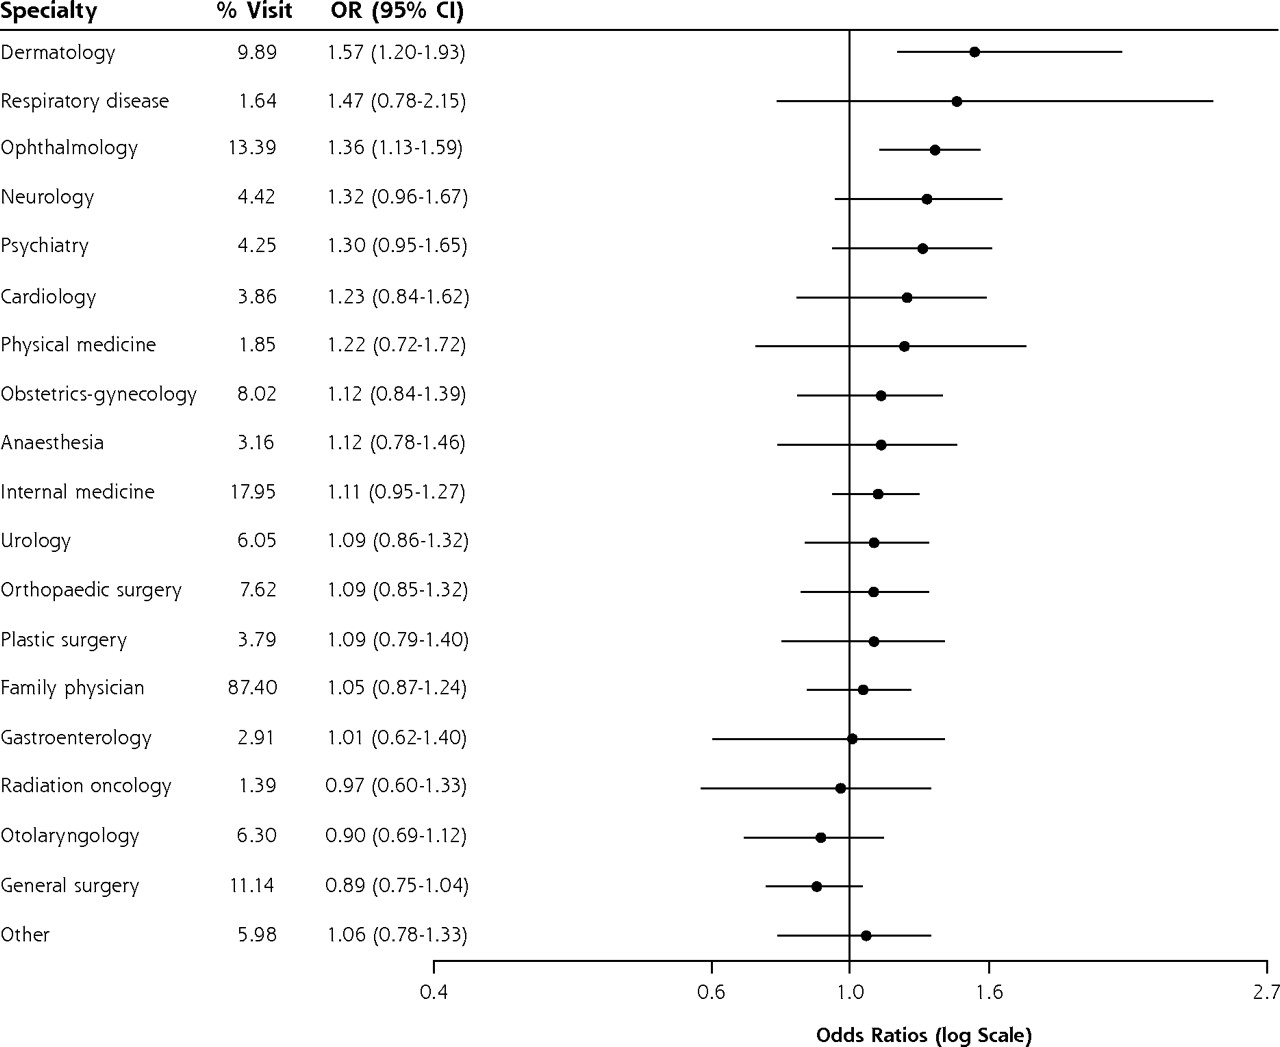
The physicians who were visited by at least 1% of respondents appear by specialty in Figure 1⇓. A great majority of respondents had seen a FP/GP (87%); fewer saw general internists (18%), ophthalmologists (13%), general surgeons (11%), and dermatologists (10%). After controlling for factors in the fully adjusted models in Tables 4⇑ and 5⇑, those with higher education were more likely to have had at least 1 visit with dermatologists and ophthalmologists, with rates 40% to 60% higher than among those with lower education.

Utilization of at least 1 office visit by specialty, adjusted for sociodemographic characteristics, self-reported morbidity, and diagnosis-based morbidity.
The proportion of visits to specialists that were referrals was similar among those with higher and lower educational attainment (85.0% and 84.6%, respectively) and higher and lower income (80.9% and 85.2%, respectively). After adjusting for age, sex, urban-rural location, and self-reported and diagnosis-based health status, those with higher education were more likely than those with lower education to bypass primary care to reach specialists (OR = 1.23; 95% CI, 1.02–1.44). After adjustment, differences between high-and low-income groups did not reach statistical significance (OR = 1.15; 95% CI, 0.97–1.32).
DISCUSSION
In a setting with universal coverage of necessary physician services, the well-educated do not have preferential contact with primary care, but they do have more specialist contact and more frequent specialist visits, and they bypass primary care to reach specialists more often. Unlike education, income does not appear to be independently associated with inequities in physician visits. These findings suggest that universal health insurance is successful in achieving income equity in physician visits but that this strategy alone does not eliminate education-related gradients in specialist care.
Previous Canadian literature about these relationships has been inconsistent. Several studies have used self-reported rather than actual utilization, most often directly from national population health surveys.8–13 Self-report appears to underestimate actual physician office visits, and there is little validation of recall of visits up to the preceding 12 months.27–29 Differences in reporting by SES has not been well examined but could explain some of the differences found in these studies. Most of these studies had some adjustment for health status, and all found higher specialist use among those of higher SES, usually defined as high income. Other studies used health administrative data without linkage to other data sources and reported conflicting findings about specialist care and SES.14,15 The postal code proxies for SES found in secondary databases have been widely used, but they have also been criticized for creating substantial misclassification.30,31
Two previous studies linked population survey data with actual utilization, one using the 1990 Nova Scotia Nutrition Survey16 and the other the Ontario portion of the 1994–1995 National Population Health Survey.17 The first of these studies did not adjust for health status and found comparative underuse of specialist services with low income. The second adjusted for self-rated health as a single measure. As did our study, it found increased access to specialists among the well-educated but not the wealthy; unlike our study, it found no relationship between education and intensity of specialist use (measured as expenditures).
This study has strengths and limitations. Among its strengths, we used individual-level rather than area-level SES, reported both education and income effects, created linkage with actual health care utilization, analyzed both contact with physicians and frequency of physician visits, and adjusted for morbidity and comorbidity using both self-reported and diagnosis-based measures, all of which are important advances compared with previous work. Our study is the first to examine bypassing primary care to reach specialists and inequity by physician specialty. There are several limitations, however. SES is multidimensional and involves both actual and relative differences across groups. Our use of educational attainment as a primary exposure variable does not capture the complexity of SES, but education level is relatively stable during the adult life course and had a high response rate in the CCHS. Ontario’s fee-for-service claims do not include alternate payment plans, such as salaried physicians in community health centers. Nonetheless, non–fee-for-service physician services were limited at the time of the study, and they involved mainly primary care and not specialist physicians in the province. The reasons why certain specialties were accessed more by the well-educated respondents require further investigation. This study had limited power to examine differences by specialty, reflected in the wide confidence limits in Figure 1⇑. For that reason, these interspecialty differences should be seen as hypothesis-generating and requiring confirmation. Increased use of dermatologists32 and psychiatrists33 by Ontarians of high SES has been found in other studies, but those studies did not compare across specialties.
Inequity in specialist care in Ontario by educational attainment is apparent, but only after taking health status into account. At the same level of health, well-educated individuals are more likely to see specialists, to be frequent visitors, and to bypass primary care than those with lower educational attainment. This inequity appears to vary among specialties. It is reassuring, and reinforces the value of universal coverage of physician services, to find little evidence of income gradients in either primary or specialty care. The reasons for greater use of specialists among those with high education remain unclear. Bypassing primary care to reach specialists appears to be an important mechanism through which contact is made with specialists. Root explanations likely include better health knowledge and health attitudes leading to greater demand for care and better ability to navigate the health system. The increased contact with dermatologists and ophthalmologists but not general surgeons, for example, suggests that demand for health care plays a major role. Those with higher educational attainment may also have more social contact with physicians, both in university and afterward, than those with lower educational attainment. The appropriate level of specialist care is not discernible in these analyses, nor is any relationship with health outcomes, but these issues should be further studied. At least in the United States, there does not appear to be a relationship between higher levels of specialist supply per population and better health outcomes.34
Policy makers should consider the advantages of providing universal physician coverage for reducing income inequities. This strategy alone is unlikely to eliminate education gradients in use of physician services. Given better health knowledge and perhaps also social relationships, it may be difficult in any health system to completely eliminate preferential access to medical care among the well-educated population.
Acknowledgments
The authors wish to thank Brandon Zagorski for his assistance with use of the Johns Hopkins Adjusted Clinical Groups software.
Footnotes
-
Conflicts of interest: none reported
-
Funding support: Lyn Sibley is supported as a Fellow of the Canadian Institutes of Health Research. The Institute for Clinical Evaluative Sciences is supported by the Ontario Ministry of Health and Long-Term Care.
-
Disclaimer: The findings and opinions reported here are those of the authors, and no endorsement by the Ministry is intended or should be inferred.
- Received for publication August 28, 2008.
- Revision received January 6, 2009.
- Accepted for publication January 21, 2009.
- © 2009 Annals of Family Medicine, Inc.
REFERENCES


Jump to section
Related Articles
Cited By...
- Collecting sociodemographic data in primary care: qualitative interviews in community health centres
- Routinely asking patients about income in primary care: a mixed-methods study
- Lignes directrices de pratique clinique 2018 de Diabete Canada: Principaux messages a lintention des medecins de famille qui traitent les patients atteints de diabete de type 2
- Diabetes Canada 2018 clinical practice guidelines: Key messages for family physicians caring for patients living with type 2 diabetes
- Adverse effect of long work hours on incident diabetes in 7065 Ontario workers followed for 12 years
- Integrated care for resected early stage lung cancer: innovations and exploring patient needs
- Do baby boomers use more healthcare services than other generations? Longitudinal trajectories of physician service use across five birth cohorts
- Building a Foundation to Reduce Health Inequities: Routine Collection of Sociodemographic Data in Primary Care
- Making the case for primary care
- Unintended consequences of delisting routine eye exams on retinopathy screening for people with diabetes in Ontario, Canada
- Reinventing Primary Care: Lessons From Canada For The United States
- In This Issue: Critical Topics in Primary Care