
Abstract
PURPOSE This study compared ecology (number of individuals using a service), utilization (number of services used), and expenditures (dollars spent) for various categories of medical services between primarily 1996–1997 and 2011–2012.
METHODS A repeated cross-sectional study was performed using nationally representative data mainly from the 1996, 1997, 2011, and 2012 Medical Expenditure Panel Survey (MEPS). These data were augmented with the 2002–2003 MEPS as well as the 1999–2000 and 2011–2012 National Heath and Nutrition Examination Survey. Individuals (number per 1,000 people), utilization, and expenditures during an average month in 1996–1997 and 2011–2012 were determined for 15 categories of services.
RESULTS The number of individuals who used various medical services was unchanged for many categories of services (total, outpatient, outpatient physician, users of prescribed medications, primary care and specialty physicians, inpatient hospitalization, and emergency department). It was, however, increased for others (optometry/podiatry, therapy, and alternative/complementary medicine) and decreased for a few (dental and home health). The number of services used (utilization) largely mirrored the findings for individual use, with the exception of an increase in the number of prescribed medications and a decrease in number of primary care physician visits. There were large increases in dollars spent (expenditures) in every category with the exception of primary care physician and home health; the largest absolute increases were in prescribed medications, specialty physicians, emergency department visits, and likely inpatient hospitalizations.
CONCLUSIONS Although the number of individuals with visits during an average month and the total utilization of medical services were largely unchanged between the 2 time periods, total expenditures increased markedly. The increases in expenditure varied dramatically by category.
- delivery of health care
- health expenditures
- utilization
- costs and cost analysis
- primary care
- policy
- planning
INTRODUCTION
The “Ecology of Medical Care” was initially published in 19611 and laid a framework for evaluating medical care in the United States. To update the estimates and to examine trends over time, this model was reevaluated in 2001 (using 1996 data) and in 2016 (using 2012 data) using more robust and systematically collected data from the Medical Expenditure Panel Survey (MEPS).2,3 Our 2016 study identified a stable proportion of individuals during an average month who sought medical care, even though the types of care individuals sought changed somewhat.3
In contrast, medical expenditures have outpaced inflation and are notably higher than those in other developed countries on both a per capita and percent gross domestic product basis.4 Unfortunately, these higher levels of expenditure do not correspond with better outcomes as the United States has among the worst outcomes when compared with similar nations.5 Previous studies have investigated how expenditures associated with medical care have changed over the past 50 years,6 and more recent studies have shown that in the 2000s, prescription drugs and hospital outpatient and physician care have led to a disproportionate amount of the increase.7 Research to date has not, however, synthesized previous ecology frameworks with the increasing expenditures of medical care.
Given the stable number of individuals in the system and the relatively small changes in their distribution within the system,3 the increases in expenditure on medical care could be related to an increase in the overall number of services used, changes in the types of services provided, or changes in the cost or intensity of the services delivered, or some combination thereof. To better quantify the breakdown of increases in the expenditures and to gain further understanding of the medical care system, 3 frameworks were constructed and synthesized: individuals who sought care in an average month, a standardized model of utilization, and a standardized model of expenditures. The synthesis of these 3 frameworks might provide a more nuanced understanding of how the medical care system has changed over the past 15 years.
METHODS
Analyses were based primarily on data from the 1996, 1997, 2011, and 2012 MEPS.8 Years were grouped into 1996–1997 and 2011–2012 to reduce random variation, especially among expenditure data. MEPS is nationally representative of the civilian noninstitutionalized population of the United States and is cosponsored by the Agency for Healthcare Research and Quality and the Centers for Disease Control and Prevention. The survey includes information regarding demographics, medical conditions, health insurance status, medical events and expenditures, and prescribed drugs. The response rates were 70.2% (1996), 66.4% (1997), 54.9% (2011), and 56.3% (2012).
Three standardized frameworks (individual, utilization, and expenditure) were created using an identical methodology to allow for comparison between the models. The models were standardized to a unit per 1,000 noninstitutionalized individuals per month to harmonize this analysis with previous publications.1–3 Specifically, the individual framework estimates the number of individuals using a service per 1,000 individuals during an average month, while the utilization model provides cumulative visits/uses over an average month per 1,000 individuals, and the expenditure model provides cumulative expenditures over an average month for 1,000 individuals.
Categories of services in the analysis were any medical (total); outpatient; inpatient; emergency department (ED); physician; nurse and midlevel clinician (nurse practitioner, physician assistant, nurse midwife); optometry/podiatry; alternative/complementary medicine; dental; home health; diagnostic testing/treatment (when no clinician was seen during a visit or main reason for the visit was immunization or allergy shot); therapy; and prescribed medications. Outpatient physician visits were further broken down into visits with primary care physicians and with specialty physicians, but required data from additional years of the MEPS (detailed below). Primary care physicians were defined as those in family medicine, general practice, geriatrics, internal medicine, or pediatrics. Multiple visit types could potentially be obtained from the same visit, but this situation was infrequent (<.01%); the exception was for the treatment category, which is where a visit was allocated by definition if no other visit type was identified. In contrast to the approach used in the 2016 publication,3 visits primarily for immunization or allergy shots were allocated to the diagnostic testing/treatment category.
Several additional data sources were used in this study. The 2002 and 2003 MEPS were used as the base year for physician specialty given that these years were the first 2 years in which that information was included in the survey. Alternative/complementary medicine estimates were notably different from previously published estimates,2 which was addressed in the supplemental material from a previous study.3
Although prescribed medications are identified within the MEPS, grouping them into an average month format is not possible because no date is associated with the prescription or time of use; therefore, the National Health and Nutrition Examination Surveys (NHANES)9 from 1999–2000 and 2011–2012 were used to determine the number of individuals reporting medication use and total number of medications used in the last 30 days. MEPS expenditure data were used to determine expenditures on prescribed medications. Estimated pharmaceutical rebates were not factored into drug costs given lack of an accurate estimate for the earlier time period.10
Methodology for determining expenditure within the MEPS is provided in detail in the survey methodology.8 Broadly, expenditures are defined as “what is paid for a health care service”8 and includes payments by all payers, including patients’ out-of-pocket expenses.
Ratios between the different models were used to allow for easier comparisons between them. The utilization-to-ecology ratio is a ratio of the total number of medical events to the number of people experiencing a particular medical event during an average month. An increase in this ratio provides evidence that individuals who have an event are using that service more frequently. The expenditure-to-individual and expenditure-to-utilization ratios give a perspective of how the expenditure per person and expenditure per visit changed between the 2 time points. Ratios between different data sources (MEPS and NHANES) did not have significance testing done.
All expenditure data were adjusted to 2012 dollars using the Consumer Price Index.11 Complex survey weighting was included in all analyses. A statistical significance level of .01 was selected given the number of comparisons made; the adjusted Wald test was used to determine statistical significance. Analysis was conducted using Stata version 13 (StataCorp, LP). The Ohio State University Institutional Review Board determined that the study did not constitute human subjects research.
RESULTS
There was no significant difference over time in the individual or utilization frameworks for total visits, outpatient visits, physician visits, specialty physician visits, ED visits, nurse and midlevel clinician visits, or inpatient hospitalizations (Table 1 and Figures 1 and 2). In contrast, expenditures increased in most of these categories, including total, outpatient, outpatient physician, specialty physician, nurse and midlevel clinician, and ED expenditure. Primary care physician visits decreased in the utilization framework but not in the individual or expenditure frameworks. Inpatient hospitalization expenditures did not change significantly over time (Table 1 and Figure 3). There were increases in the expenditure-per-visit and expenditure-per-individual ratios in all of the above categories, although the relative increases varied dramatically (Figures 1 and 2, and Supplemental Tables 1 and 2, available at http://www.annfammed.org/content/15/4/313/suppl/DC1/). There was no significant change, however, in the utilization-to-individual ratio for total visits, outpatient visits, specialty physician visits, nurse and midlevel clinician visits, or inpatient hospitalizations (Supplemental Table 3, available at http://www.annfammed.org/content/15/4/313/suppl/DC1). The utilization-to-individual ratio fell for outpatient physician visits and primary care physician visits, while the ratio rose for ED visits (Supplemental Table 3).
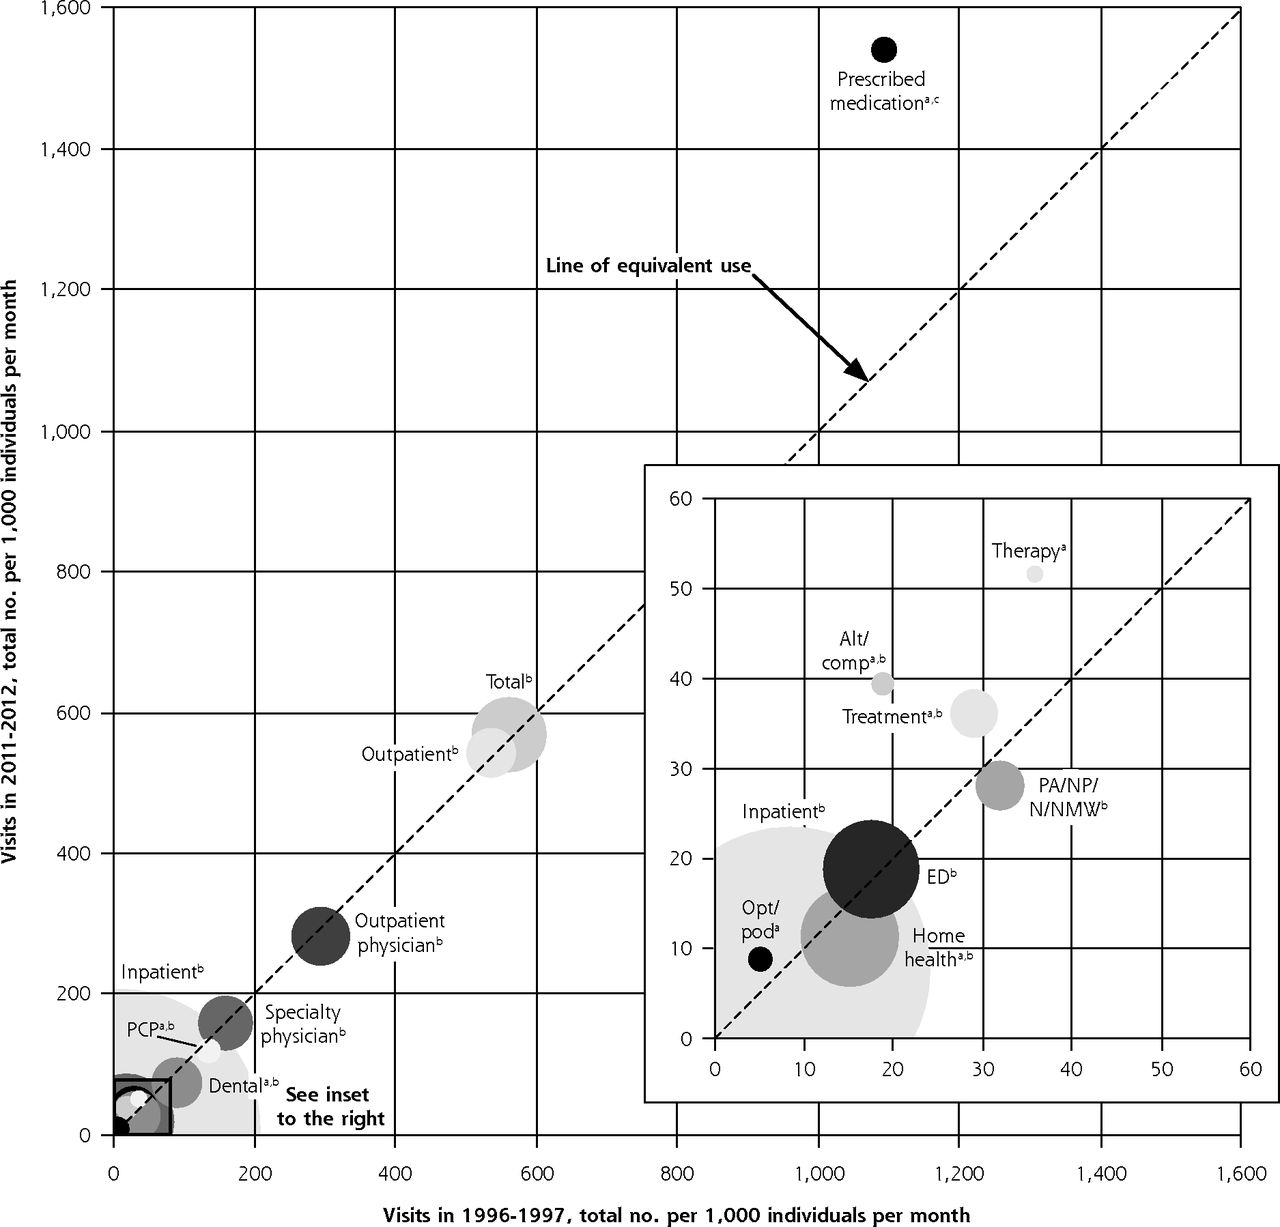
Utilization, Individuals, and Expenditures per 1,000 Individuals per Month

Total medical services used and change in expenditure over time.
Alt=alternative medicine; Comp=complementary medicine; ED=emergency department; N=nurse; NMW=nurse midwife; NP=nurse practitioner; Opt=optometrist; PA=physician assistant; Pod=podiatrist; PCP=primary care physician.
a P <.01 for a difference in utilization between the 2 time points.
b P <.01 for a difference in the expenditure-to-utilization ratio between the 2 time points.
c No statistical testing done for the difference in the expenditure-to-utilization ratio between the 2 time points.
Notes: The figure compares the total visits per 1,000 in an average month on various medical services in 1996–1997 and 2011–2012. Marks (center of circles) above the line of equivalence (dashed line) indicate higher expenditures in 2011–2012. The area of the circles represents the change in expenditure-to-visit ratio for each category. Primary care physician and specialty physician comparator year was 2002–2003 instead of 1996–1997. The prescribed medication utilization data came from the 1999–2000 and 2011–2012 National Health and Nutrition Examination Survey (NHANES). Adapted with permission from NEJM. 2016(374):495–496.

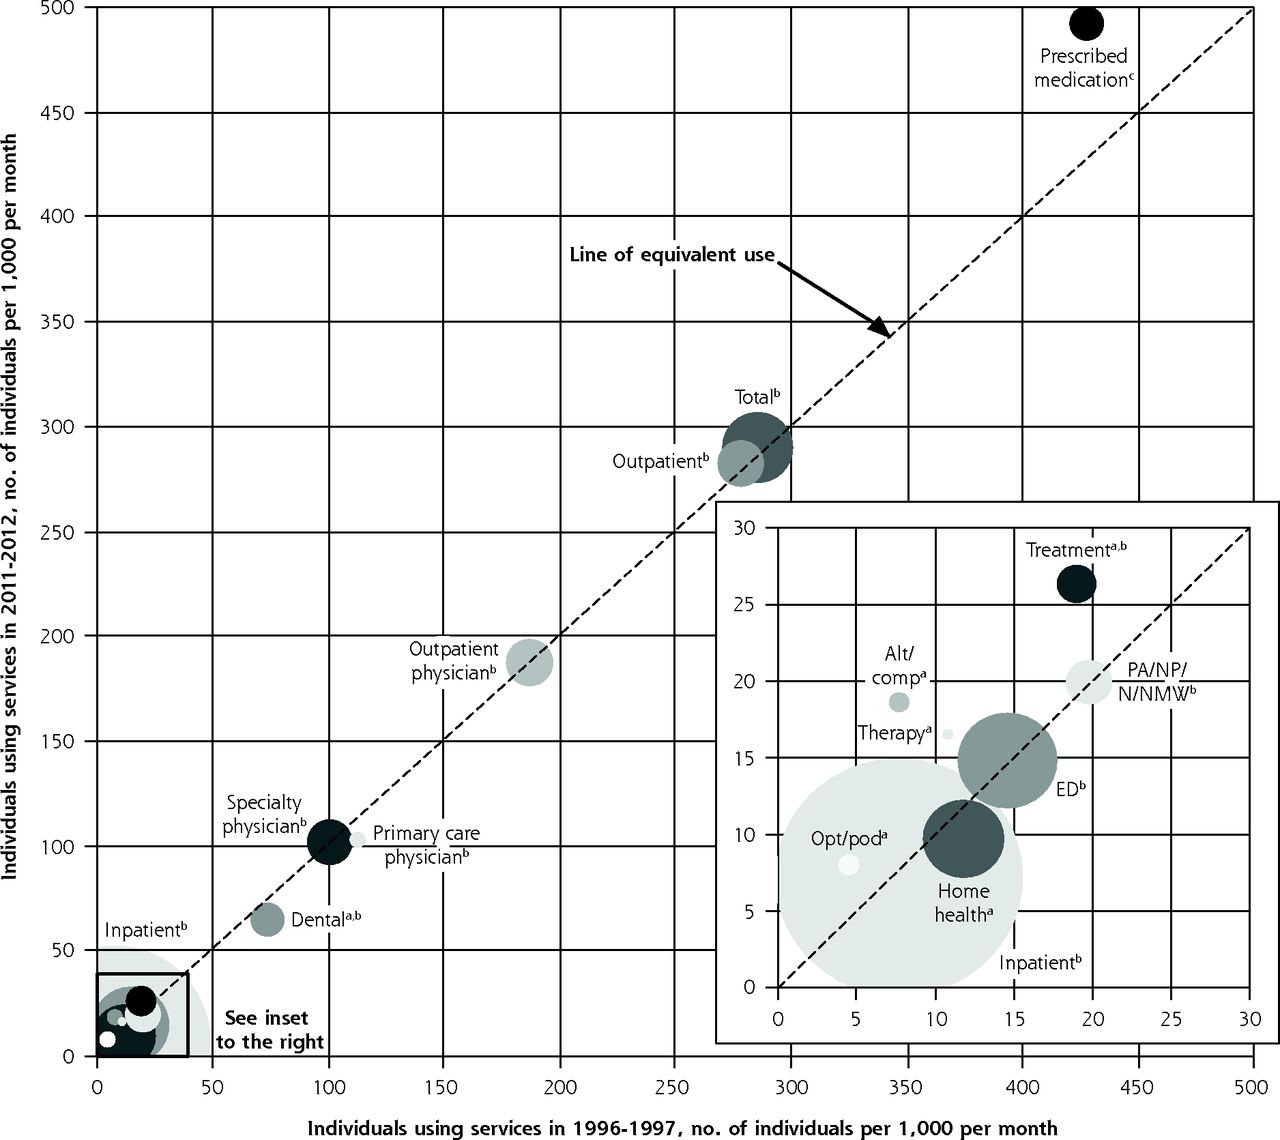
Individuals using medical services and change in expenditure over time.
Alt=alternative medicine; Comp=complementary medicine; ED=emergency department; n=nurse; NMW=nurse midwife; NP=nurse practitioner; Opt=optometrist; PA=physician assistant; Pod=podiatrist
a P <.01 for a difference in number of individuals between the 2 time points.
b P <.01 for a difference in the expenditure-to-individual ratio between the 2 time points.
c No statistical testing done for the difference in the expenditure-to-utilization ratio between the 2 time points.
Notes: The figure compares the number of individuals per 1,000 in an average month who used various medical services in 1996–1997 and 2011–2012. Marks above the line of equivalence (dashed line) indicate higher expenditures in 2011–2012. The size of the circles represents the change in expenditure-to-individual ratio for each category. Primary care physician and specialty physician comparator year was 2002–2003 instead of 1996–1997. The prescribed medication data came from the 1999–2000 and 2011–2012 National Health and Nutrition Examination Survey (NHANES).

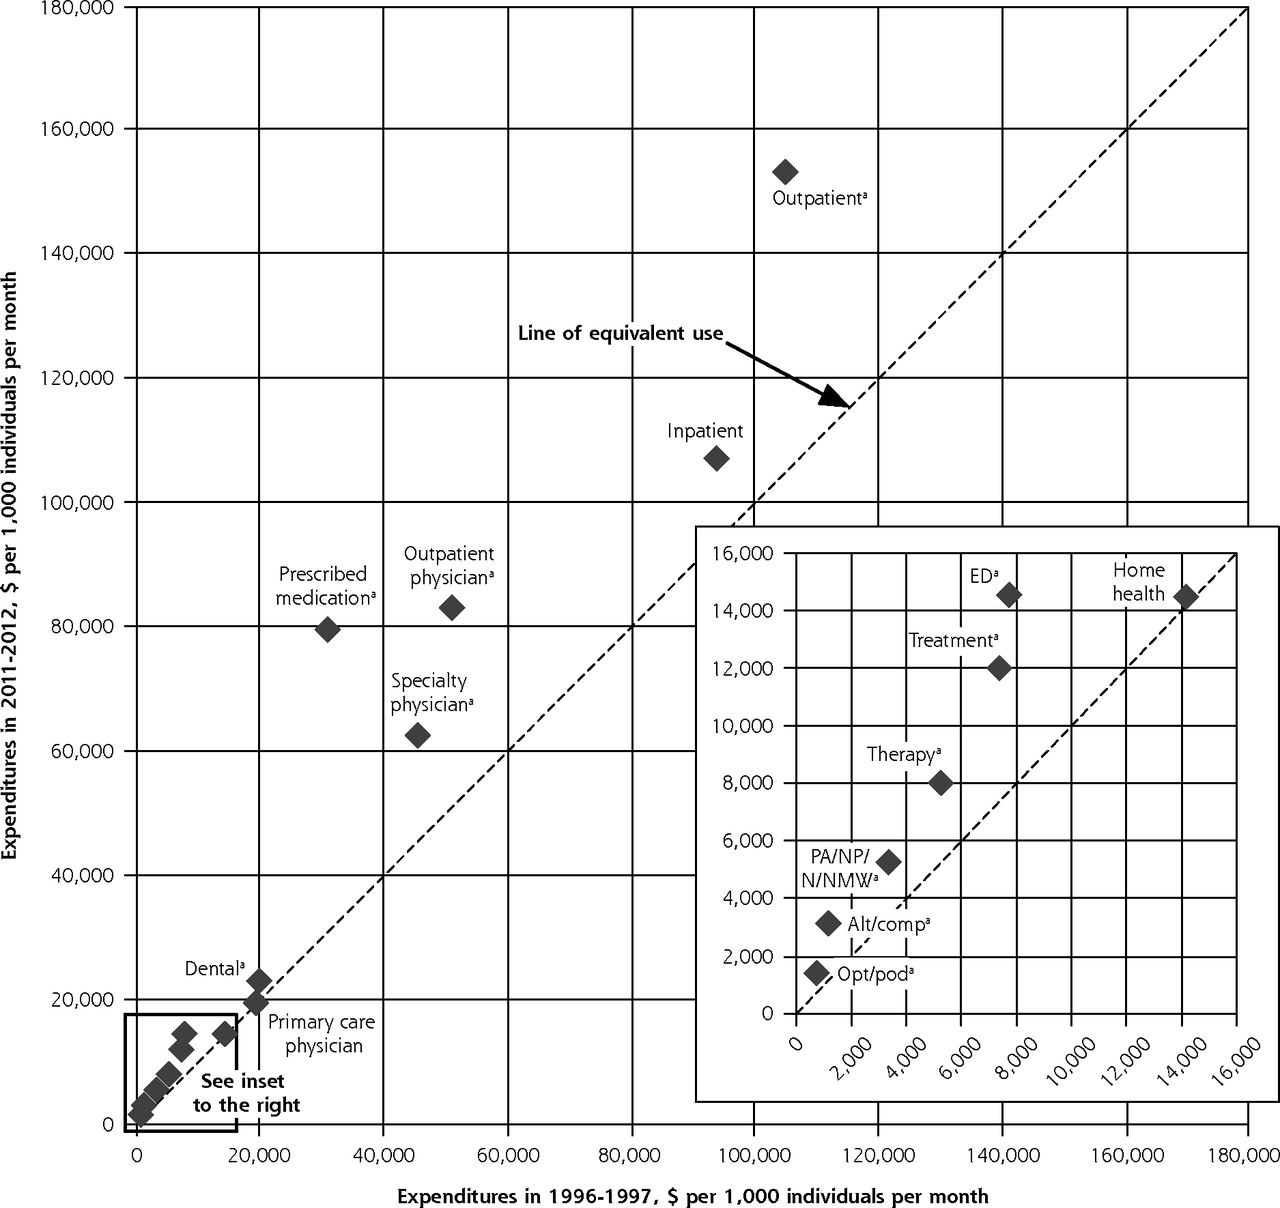
Expenditures on medical services and change over time.
Alt=alternative medicine; Comp=complementary medicine; ED=emergency department; n=nurse; NMW=nurse midwife; NP=nurse practitioner; Opt=optometrist; PA=physician assistant; Pod=podiatrist.
a P <.01 for a difference between 1996–1997 and 2011–2012.
Notes: The figure compares the expenditure per 1,000 in an average month on various medical services in 1996–1997 and 2011–2012. Marks above the line of equivalence (dashed line) indicate higher expenditures in 2011–2012. Primary care physician and specialty physician comparator year was 2002–2003 instead of 1996–1997. Prescribed medicine expenditure data came from the 1996–1997 and 2011–2012 Medical Expenditure Panel Survey (MEPS).
Prescribed medication use was higher in 2011–2012 in the utilization and expenditure frameworks but not in the individual framework. Although the amount of increase per individual or prescription was smaller than that in other categories, a large share of the increase in expenditure, 42.2%, was related to increases in prescription drug use, even though this expenditure was responsible for only 12.5% of total expenditures in 1996–1997.
Therapy, treatment, optometry/podiatry, and alternative/complementary medicine visits increased in the individual, utilization, and expenditure frameworks. There were no significant changes, however, in the expenditure-to-individual ratios in any of the categories with the exception of treatment. In addition, the expenditure-to-utilization ratio was higher for treatment visits and alternative/complementary medicine visits (Figure 1 and Supplemental Table 1). The utilization-to-individual ratio was lower for treatment visits and alternative/complementary medicine visits (Supplemental Table 3).
Dental visits and home health visits decreased in both the individual and utilization frameworks. Dental expenditures increased, while home health expenditures did not change. The utilization-to-individual ratio decreased for dental and home health visits; however, the expenditure-to-utilization and expenditure-to-individual ratios increased for both categories (Figures 1 and 2 and Supplemental Tables 1, 2, and 3).
DISCUSSION
Over the past 15 years, changes to the medical care system and society at large have resulted in no differences to small differences in most categories of medical care in terms of the number of individuals seeking care or in the number of services. On the other hand, the expenditure framework showed increases in expenditure in nearly every category. Total expenditures increased by 47.2%, from $246 per individual per month in 1996–1997 to $362 per individual per month in 2011–2012. During this same time, the total number of individuals with a visit in an average month and the total number of visits were unchanged. Collectively, the study’s findings therefore suggest that the increases in expenditure have little to do with an increase in the number of individuals receiving services or the total volume of services, but much to do with the cost of treating the same number of individuals with the same number of services.
Proportionally, the most notable increases in expenditure and utilization were for prescribed medications: for this service category, expenditure rose by 159% and utilization rose by 45%. Some of the increase in expenditure is probably related to methodologic changes in the survey8 and potentially an increase in percent of pharmaceutical rebates10; however, a substantial majority of the increase is likely related to higher levels of use of more expensive prescription medications. More recent data indicate continuation of the trend of increasing prescription drug expenditures.12–14
Although the outpatient physician expenditure significantly increased, there was no corresponding increase in the individual or utilization frameworks in the physician categories. If the trends seen from 2002–2003 to 2011–2012 were similar to the unknown trends between 1996–1997 and 2002–2003 for primary care physicians and specialty physicians, the difference seen in specialty physician expenditure is likely an underestimate, and nearly all of the increase in expenditure for the outpatient physician category between 1996–1997 and 2011–2012 was related to specialty physicians.
Visits to primary care physicians decreased, while the number of individuals who saw a primary care physician fell nonsignificantly. It is possible that these decreases were related to greater use of alternative communication pathways.15,16 The Centers for Medicare and Medicaid Services is testing alternative payment models in primary care in hopes of improving outcomes and lowering overall health care costs.17 The combination of flat costs, decreasing use of primary care, and a recent evaluation of the models casts doubt on the potential success of these primary care redesign efforts through the Centers for Medicare and Medicaid Services.18,19 Given that nearly all of the increases in expenditures were external to primary care, cost reduction emanating from primary care would likely require considerable alterations to aspects of the 3 frameworks along with influence and infrastructure that most primary care clinics do not currently possess. To more explicitly state this point, primary care could optimally reduce the stable ED utilization, specialized physician visits, and inpatient hospitalizations within the population that are associated with a primary care physician, but primary care has little control over either the increasing expenditures when an individual is in an alternative location or the largely stable individual and utilization frameworks that have persisted over the course of this study. The one area in which primary care could directly lower expenditures is prescribed medications,8 but the amount of this reduction is uncertain as the data do not allow for splitting these expenditures between specialty and primary care physicians.
Emergency department use did not change in the individual or utilization frameworks, while expenditures markedly increased. Previous estimates of the MEPS have estimated ED expenditures to be about 2% of total health care expenditures.20 In the analysis reported here, ED expenditures had increased to about 4% of total health care expenditures. As there is underreporting of ED visits in MEPS, however, this value is likely an underestimate of actual ED expenditures as well as its proportion of total expenditures.21,22 Given the consistent methodology within the MEPS, ED expenditures dramatically increased between the 2 time points even as the total utilization and the number of individuals using the ED was stable.
In contrast to total visits and more physician-centric categories, therapy, optometry/podiatry, and alternative/complementary medicine increased in the utilization, individual, and expenditure frameworks. Given that the expenditure ratios, especially with the individual framework, for therapy, optometry/podiatry, and alternative/complementary medicine visits did not increase or increased at a slower rate than for other categories, this finding implies that the rise in these categories’ expenditures are related more to increases in the number of individuals who see these clinicians during a given month. The observed patterns also suggest that medical care has become more multidisciplinary.
The nurse and midlevel clinician visit category did not change in the utilization or individual frameworks; however, expenditures for this category increased. The lack of change in this category seems counterintuitive given the increased numbers of nonphysician clinicians.23 Even though immunization/allergy shot visits were excluded from this category, the absence of an expected increase could be related to a decrease in the proportion of nurses and midlevel clinicians working in physicians’ offices irrespective of whether they held advanced degrees.24 It is also possible that more midlevel clinicians practice in urgent care settings that are likely disproportionately underreported in the MEPS.21,25 Nurse practitioner visits likely increased along with an identified increase in physician assistant visits (data not shown). If this is the case, it seems that midlevel clinician visits are, to some extent, displacing outpatient visits that were previously with nurses (or clinicians whom respondents identified as nurses). Regardless of whether there was a change in composition of visits in this category, there was a dramatic increase in its expenditure-to-utilization ratio that is comparable only to that seen for prescribed drugs and ED.
Given that the data used in this study predate the Affordable Care Act, it is yet to be determined if this legislation will alter the observed patterns, especially the continued increase in expenditures. It seems unlikely, however, that the Affordable Care Act will substantially shift the patterns of the individual or utilization frameworks, given that previous government programs, demographic changes, and disease patterns have not notably altered them.1–3 Larger systematic interventions and more disruptive innovations will likely be required to substantially alter these models. It will be interesting to see how the “medical ecology” could be altered by technologic advances.16
It appears that there have been gains in health outcomes among the Medicare population,26 but gaps in health with comparator nations appear to be increasing.6 It is also unknown to what extent the increases in expenditure are related to increased costs for treatments, drugs, and tests of similar efficacy. Even those interventions and tests that have increased efficacy, however, should be better investments than alternative options such as public health or the education system. Substantially curbing the trend of higher expenditures will likely require much larger disruptions to the system and a greater appreciation for more upstream aspects of health. Current efforts that focus on downstream aspects of medicine have shown limited success at decreasing expenditures or altering the use of the medical care system.3,27
This analysis has numerous limitations. Survey respondents are known to underreport certain types of services, especially outpatient and ED visits.21 It is also possible that they misreported certain aspects of care, such as clinician type. The nurses and midlevel clinicians category could not be split into primary vs specialty care, which could have attenuated or enhanced the identified patterns of primary and specialty physicians. Inpatient hospitalization costs were likely partially responsible for the increased expenditures, but wide confidence intervals due to high-cost hospitalizations likely explains why no significant difference was identified. The inability to use the MEPS to determine prescribed medication for the individual or utilization frameworks, and the inability to distinguish primary care vs specialty care before 2002 are weaknesses. It is also possible that changes in methods used for determining medication expenditures increased the identified differences.8 MEPS is known to underreport total expenditures compared with National Health Expenditure Accounts estimates, but some of this difference is likely related to the MEPS sampling frame (the noninstitutionalized population).28,29 Given these limitations, caution should be exercised when comparing data from this study with data from other sources, as the primary strength of the data presented here is the consistent methodology within the survey. The analysis also did not control for potential confounding factors such as demographics, societal interventions, or overall health. It is possible that this lack of control contributed to some of the patterns seen. Finally, as only 2 time points were investigated instead of yearly trends, it is possible that some of the identified values are outliers that do not accurately represent change over time.
In conclusion, although the number of individuals with a visit and total utilization of medical services during an average month were unchanged, there were changes, mostly small, in some individual categories of both the individual and utilization frameworks. In contrast, the number of prescription drugs being used and expenditures in nearly all categories of services increased. The majority of the increase in expenditures was from prescription drugs, specialty physicians, ED visits, and likely inpatient hospitalizations.
Acknowledgments
The author would like to acknowledge Caroline Richardson, MD, University of Michigan, for review of the manuscript and William G. Conley, PhD, for assistance with the graphical presentation of the data.
Footnotes
Conflicts of interest: author reports none.
Supplementary materials: Available at http://www.AnnFamMed.org/content/15/4/313/suppl/DC1/
- Received for publication August 23, 2016.
- Revision received December 1, 2016.
- Accepted for publication December 31, 2016.
- © 2017 Annals of Family Medicine, Inc.
In this issue


Jump to section
Related Articles
Cited By...
- Decreasing Use of Primary Care: A Repeated Cross-Sectional Study of MEPS 2007-2017
- The Ecology of Medical Care Before and After the Affordable Care Act: Trends From 2002 to 2016
- Emergency Department High Utilizers among Family Medicine Patients
- In This Issue: Trends, Prescribing, Deprescribing
- Bending the Trends