
Abstract
PURPOSE In a primary care context favoring group practices, we assessed the validity of 2 new continuity measures (both versions of known provider continuity, KPC) that capture the concentration of care over time from multiple physicians (multiple provider continuity, KPC-MP) or from the physician seen most often (personal provider continuity, KPC-PP).
METHODS Patients with diabetes or cardiovascular disease (N = 765) were approached in the waiting rooms of 28 primary care clinics in 3 regions of the province of Quebec, Canada; answered a survey questionnaire measuring relational continuity, interpersonal communication, coordination within the clinic, coordination with specialists, and overall coordination; and gave permission for their medical records to be reviewed and their medical services utilization data for the previous 2 years to be accessed to measure KPC. Using generalized linear mixed models, we assessed the association between KPC and the patients’ responses.
RESULTS Among the 5 different patient-reported measures or their combination, KPC-MP was significantly related with overall coordination of care: for high continuity, the odds ratio (OR) = 2.02 (95% CI, 1.33–3.07), and for moderate continuity, OR = 1.61 (95% CI, 1.06–2.46). KPC-MP was also related with the combined continuity score: for high continuity, OR = 1.52 (95% CI, 1.11–2.09), and for moderate continuity, OR = 1.48 (95% CI, 1.10–2.00). KPC-PP was not significantly associated with any of the survey measures.
CONCLUSIONS The KPC-MP measure, based on readily available administrative data, is associated with patient-perceived overall coordination of care among multiple physicians. KPC measures are potentially a valuable and low-cost way to follow the effects of changes favoring group practice on continuity of care for entire populations. They are easy to replicate over time and across jurisdictions.
INTRODUCTION
Continuity of care is a core component1–3 and an intrinsically desirable attribute of primary care, especially among patients with chronic diseases.4 Primary care continuity is commonly conceptualized as relational and defined as the “presence or duration of relationship with a regular physician,” and often operationalized by “measures of concentration of patient care with particular providers.”5,6 Continuity of care is associated with patient satisfaction, desirable care processes (fewer hospitalizations and emergency visits, lower costs, more preventive care), and improved health status.7,8 Yet current primary care reorganization efforts favor group practices3,9,10 that may reduce personal continuity.3,11
Coordination of care12–14 is very important for most patients15–18 but represents a major challenge for those who provide health care.13 There is evidence that effective team work is associated with better continuity of care, patient satisfaction, outcomes, and quality improvement.19–21
Many continuity measures have been created,12,22–25 including a recent effort to develop a generic measure of continuity provided by a team of clinicians.26 The most commonly used measures based on health services utilization patterns are the usual provider continuity (UPC) and continuity of care (COC) indices. Both, however, are sensitive to utilization levels (infrequent users have high continuity). UPC is relatively simple but captures continuity among multiple physicians at the practice site level only. COC captures multiple physician continuity by attributing referral visits back to the referring physician, but this information is not regularly available. These measures have rarely been validated against patient surveys.15,27–29 New measures are needed for continuity across organizational and disciplinary boundaries.29
We propose new continuity measures, based on administrative medical services data, which provide clear interpretation of continuity from year to year. These new measures can distinguish infrequent visits as continuous or not (1 visit to a single physician in a given year does not provide continuity if that physician was not seen in the previous year), thereby reducing sensitivity to utilization levels. No other available measure can make this distinction. The new measures also capture year-to-year continuity provided by multiple physicians regardless of practice sites.
In this article we assess the validity of 2 new continuity measures, based on administrative data, that capture the concentration of care from year to year with multiple physicians (known provider continuity–multiple providers, KPC-MP) or a particular physician (known provider continuity–personal provider, KPC-PP). Our objective is to assess the association between KPC measures and patient perceptions of continuity of care, measured using previously validated patient surveys.
METHODS
Setting, Context, Population, Data Sources
This study is a secondary analysis of a previous study conducted in 3 regions of the province of Quebec, Canada, where the health system provides full insurance coverage for physician services, almost all of which are remunerated on a fee-for-service basis and recorded in administrative databases.30 For the main study, directors of a random sample of 37 primary care clinics (stable for at least 2 years and with at least 3 family physicians) responded to a survey of clinic characteristics and allowed interviewers in the waiting room to identify patients with diabetes, cardiovascular disease, or acute illness. Of 3,206 patients who appeared eligible for inclusion in the study and invited to participate, 954 refused (30%), and 744 of those who accepted (33%) were ineligible after chart review. By applying this percentage (33%) to those who refused, we estimate the refusal rate in truly eligible patients to be around 20%. Administrative data could not be found for 51 patients. In the end, 1,457 patients answered a questionnaire and consented to have their file and administrative data (which report only medical services) reviewed. For our secondary analysis, we excluded patients who did not have either of the 2 chronic conditions targeted. We also excluded patients seen in 11 community health centers by salaried physicians, because the KPC measures require fee-for-service remuneration status.
Definition of Known Provider Continuity
The denominator for all our KPC measures is the total number of ambulatory care visits to a physician (family physician or specialist) in a given year X (Figure 1). The numerator is the subset of ambulatory care visits to physician(s) in year X who were also visited by the patient in the previous year (X-1). These physicians are considered known providers of health care. The numerator-to-denominator ratio is the basis of the calculated continuity. In this article, we present 2 KPC measures using different numerators: visits in year X with the physician seen most often in the previous year (year X-1) reflect KPC-PP; visits in year X with multiple physicians (regardless of specialty), each seen at least once in year X-1 reflect KPC-MP.*
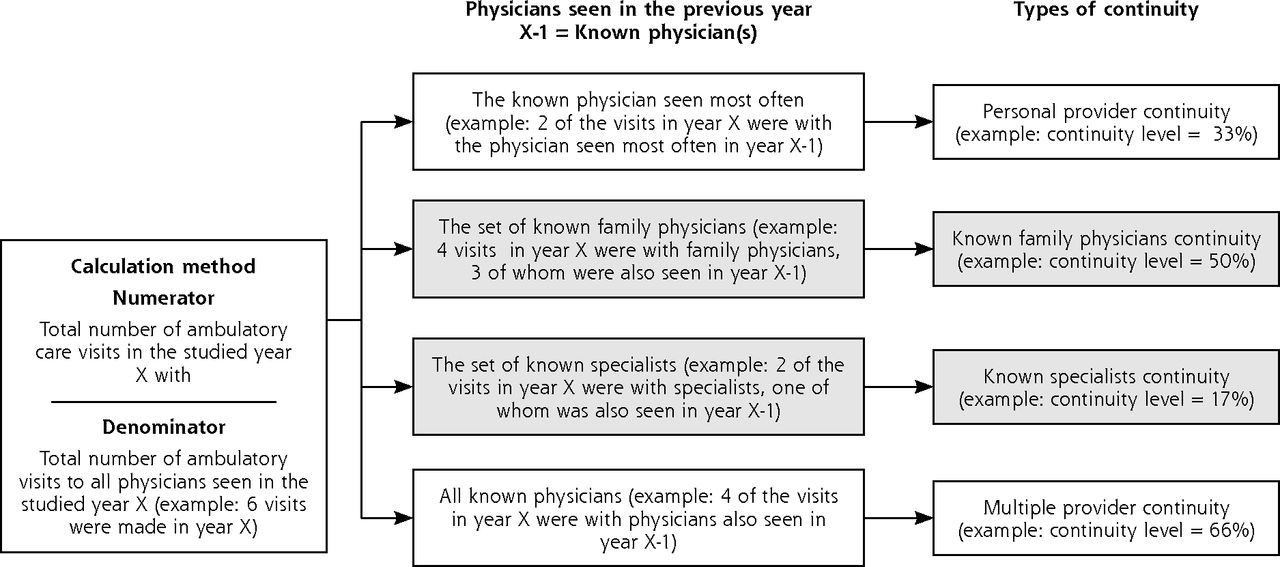
Definition of known provider continuity (KPC).
Note: Types of continuity in gray are not measured in this article, ie, among the physicians also seen in year X-1, as we did not distinguish between family physicians and specialists.
Table 1 provides operational definitions of all variables used in the analysis. In this article, we assess the validity of KPC-PP, which relates to the UPC, the most commonly used measure of concentration of care with 1 physician, and KPC-MP, which constitutes a new measure for the concept of coordinated care provided by multiple physicians. This type of coordination continuity has never been assessed using administrative databases.
Operationalization of Measures in the Analysis
Established Measures From Survey Questionnaires
We used survey measures as our reference standard because they are known to have good psychometric performance, they capture the most important concepts of continuity (longitudinal relationship, relationship quality, coherence of management or coordination, and timely information), and they reflect the patient’s perspective.12,26,29 These same concepts and the instruments to measure them were also identified by Haggerty et al26 through in-depth review of qualitative studies of patients’ experience of receiving care from various clinicians over time, review of available instruments, and extensive cognitive testing with patients.
To measure relational continuity, interpersonal communication, and coordination within the clinic, we used the contextual knowledge of patient, communication, and integration of care subscales of the Primary Care Assessment Survey (PCAS).22 We used the coordination subscale of the Primary Care Assessment Tool (PCAT)23 to capture coordination with specialists.
We measured coordination across the system with the overall coordination subscale of the Veterans Affairs National Outpatient Customer Satisfaction Survey (VANOCSS).24 The questions and their sources, continuity dimension, reliability, and combination of the 5 published measures are presented in the Appendix, which can be found at the end of this article. We rescaled all measures so their scores ranged from 0 to 10, with higher scores indicating higher communication and coordination.
Combined Continuity Score
We combined the 5 measures into an overall continuity score by summing their z scores. We then obtained the z score of the composite by taking into account correlations among components.34 This combined score reduces the attenuation associated with the reliability of the individual measures (Appendix).
Other Key Variables
For all analyses, we measured patient morbidity using the Johns Hopkins ACG (Adjusted Clinical Groups) System,35,36 which categorizes patients into Resource Utilization Bands (RUBs) using International Classification of Diseases, Ninth Revision (ICD-9) diagnoses appearing in administrative databases.
Age, sex, and education were obtained from the questionnaire.
Statistical Analysis
In the analyses, we took into account patient nesting within clinics by using generalized linear mixed models with HLM 8.0.8 (Scientific Software International) or IBM SPSS 20.0.0 (International Business Machines Corp). We used a multinomial logit model, which does not assume that a change in the level of predictors (KPC measures) is associated in an ordered fashion with the categories of the dependent variables (survey measures). We grouped variables into categories to take into account their nonnormal distribution with frequent ceiling effects. We analyzed each dependent variable initially with models that included all control variables, and then we dropped control variables from the model if their contribution appeared negligible (ie, when dropping them from the model produced an change in the odds ratio [OR] of less than 0.1). Clinics were nested in 3 regions, a number insufficient to model a third level. Nonetheless, we used region as a covariable in the second level.
Research Ethics Approval
Use of the data was authorized by the ethics committees of 8 different organizations and Quebec’s privacy regulator, the Commission d’accès à l’information.
RESULTS
Of the 1,457 patients who answered the questionnaire and consented to have their file and administrative data (which report only medical services) reviewed, we excluded 514 patients who did not have either of the 2 targeted chronic conditions and 178 patients who were seen in the 11 community health centers by salaried physicians. The remaining 765 eligible patients who participated in the study came from 28 rural and urban clinics—9 in 2 regions and 10 in another. Excluded patients were similar to those retained in terms of sociodemographic characteristics (Table 2) but appeared to have lower morbidity (results not shown, as our morbidity measure is affected by incomplete ascertainment of medical services).
Characteristics of Patients in the Study
Participating clinics varied according to number of years the physicians had worked there, number of full-time equivalent physicians, managers’ involvement, collaboration agreements with other clinics or hospitals, nursing presence, on-site diagnostic services, and practice type (private vs family medicine group).37
The 765 participating patients were regular users of primary care (99.1% had a family physician). As a group, they were much older (50% were older than 66 years vs 16% who were aged 65 years or younger) than the general population (Table 2). They were also sicker than the general population (mean Short Form-12 [SF-12] physical component summary score = 40 vs 44, respectively; RUB score of 4 or 5 = 40% vs 10%, respectively). The 5 continuity measures obtained by responses on the survey questionnaire had mean values of 7.9 or greater on a scale of 0 to 10, with some showing a ceiling effect, as 24.6% to 58.4% of respondents endorsed the most positive response option for these measures. In parallel, the respondents’ administrative data position 19.6% of respondents in the high category of KPC-PP (continuity score greater than 74) and 47.2% in the high category of KPC-MP.
Table 2 also displays patient characteristics by KPC-MP level. Three of the 6 sociodemographic variables show significant differences according to KPC-MP levels, without clear trends. Mean SF-12 physical health and number of ambulatory visits do not differ significantly. Continuity variables from patient questionnaires show no significant differences except for overall coordination and the combined continuity score (most show a trend in which high values of these variables are associated with high values of KPC-MP). All interaction terms between explanatory variables and control variables are nonsignificant.
Table 3 displays the associations between the patient survey measures and the KPC-MP measures of continuity of care. KPC-MP is significantly associated with overall care coordination. The multinomial results show that when patients’ KPC-MP is increased by 1 category, the odds ratio of their being in the moderate overall coordination category increases by a factor of 1.61 (95% CI, 1.06–2.46), whereas the odds ratio of being in the high overall coordination category increases by a factor of 2.02 (95% CI, 1.33–3.07). KPC-MP—moderate, OR = 1.48 (95% CI, 1.10–2.00); and high, OR = 1.5 (95% CI, 1.11–2.09)—is significantly associated with the combined score for the 5 continuity survey measures. Irrespective of statistical significance, all odds ratios associated with high categories of the dependent variables are higher than those associated with the respective moderate categories. This finding suggests ordinal analyses could be done in a future study.
Relationships Between Patient Survey Measurements and Multiple Provider Continuity
Table 4 shows the regression results and indicates the extent to which KPC-PP measures are associated with each of the survey measures and with the combined continuity score. None of the results reaches statistical significance at an α = .05 threshold. Only among patients with high levels of KPC-PP does the combined score for patient-reported continuity of care approach statistical significance, OR = 1.30 (95% CI, 0.97–1.74).
Relationships Between Survey Measurements and Personal Provider Continuity
Tables 3 and 4, however, present 24 estimates, of which 21 are greater than 1.
DISCUSSION
Patients in this study were followed up by a regular family physician in an ambulatory setting for diabetes or cardiovascular disease. They were older and sicker than users of care in the general population, but they represent the group of patients most likely to benefit from continuity of care and to require the contribution of multiple health professionals to optimize their care. As such, they are a suitable group to validate new continuity measures based on administrative data.
We compared KPC-PP and KPC-MP with patient perceptions using 5 survey measures related to the multidimensional concept of continuity (relational continuity, interpersonal communication, within-clinic coordination, coordination with specialists, overall coordination). We obtained each validated measure from the literature.
Our generalized linear mixed models show no significant relationship between KPC-PP and the 5 individual survey measures or the combined continuity score. Results for the combined continuity score, however, were nearly significant. The relatively small number of patients in this study limited its power, which may explain a result similar to the only other study that related a survey measure of continuity to UPC and COC.27 Furthermore, qualitative studies suggest patients can consult other clinicians without significant loss of perceived relational continuity with the main physician, as long as contact is of sufficiently high quality16,18,38 or specialty care utilization remains below a certain threshold. 28
In contrast, our KPC-MP measure is significantly related to overall care coordination and the combined continuity score. This finding represents the first time a continuity measure that can be obtained from administrative databases has been found to be associated with a patient-reported measure of care coordination. Haggerty et al found that the approach used by the VANOCSS overall coordination scale assesses management continuity more accurately than other survey measures.12 Although KPC-MP may not capture all aspects of informational and management continuity, it does capture that patients seen by the same set of multiple physicians from year to year are more likely to experience coordination among them.
Even in the absence of statistically significant associations, almost all obtained odds ratios are greater than 1.0 for both KPC measures. The pattern of association between KPC and survey measures is compatible with an ordinal analysis.
This study has certain limitations. Our respondents had chronic diseases, a suitable characteristic for this validation study, but we cannot assume the results would be the same for patients without or with other chronic diseases. The number of patients was relatively small, and patients were nested within clinics, which limited analytical power. As noted earlier, however, the proportion of truly eligible patients who refused to participate was around 20%, a level unlikely to affect the findings. The administrative databases we used captured only those services provided by physicians and remunerated on a fee-for-services basis, hence excluding other professions and remuneration models. This focus on physicians may have attenuated the association between the KPC measures and patient reports. In addition, the validity of the measures requires a longitudinal database, notably a baseline period, for which KPC cannot be generated. Finally, it is evident that the KPC measures do not fully capture all the concepts underlying patient-reported survey measures related to continuity of care.
This study has many strengths. The reference continuity measures were obtained from validated survey tools from the literature. These tools cover multiple dimensions of the concept of continuity, 3 of which capture interactions with professionals other than the family physician. These new KPC measures have the advantage not only of being meaningful even for infrequent users of care but also of capturing longitudinal continuity provided by multiple physicians. Given administrative databases that would include services provided by other professionals, these KPC measures could take those professionals into account and reflect their specific contributions.
In conclusion, the KPC-MP measure is clearly related to a validated survey measure of overall care coordination and to a combined continuity score summarizing 5 different validated survey measures. KPC-PP (year-to-year continuity with the physician seen most often) does not appear to be strongly related to patient-perceived measures of continuity, however. Thus, further information, in addition to a count of visits to clinicians, will be needed to assess aspects of the longitudinal clinician-patient relationship that patients value. Nonetheless, in this era of major primary care reorganization involving multiple health care professionals, KPC measures based on administrative databases could become a valuable and low-cost way to follow the effects of practice changes on continuity of care for entire populations. The KPC measures are easily replicated over time and across jurisdictions and are thus promising candidates for future characterization, validation, and application in health services research.
Acknowledgments
The authors gratefully thank Raynald Pineault, Erin Strumpf, Sylvie Provost, Danielle Routhier, and Julie Fiset-Laniel for their helpful comments and suggestions on earlier drafts of this article and Donna Riley for editing.
Appendix Components of Relational Continuity, Interpersonal Communication, Coordination Within the Clinic, Coordination With Specialists, Overall Coordination, and Combined Continuity Score

Footnotes
-
↵* Two other types of continuity can be measured depending on the group of physicians of interest: family physicians, specialists.
-
Conflicts of interest: authors report none.
-
Funding support: This work is a secondary analysis of a study funded by the Canadian Institutes of Health Research, grant MOP-844.
- Received for publication September 3, 2013.
- Revision received February 28, 2014.
- Accepted for publication July 1, 2014.
- © 2014 Annals of Family Medicine, Inc.
References
In this issue


Jump to section
Related Articles
Cited By...
- Changes in patient experience associated with growth and collaboration in general practice: observational study using data from the UK GP Patient Survey
- Predictors of Family Medicine Patient Retention in Opioid Medication-Assisted Treatment
- In This Issue: Research Briefs and New Clinical and Policy Insights