
Abstract
PURPOSE Prescription drug expenditures are the most rapidly growing component of total health care expenditures and particularly affect state Medicaid programs. We determined the extent to which increasing prescription price and changing prescribing patterns contribute to rising prescription expenditures in Medicaid.
METHODS We conducted a claims-based analysis comparing annual prescription drug expenditures and prescribing patterns. Prescription drug and outpatient visit claims for all North Carolina Medicaid enrollees from 1998 through 2000 were included. We analyzed drugs individually by combining all prescriptions and expenditures for the same drug formulation, and we calculated the number of units dispensed per person-year of enrollment.
RESULTS Prescription drug coverage for 1 person-year cost $503 in 1998 and $759 in 2000, for an annual increase of 22.8%. The average number of prescriptions filled per person-year increased from 13.0 in 1998 to 15.5 in 2000. Increased prescribing for 6 drugs accounted for more than 25% of the total increase in expenditures. The price for the 15 most expensive drugs increased an average of 4.1% annually.
CONCLUSIONS Prices for existing drugs increased slightly during the study period, but the major cause of the increase in drug costs was an increase in the number of prescriptions for new and more expensive medications. Prescribing patterns in Medicaid differ somewhat from those in the private sector and partly reflect the population with low socioeconomic status and high health care needs that it serves. To help control rising prescription drug expenditures, efforts should be undertaken to improve appropriate and cost-effective prescribing.
- Medicaid
- prescriptions, drug
- health expenditures
- delivery of health care
- health services research
- minority groups
- costs and cost analysis
- physician’s practice patterns
INTRODUCTION
Prescription drug expenditures are the most rapidly growing component of total health care expenditures, and the widespread growth in prescription expenditures has particularly affected state Medicaid programs. In 2000, the annual rate of growth of prescription expenditures was 21.4% in Medicaid compared with 17.3% nationally.1 Medicaid costs now comprise one of the largest items in state budgets and continue to grow.2 States are struggling to find ways to control these costs.
Two main factors contributing to rising prescription drug expenditures are price and use.3,4 Because the majority of state Medicaid programs have unrestricted formularies, clinicians have greater freedom with their prescribing patterns; therefore, use in Medicaid may be different than in the private sector. Changes in prescribing patterns have been shown to result in increased expenditures in the private sector,3,5 but such studies in Medicaid are lacking.6
Because Medicaid covers a population with low socioeconomic status and high health care needs, in most cases has unrestricted formularies, and is being disproportionately affected with increasing prescription drug expenditures, we conducted a 3-year claims-based analysis of one state’s Medicaid program to determine the extent to which increasing price and changing prescribing patterns contribute to rising prescription expenditures.
METHODS
Data for the period of July 1, 1997, through June 30, 2000, were obtained from the North Carolina Department of Health and Human Services Division of Medical Assistance, Section of Medicaid Management Information Systems, which contracts with Electronic Data Systems Corporation (EDS) to process all claims, including prescription drug and outpatient visit claims for Medicaid enrollees. Monthly Medicaid enrollment data were used to calculate person-years of enrollment for the study period, a method that converts the total and often volatile person-months of enrollment into an equivalent number of people enrolled for an entire year. Thus, we did not account for new or continuous enrollment, and the only major change in coverage and eligibility was the addition of 73,000 people dually enrolled in Medicaid and Medicare during the study period. We analyzed outpatient visit rates and complexities as a proxy for disease burden using Current Procedural Terminology evaluation and management codes. Reimbursed claims for prescriptions included the $5.60 pharmacist dispensing fee and excluded the $1.00 recipient copayment, both of which were in effect for the entire study period. We were unable to differentiate new prescriptions from refills. Only 0.4% of claims were incomplete.
To determine drug prices, we analyzed drugs individually by combining all prescriptions for the same drug formulation based on the dose for each unit. The unit price for each drug formulation was calculated by dividing the total expenditures for the drug formulation by the total number of units dispensed. The average price for all drugs was the mean of all the unit prices calculated both with and without weighting for volume dispensed, thus accounting for the influence of infrequently prescribed, extremely expensive drugs and reflecting the perceived price increase. Because claims data do not provide dosing of insulin, it was excluded from the drug-specific analyses. To determine prescribing rates and describe patterns, we used the number of units dispensed per person-year of enrollment.
RESULTS
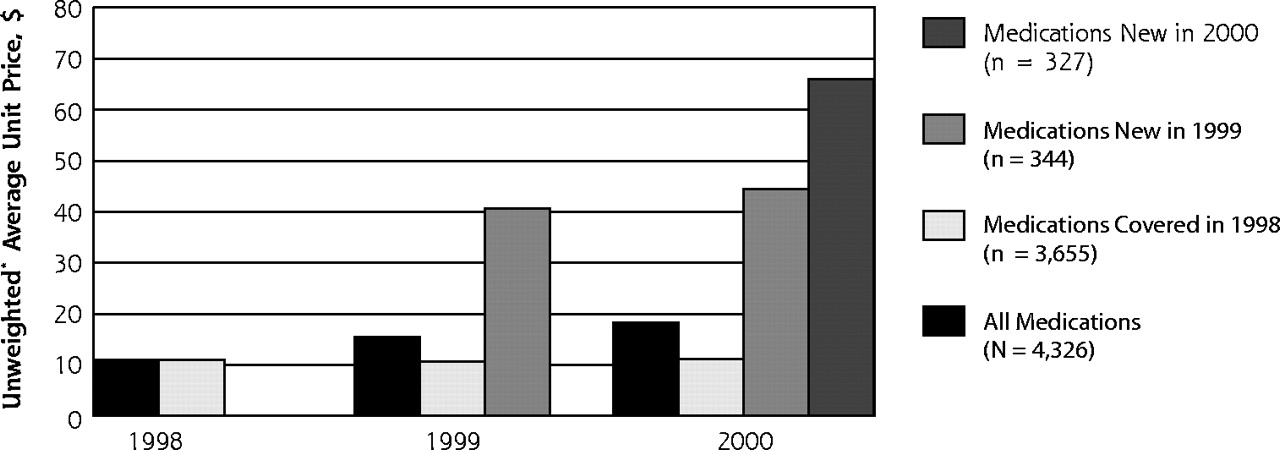
In 1998, 1,204,728 people were enrolled in the North Carolina Medicaid program for an average of 9.1 months, or 0.76 years. The characteristics of the enrollees for each year are shown in Table 1⇓ and were similar among the years. Enrollees made an average of 2 visits per year to a physician, and the visit rates and complexities were similar for all 3 years. Prescription expenditures increased substantially during the study period. The amount spent on prescription drugs totaled $461 million in 1998 and increased to $748 million in 2000 (Table 1⇓). Prescription coverage for 1 person-year in North Carolina Medicaid cost $503 in 1998 and $759 in 2000, an annual increase of 22.8%. The average number of prescriptions filled per person-year increased from 13.0 in 1998 to 15.5 in 2000. The unit price remained stable for medications available for all 3 years but increased dramatically for the newly introduced ones (Figure 1⇓).
Description of Enrollees, Visits, and Prescriptions in the North Carolina Medicaid Program, 1998–2000

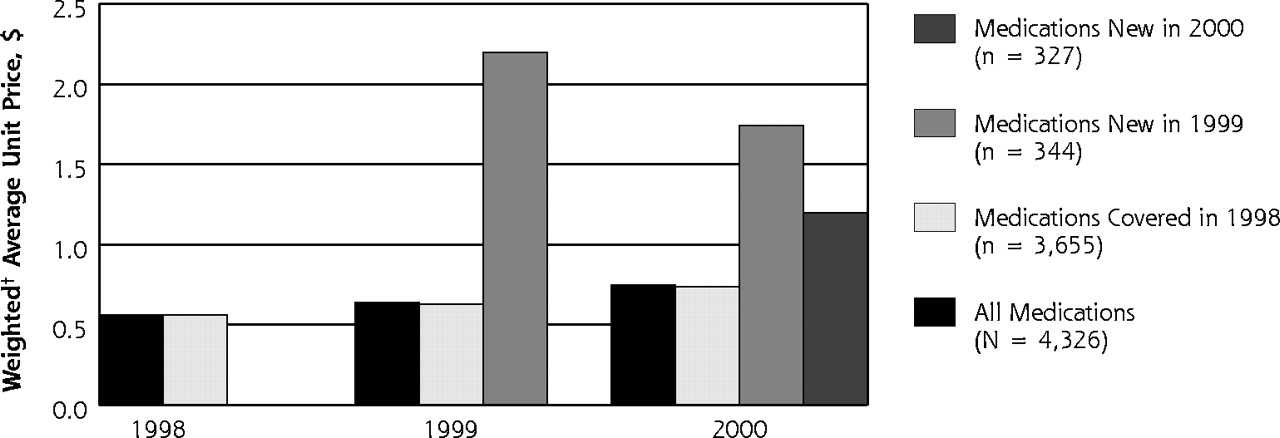
Average unit price for existing and new drugs, unweighted (top) and weighted (bottom) by volume, for the North Carolina Medicaid program, 1998–2000. * Unweighted = (∑ unit price for each drug)/(number of drugs). † Weighted = (∑units dispensed for each drug)/( ∑ expenditures for each drug).
Changing prescribing patterns was the main contributor to the rise in prescription expenditures. The 15 drugs with the greatest expenditures in 2000 are listed in Table 2⇓. These expenditures reflect both the price of the drug and the frequency with which it is prescribed. Topping the list is omeprazole (Prilosec), for which $36.2 million was spent in 2000, up by $15.9 million (79%) from 1998. This $15.9 million increase in Prilosec spending was 5.5% of the $287 million increase in total prescription expenditures from 1998 to 2000. Six drugs accounted for more than 25% of the increase in prescription expenditures.
Expenditures and Frequency of Prescribing for the 15 Most Expensive Drugs in the North Carolina Medicaid Program, 1998–2000
The price for the 15 most expensive drugs increased by an average of 4.1% annually, while the consumer price index increased by approximately 3.9% annually.7 The increase in expenditures for these drugs therefore resulted mainly from a marked increase in their frequency of being prescribed (Table 2⇑). For example, in 1998, 6.0 million tablets of Prilosec were dispensed (6.5 per person-year), which increased to 9.8 million dispensed tablets (9.9 per person-year) in 2000, and celecoxib (Celebrex) was not available in 1998, but 6.9 million tablets (7.0 per person-year) were dispensed to Medicaid enrollees in 2000.
DISCUSSION
Changing prescribing patterns is the factor most responsible for rising prescription expenditures in this population. Our findings show that individual drug prices did not increase markedly, but that prescribing patterns dramatically shifted to favor existing and new higher cost medications from 1998–2000 in the North Carolina Medicaid program. The North Carolina Medicaid program ranked 37th among states in prescription expenditures per enrollee in 1997.8
Some of the factors contributing to increased prescription expenditures in Medicaid are similar to the factors described nationwide. The National Institute for Health Care Management3 analyzed prescription data from retail pharmacy outlets, finding that a few drugs were largely responsible for the increases in prescription expenditures and that the increase in the average cost per prescription was largely affected by shifting prescribing patterns to more expensive drugs. Dubois and colleagues4 analyzed managed care and fee for service claims-based data sets, finding that volume factors accounted for the vast majority of the increases in expenditures. Shifting prescribing patterns and increasing volume to favor existing and new higher cost medications result from changes in physicians’ care. An example for increased use of existing drugs is proton pump inhibitors (PPIs) and of new drugs is cyclooxygenase-2 (COX-2) inhibitors. From 1998 to 2000, the number of prescriptions for the PPIs Prilosec and lansoprazole (Prevacid) increased 97% nationwide; celecoxib (Celebrex) and rofecoxib (Vioxx) became available in 1999, but more than $20 million was spent on them in 2000. Some patients receive additional benefit from being on such drugs rather than therapeutic substitutes, but what level of benefit warrants being treated with a more expensive medication, such as a PPI or COX-2 inhibitor, is not always clear, may be difficult to assess clinically, and is often lacking established recommendations.
Some of the drugs with the greatest expenditures in the North Carolina Medicaid program are similar to those nationally. Along with 4 aforementioned drugs—Prilosec, Prevacid, Celebrex, and Vioxx— loratadine (Claritin), fluoxetine (Prozac), paroxetine (Paxil), sertraline (Zoloft), amlodipine (Norvasc), atorvastatin (Lipitor), and metformin (Glucophage) all appear on the national top 20 drug lists for dispensed prescriptions and dollar sales.5 Some drugs are prescribed more frequently in Medicaid, however. Of note, our list includes the atypical antipsychotics olanzapine (Zyprexa) and risperidone (Risperdal) and the antiepileptic gabapentin (Neurontin). Although 3 of these 4 drugs appear on the national top 20 drug list for dollar sales, none appears on the top 20 drug list for prescriptions dispensed. This disparity reflects the very high cost of these drugs and the dissimilarity between Medicaid populations and national samples.
In Medicaid, prescription drug expenditures are disproportionately spent for certain groups. Approximately 80% of Medicaid drug expenditures nationally are spent for the blind, disabled, or elderly, even though these groups make up 26% of Medicaid enroll-ees.5,9 In North Carolina in 1999, persons who were blind, disabled, or elderly made up 33% of Medicaid enrollees and were responsible for 83% of prescription drug expenditures. Although our findings may be generalizable to other Medicaid programs that have unrestricted formularies, they may not be generalizable to programs with restricted formularies or those serving non-Medicaid populations. Our study is limited in that we did not adjust the rates of prescribing for disease prevalence and severity, and using visit rates and complexities as proxies has limitations. Because substantial flux exists among those who are enrolled in Medicaid throughout a year, prescribing may be increased for those with new prescription drug coverage. Although this phenomenon may contribute to the findings, the influence would be modest on each year based on the low rates of new visits and average lengths of enrollment exceeding 9 months per year, and it would not explain differences among the years based on the stability of these measures. In addition, our calculation of costs for Medicaid did not take into account manufacturer rebates or discounts, and we did not evaluate inpatient use.
Although the results of our study can serve as a benchmark top 20 for other Medicaid programs, their major contribution is to generate hypotheses about the quality of prescribing and care for this population. What is prescribed is ultimately at the discretion of the clinician, who has to consider carefully the cost-benefit ratio of the possible treatments for every patient. Physicians might believe that the newer, more expensive drugs offer advantages over older, less expensive drugs, such as more convenient dosing, fewer adverse effects, and improved efficacy. Therapy with these newer drugs can reduce rates of symptoms, outpatient visits, and complications requiring hospitalizations; however, for most of these drugs, improved cost-effectiveness has not been shown.10 The rise in prescription expenditures needs to be compared with other health care savings. Increased prescribing in some cases is desirable, such as the use of β-blockers and warfarin by patients who have a history of myocardial infarction and atrial fibrillation, respectively. Some prescribing patterns, however, are neither cost-effective nor evidence based.
Many clinicians prescribe certain medications with the goal of providing high-quality care; however, clinicians may be uninformed or misinformed. For example, amlodipine (Norvasc) is being prescribed at a frequency comparable to that of other antihypertensive medications, which suggests that Norvasc is often being used as a first-line agent; however, evidence does not support using calcium channel blockers in this manner.11 A putative reason for the widespread use of Norvasc is pharmaceutical marketing. Direct-to-consumer advertising and physician detailing have been shown to affect prescribing patterns.12 Some of the drugs with the greatest expenditures in this study, particularly those that were new and expensive, are among those with the largest marketing budgets.5 Vioxx, Prilosec, Claritin, Paxil, and simvastatin (Zocor) were the 5 drugs with the greatest spending on direct-to-consumer advertising in 2000 in the United States. A total of $551 million was spent on direct-to-consumer advertising and was associated with an 87% average increase in sales rates, corresponding to a total increase in sales for the 5 drugs of $2.7 billion.13 Direct-to-consumer advertising represented 16% of promotional spending, with hospital detailing, physician’s office detailing, and samples accounting for 5%, 26%, and 50%, respectively.13 Pharmaceutical marketing affects not only physicians and patients but also the physician-patient relationship.14 Physicians are influenced by marketing, and they may be more likely to prescribe those products in unrestricted formularies, such as formularies in Medicaid programs.
There is an important role for many of the newer and more expensive medications, but that role must be better defined and followed. One challenge for physicians is balancing caring for individuals and for populations. This study is one of a population, but physicians mostly care for populations one individual at a time. Additional research is needed on the cost-effectiveness of medications, but in the meantime, clinicians can make more of an effort to prescribe appropriately and judiciously.
Disclaimer
The authors of this report are responsible for its content. Statements in the report should not be construed as endorsement by the Agency for Healthcare Research and Quality or the US Department of Health and Human Services of a particular drug, treatment, or other clinical service.
Acknowledgments
The majority of the work was completed while Dr. Fink was participating in the Robert Wood Johnson Clinical Scholars Program at the University of North Carolina at Chapel Hill.
Footnotes
-
Conflicts of interest: none reported
- Received for publication September 16, 2003.
- Revision received December 2, 2003.
- Accepted for publication December 24, 2003.
- © 2004 Annals of Family Medicine, Inc.


