
Article Figures & Data
Figures
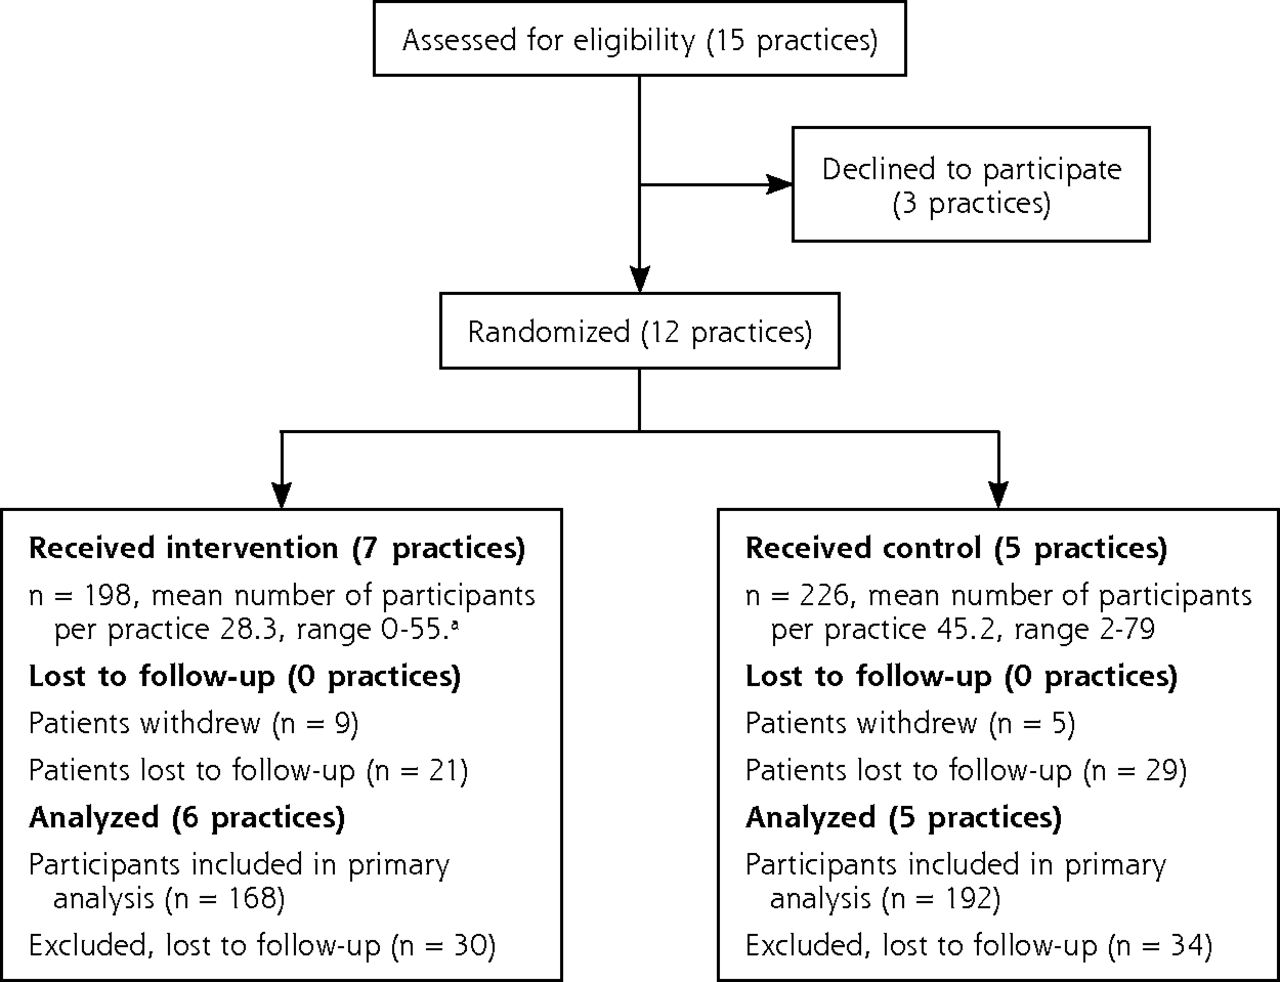
- Figure 1
Consort diagram.
Note: For purposes of analysis, the terms “practices” and “communities” are used interchangeably. As detailed in Andreae, et al,17 we initially recruited at the participating practices but had to expand into the surrounding communities to meet recruitment targets. Each community in the study corresponded to a single recruited practice, but participants living in that community could have a doctor in any primary care practice, not just the practices recruited for the study. As can be seen in the figure, not all primary care practices we approached agreed to participate.
a1 practice had 0 participants enrolled.
- Figure 2
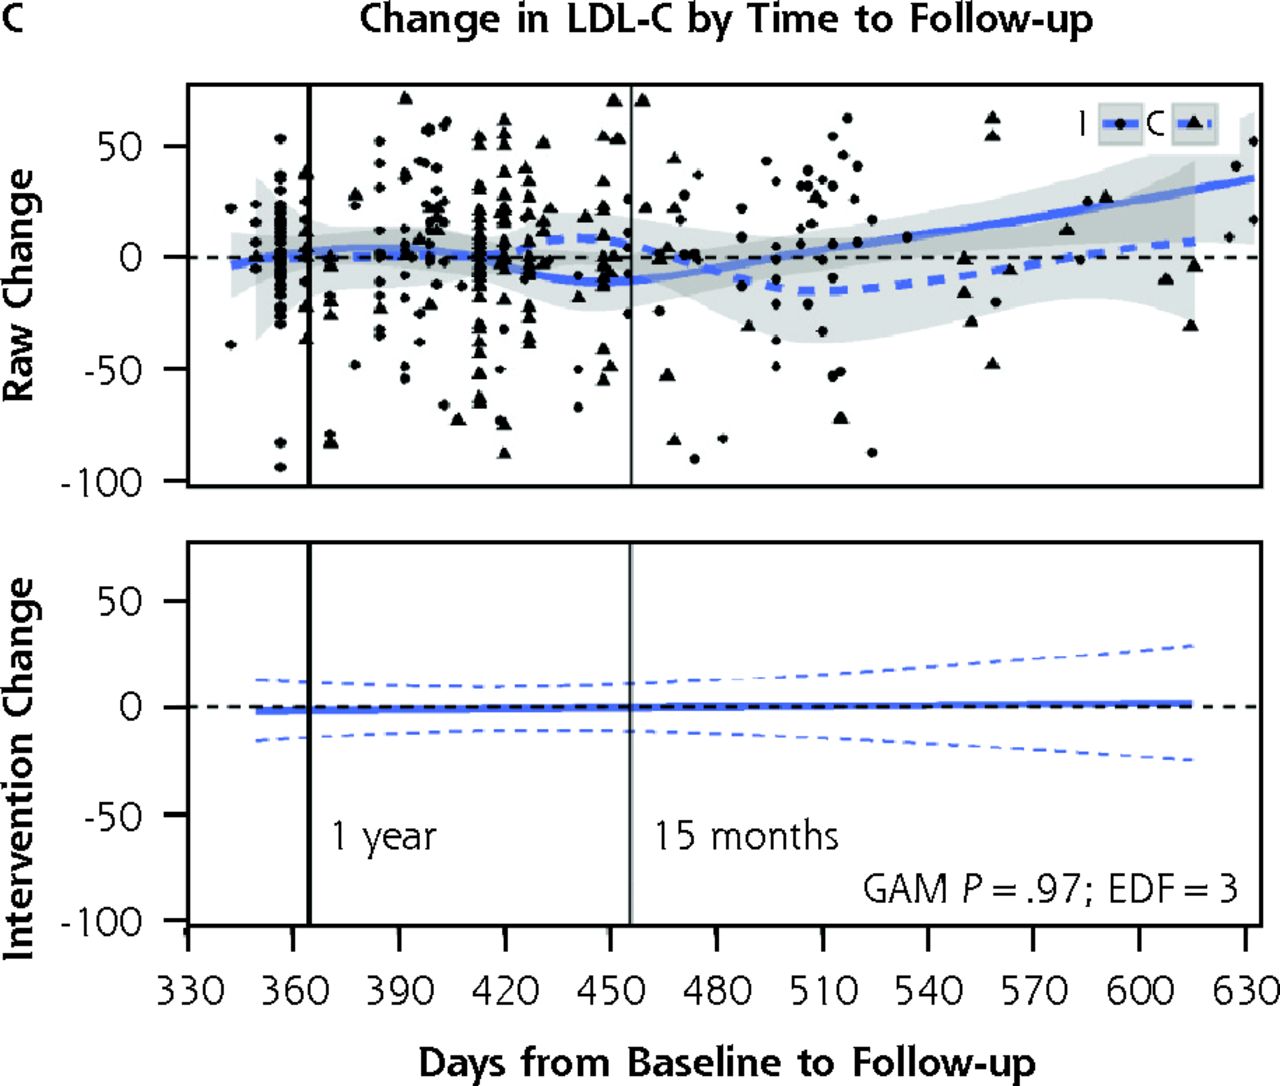
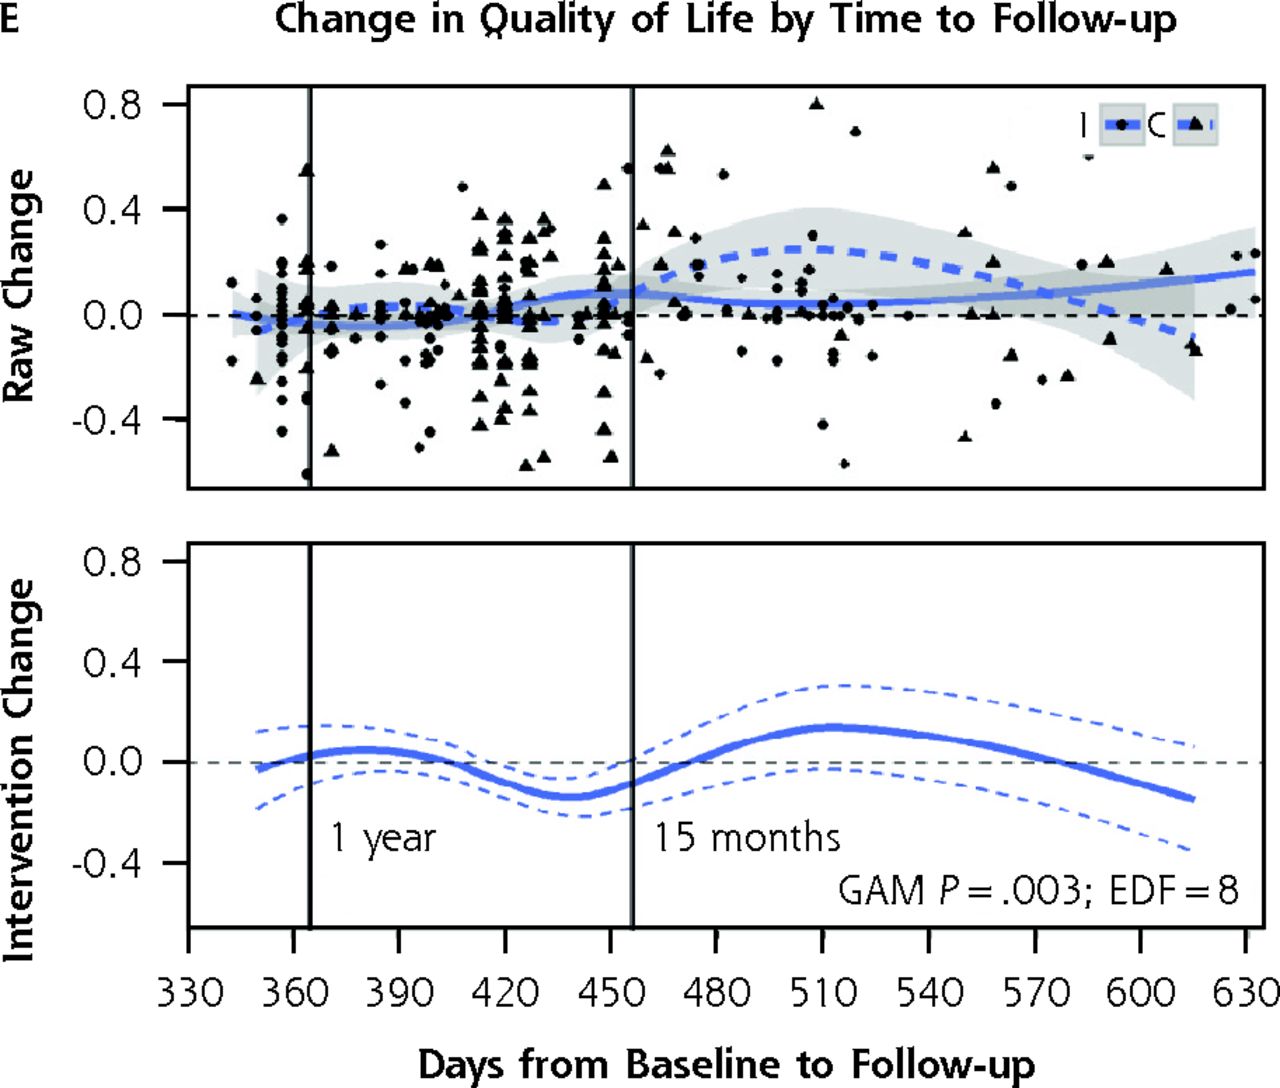
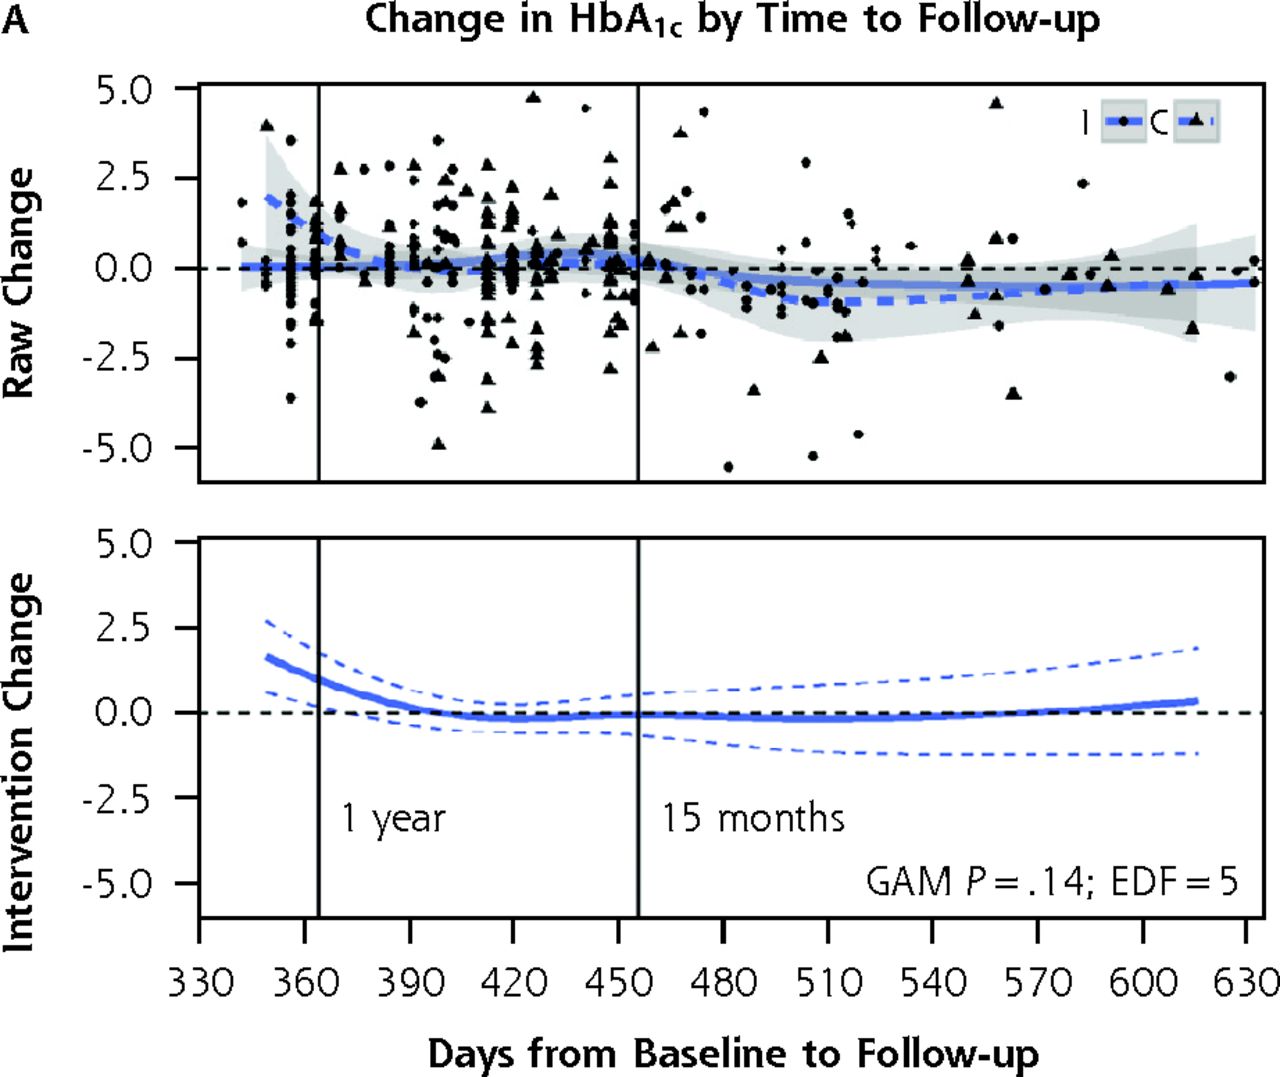
A–E. Control-intervention arm differences in change in primary outcome measures for all study participants, showing raw change scores (top of each panel) and change scores from generalized additive models adjusting for differences in time from baseline to follow-up, season, baseline value, clustering, education, and race.
Note: In each panel, the top graph presents the raw change scores for each participant, with circles and solid lines signifying control arm and triangles and dotted lines signifying intervention arm. The x axis shows the time in days between baseline and follow-up. Vertical lines show the 12 and 15-month follow-up points. The bottom graph in each panel presents the differences between intervention and control change scores from generalized additive mixed models with p-values from tests of statistical significance of the difference between control and intervention arms. See the article text as well.
BMI = body mass index; BP = blood pressure; EDF = estimated degrees of freedom; GAMM = generalized additive mixed models; LDL-C = low density lipoprotein cholesterol.
- Figure 3
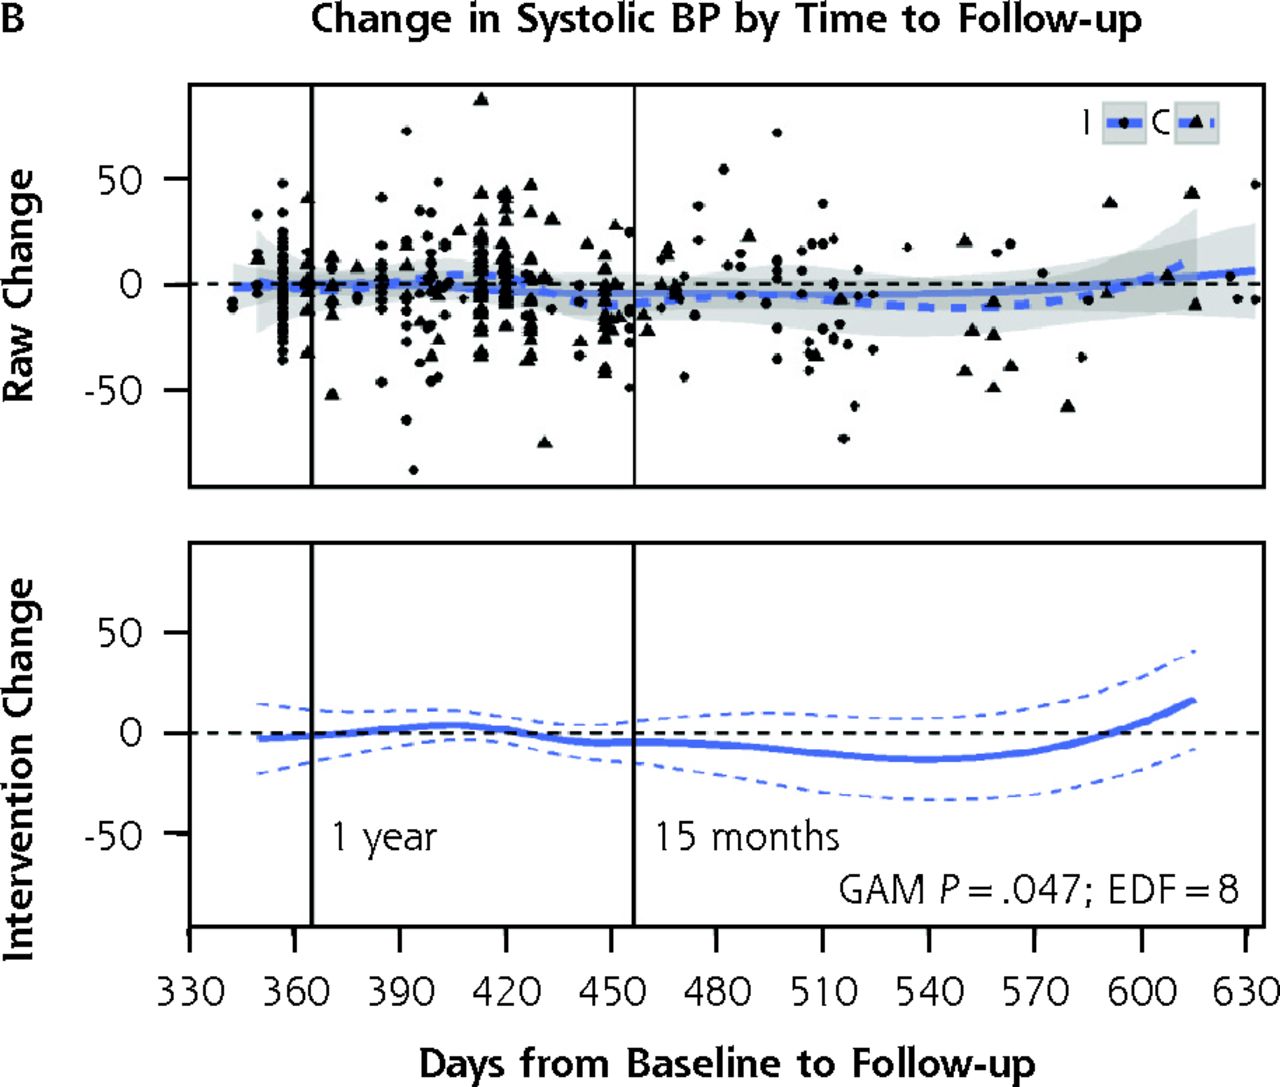
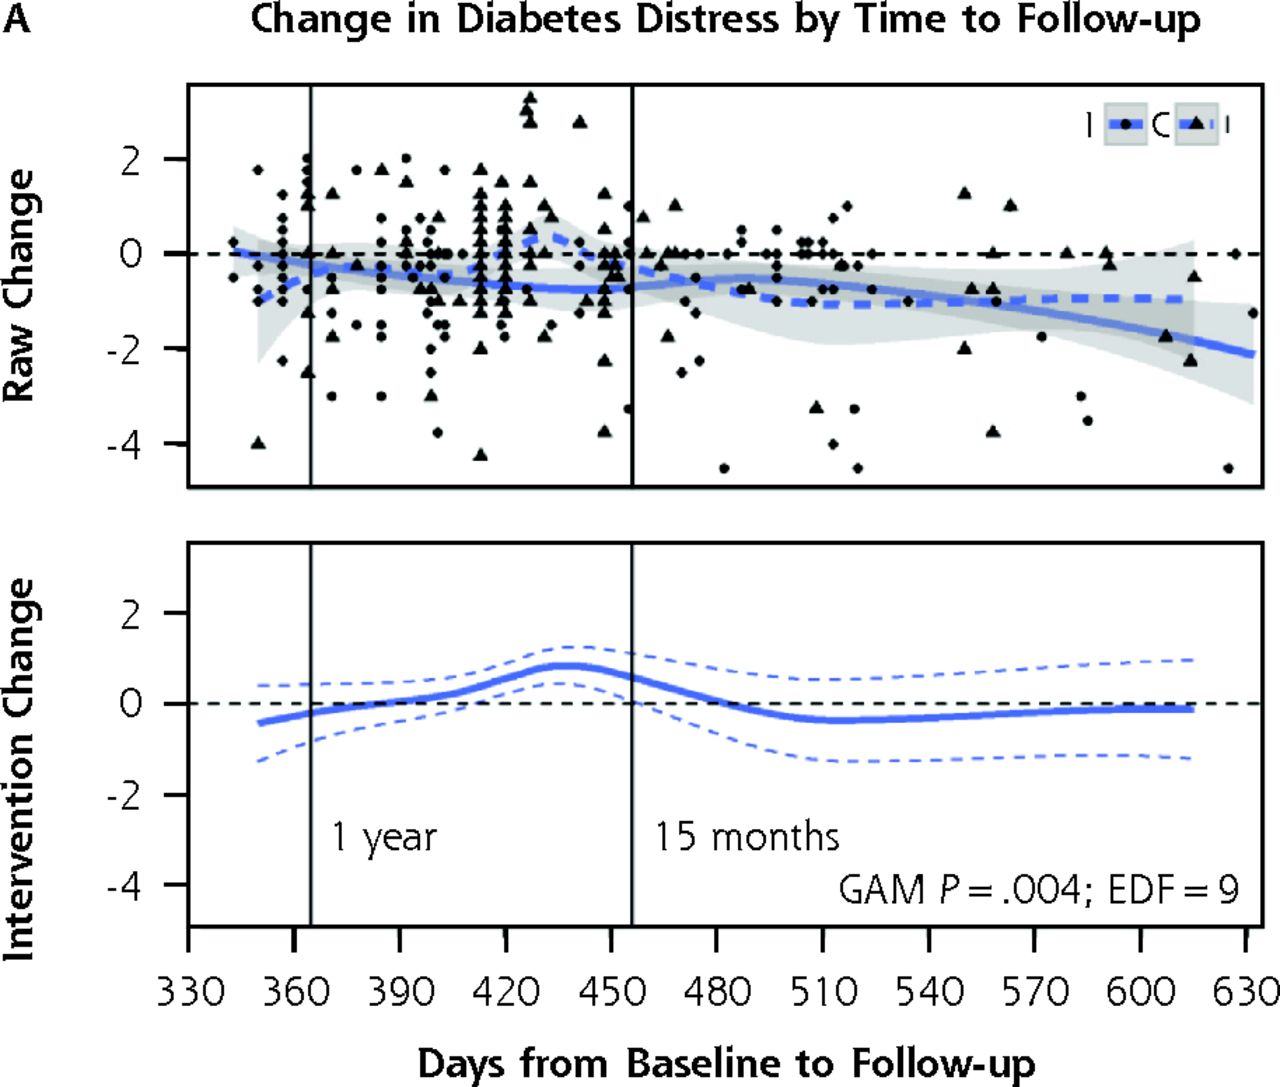
A and B. Control-intervention arm differences in change in secondary outcome measures for all study participants by study arm showing raw change scores (top of each panel) and change scores from generalized additive models adjusting for differences in time from baseline to follow-up, season, baseline value, clustering, education, and race.
EDF= estimated degrees of freedom; GAMM = generalized additive mixed models.
In each panel, the top graph presents the raw change scores for each participant with circles and solid lines signifying control arm and triangles and dotted lines signifying intervention arm. The x axis shows the time in days between baseline and follow-up. Vertical lines show the 12 and 15-month follow-up points. The bottom graph in each panel presents the differences between intervention and control change scores from generalized additive models with p-values from tests of statistical significance between control and intervention arms. See the article text as well.


Tables
All (N = 360)a Control (n = 192) Intervention (n = 168) P valueb Age, mean (SD), y 60.2 (12.1) 61.1 (12.4) 59.2 (11.8) .14 Female, No. (%) 271 (75.3) 140 (72.9) 131 (78.0) .32 Blacks, No. (%) 313 (87.4) 155 (81.2) 158 (94.6) <.001 Education, No. (%) ≤High school 111 (31.2) 58 (30.5) 53 (31.9) .05 High school graduate 151 (42.4) 72 (37.9) 79 (47.6) Some college, college graduate 94 (26.4) 60 (31.6) 34 (20.5) Annual household income, No. (%) ≥$40,000 32 (8.9) 22 (11.5) 10 (6.0) .10 <$40,000 293 (81.4) 155 (80.7) 138 (82.1) Declined to report 35 (9.7) 15 (7.8) 20 (11.9) Number of medications, mean (SD) 7.7 (4.0 7.9 (4.0 7.5 (4.0 .26 Adherent to medications, No. (%)c 189 (52.5) 106 (55.2) 83 (49.4) .33 Treated with insulin, No. (%) 142 (39.4) 75 (39.1) 67 (39.9) .99 Baseline hemoglobin A1c, mean (SD), % 7.9 (2.0) 7.9 (1.9) 8.0 (2.1) .56 Baseline body mass index, mean (SD), kg/m2 36.3 (8.5) 36.0 (9.1) 36.5 (7.7) .57 Baseline systolic blood pressure, mean (SD), mm Hg 135.2 (21.4) 135.8 (21.2) 134.6 (21.7) .61 Baseline LDL-C, mean (SD), mg/dL 110.6 (38.2) 111.6 (38.8) 109.4 (37.6) .59 Baseline quality of life score, mean (SD)d 0.76 (0.2) 0.78 (0.2) 0.74 (0.2) .03 Baseline diabetes distress score,* mean (SD)e 2.1 (1.2) 2.1 (1.2) 2.1 (1.2) .92 Baseline activation score,* mean (SD)f 27.8 (6.1) 28.0 (6.7) 27.5 (5.3) .51 LDL-C = low density lipoprotein cholesterol; SD = standard deviation.
↵a Includes all participants who provided both baseline and follow-up data.
↵b P-values were derived from χ2 tests for categorical variables and t-tests for continuous variables.
↵c We assessed medication adherence using the 4-item Morisky scale (dichotomized as adherent or not).
↵d We assessed quality of life using the EuroQol 5D (range 0–1.0).
↵e We assessed diabetes distress using the Diabetes Distress Scale (range 1–6, with scores ≥3 indicative of moderate or greater distress).
↵f We assessed activation using the Patient Activation Measure (range 13–57).
- Table 2
Mean Changes in Primary Study Outcomes from Baseline to Follow-up for Participants Followed Up Within 15 Months, by Treatment Arm
Outcome Intervention (n = 138) Control (n = 130) P valuea Hemoglobin A1c, mean (SD), % −0.004 (1.5) 0.070 (1.3) .68 Body mass index, mean (SD), kg/m2 −0.23 (2.4) −0.49 (2.8) .44 Systolic blood pressure, mean (SD), mm Hg −0.41 (21.3) −1.88 (22.8) .59 LDL-C, mean (SD), mg/dL 3.40 (31.5) −0.18 (31.3) .35 Quality of life score, mean (SD)b −0.006 (0.2) −0.017 (0.2) .63 Diabetes distress score, mean (SD)c −0.13 (1.2) −0.29 (1.1) .26 Activation score, mean (SD)d 2.64 (7.4) 0.69 (7.0) .04 LDL-C = low density lipoprotein cholesterol; SD = standard deviation.
↵a P values are for intervention compared with control group mean values, adjusted for clustering and for education, which was imbalanced at baseline across treatment arms. P-values were derived from χ2 tests for categorical variables and t-tests for continuous variables.
↵b We assessed quality of life using the EuroQol 5D (range 0–1.0).
↵c We assessed diabetes distress using the Diabetes Distress Scale (range 1–6 with scores ≥3 indicative of moderate or greater distress).
↵d We assessed activation using the Patient Activation Measure (range 13–57).
Supplemental Appendixes
Supplemental Appendixes
Files in this Data Supplement:


Jump to section
Related Articles
Cited By...
- Virtual Group Pulmonary Rehabilitation in COPD Facilitated by a Peer Coach
- Peer-Delivered Cognitive Behavioral Training to Improve Functioning in Patients With Diabetes: A Cluster-Randomized Trial
- Impact of Peer Support on Acute Care Visits and Hospitalizations for Individuals With Diabetes and Depressive Symptoms: A Cluster-Randomized Controlled Trial
- Delivery of Health Coaching by Medical Assistants in Primary Care
- Peer Support Interventions for Adults With Diabetes: A Meta-Analysis of Hemoglobin A1c Outcomes
- Challenges of Prolonged Follow-up and Temporal Imbalance in Pragmatic Trials: Analysis of the ENCOURAGE Trial
- Challenges in the Ethical Review of Peer Support Interventions