
Article Figures & Data
Figures
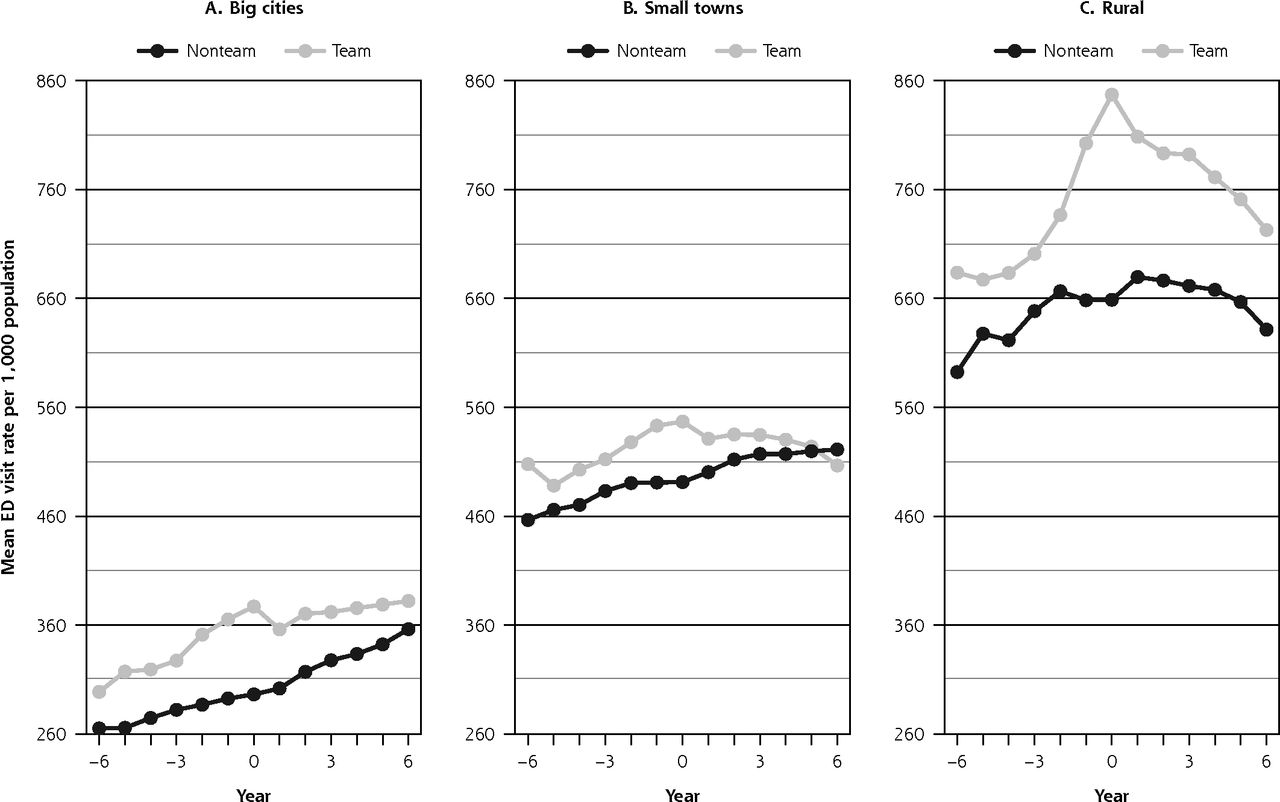
- Figure 1.
Unadjusted mean ED visit rate before and after transition to a capitation model with vs without team care, stratified by rurality.
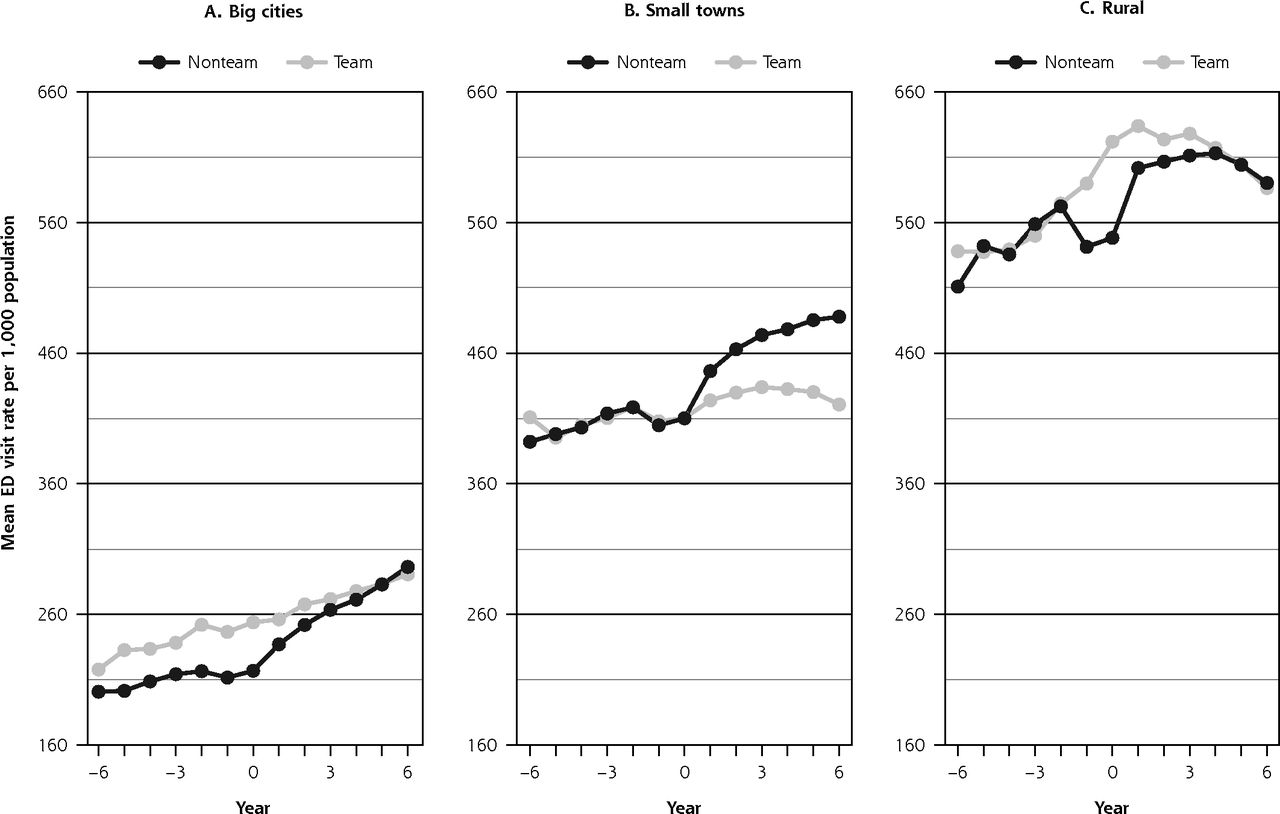
- Figure 2.
Adjusted mean ED visit rate before and after transition to a team vs nonteam capitation model, stratified by rurality.

Tables
- Table 1.
Characteristics of Patients Enrolled With Physicians Who Transitioned to Team Capitation and Nonteam Capitation Between 2007 and 2013, Stratified by Rurality
Big Cities Small Towns Rural Areas Characteristic Total (N = 2,524,124) Team (n = 387,607) Nonteam (n = 1,399,103) Team (n = 213,394) Nonteam (n = 380,009) Team (n = 65,289) Nonteam (n = 78,722) Age, mean (SD), y 48.8 (17.3) 46.9 (17.4) 48.6 (17.3) 50.1 (17.4) 49.8 (17.2) 50.5 (17.3) 50.6 (17.0) Age group, No. (%) 19-44 years 1,064,120 (42.2) 185,101 (47.8) 598,969 (42.8) 82,145 (38.5) 146,004 (38.4) 24,147 (37.0) 27,754 (35.3) 45-64 years 967,324 (38.3) 135,925 (35.1) 531,538 (38.0) 85,103 (39.9) 154,357 (40.6) 26,514 (40.6) 33,887 (43.0) ≥65 years 492,680 (19.5) 66,581 (17.2) 268,596 (19.2) 46,146 (21.6) 79,648 (21.0) 14,628 (22.4) 17,081 (21.7) Female, No. (%) 1,392,513 (55.2) 223,637 (57.7) 770,943 (55.1) 117,335 (55.0) 203,019 (53.4) 36,163 (55.4) 41,416 (52.6) Morbidity, No. (%) 0 RUB (none) 83,116 (3.3) 9,432 (2.4) 48,766 (3.5) 6,661 (3.1) 13,594 (3.6) 1,712 (2.6) 2,951 (3.7) 1 RUB 117,770 (4.7) 16,954 (4.4) 65,169 (4.7) 9,620 (4.5) 19,236 (5.1) 2,941 (4.5) 3,850 (4.9) 2 RUB 397,301 (15.7) 60,932 (15.7) 217,742 (15.6) 32,934 (15.4) 62,304 (16.4) 10,315 (15.8) 13,074 (16.6) 3 RUB 1,409,699 (55.8) 216,123 (55.8) 787,492 (56.3) 117,291 (55.0) 209,203 (55.1) 35,778 (54.8) 43,812 (55.7) 4 RUB 393,209 (15.6) 64,734 (16.7) 215,365 (15.4) 34,597 (16.2) 56,496 (14.9) 10,831 (16.6) 11,186 (14.2) 5 RUB (high) 123,029 (4.9) 19,432 (5.0) 64,569 (4.6) 12,291 (5.8) 19,176 (5.0) 3,712 (5.7) 3,849 (4.9) Comorbidity, No. (%) No health care use 83,132 (3.3) 9,434 (2.4) 48,775 (3.5) 6,662 (3.1) 13,597 (3.6) 1,713 (2.6) 2,951 (3.7) 1-4 ADG (low) 1,034,648 (41.0) 156,831 (40.5) 556,057 (39.7) 91,078 (42.7) 165,481 (43.5) 28,966 (44.4) 36,235 (46.0) 5-9 ADG 1,139,347 (45.1) 178,458 (46.0) 639,695 (45.7) 93,927 (44.0) 165,313 (43.5) 28,617 (43.8) 33,337 (42.3) ≥10 ADG (high) 266,997 (10.6) 42,884 (11.1) 154,576 (11.0) 21,727 (10.2) 35,618 (9.4) 5,993 (9.2) 6,199 (7.9) Recent immigration (past 10 years), No. (%) 141,617 (5.6) 29,229 (7.5) 98,386 (7.0) 4,060 (1.9) 7,281 (1.9) 1,016 (1.6) 1,645 (2.1) Income quintile, No. (%) Q1 (lowest) 401,788 (15.9) 69,877 (18.0) 227,491 (16.3) 31,298 (14.7) 45,227 (11.9) 14,963 (22.9) 12,932 (16.4) Q2 455,529 (18.0) 70,199 (18.1) 252,220 (18.0) 36,878 (17.3) 62,199 (16.4) 15,838 (24.3) 18,195 (23.1) Q3 490,449 (19.4) 73,231 (18.9) 264,609 (18.9) 44,084 (20.7) 79,038 (20.8) 14,047 (21.5) 15,440 (19.6) Q4 558,640 (22.1) 84,190 (21.7) 298,542 (21.3) 51,299 (24.0) 98,129 (25.8) 10,573 (16.2) 15,907 (20.2) Q5 (highest) 609,691 (24.2) 89,012 (23.0) 353,507 (25.3) 49,299 (23.1) 94,818 (25.0) 8,651 (13.3) 14,404 (18.3) Missing 8,027 (0.3) 1,098 (0.3) 2,734 (0.2) 536 (0.3) 598 (0.2) 1,217 (1.9) 1,844 (2.3) Year of transition, No. (%) 2006-2007 134,819 (5.3) 56,707 (14.6) 589 (0.0) 54,684 (25.6) 205 (0.1) 22,594 (34.6) 40 (0.1) 2007-2008 339,919 (13.5) 95,676 (24.7) 113,226 (8.1) 38,020 (17.8) 64,554 (17.0) 10,736 (16.4) 17,707 (22.5) 2008-2009 731,873 (29.0) 75,870 (19.6) 422,253 (30.2) 38,896 (18.2) 152,336 (40.1) 8,287 (12.7) 34,231 (43.5) 2009-2010 461,777 (18.3) 48,807 (12.6) 288,494 (20.6) 22,450 (10.5) 79,893 (21.0) 4,602 (7.0) 17,531 (22.3) 2010-2011 400,493 (15.9) 33,111 (8.5) 278,884 (19.9) 30,941 (14.5) 45,492 (12.0) 8,075 (12.4) 3,990 (5.1) 2011-2012 336,868 (13.3) 54,795 (14.1) 220,486 (15.8) 21,703 (10.2) 28,312 (7.5) 8,393 (12.9) 3,179 (4.0) 2012-2013 118,375 (4.7) 22,641 (5.8) 75,171 (5.4) 6,700 (3.1) 9,217 (2.4) 2,602 (4.0) 2,044 (2.6) ADG = adjusted diagnosis groups; Q = quintile; RUB = resource utilization band.
- Table 2.
Change in Annual ED Visit Rate With Transition to Capitation, Team vs Nonteam, Stratified by Rurality
Measure Big Cities Small Towns Rural Areas Team Nonteam Team Nonteam Team Nonteam Trend in annual rate before transition, % (95% CI) 2.3 1.5 0.7 1.1 2.3 1.6 (2.1 to 2.5) (1.4 to 1.6) (0.4 to 0.9) (0.9 to 1.2) (1.8 to 2.7) (1.2 to 1.9) Trend in annual rate after transition, % (95% CI) 2.4 5.2 0.9 2.9 –0.5 1.3 (2.2 to 2.6) (5.1 to 5.3) (0.7 to 1.1) (2.8 to 3.1) (–0.8 to 0.2) (1.0 to 1.6) Change in trend, % (95% CI) –0.7 –2.2 0.2 –0.5 7.8 0.9 (–14.8 to 0.1) (–2.6 to 1.7) (–0.7 to 1.2) ( –1.1 to 0.2) (6.0 to 9.5) ( –0.5 to 2.3) Difference between groups in post-transition rate trend,a % 2.9 2.1 1.8 P value <.001 <.001 <.001 ED = emergency department.
aNonteam minus team.
Note: Adjusted for patient’s age, sex, neighborhood income quintile, recent immigration, comorbidity, and morbidity.
Supplemental materials in pdf file below
Supplemental Figure 1. Selection of patients whose physician transitioned to team-based capitation and patients whose physician transitioned to non-team capitation between 2007 and 2013, Ontario, Canada.
Supplemental Table 1. Select characteristics of patients whose physician transitioned to team-based capitation and matched patients whose physician transitioned to non-team capitation between 2007 and 2013, stratified by rurality, Ontario, Canada.
Supplemental Figure 2. Details on the negative binomial regression modeling
Supplemental Table 2. Number of Ontario residents included in denominator by year for the unmatched and matched analysis
Supplemental Table 3. Change in emergency department visit rate after transition to capitation, team-based versus non-team for matched data, 2007 – 2013, stratified by rurality, Ontario, Canada.
Supplemental Figure 3. Mean emergency department visit rate before and after transition to a capitation-based primary care model between 2007 - 2013, with a team or without a team for matched data, stratified by rurality, Ontario, Canada.
- Kiran.pdf -
PDF file
- Kiran.pdf -


Jump to section
Related Articles
Cited By...
- Convenience or Continuity: When Are Patients Willing to Wait to See Their Own Doctor?
- Public experiences and perspectives of primary care in Canada: results from a cross-sectional survey
- Walk-in clinic patient characteristics and utilization patterns in Ontario, Canada: a cross-sectional study
- Garder la porte dentree ouverte : assurer lacces aux soins primaires a toute la population canadienne
- Keeping the front door open: ensuring access to primary care for all in Canada
- Are primary care virtual visits associated with higher emergency department use? A cross-sectional analysis from Ontario, Canada