
Article Figures & Data
Tables
Characteristic Total
(N = 45,279)Location P Value Rural
(n = 24,637)Urban
(n = 20,642)Age, mean (SD), y 65.7 (14.0) 65.8 (13.9) 65.6 (13.9) .20a Female, No. (%) 20,735 (45.8) 11,433 (46.4) 9,302 (45.1) .004b Race, No. (%) <.001b White 41,887 (92.5) 23,195 (94.2) 18,692 (90.6) Non-White 3,369 (7.5) 1,427 (5.8) 1,942 (9.4) ACG risk score, mean (SD)c 1.1 (0.96) 1.1 (0.96) 1.1 (0.97) .91a Insurance, No. (%) <.001b Commercial 12,034 (26.6) 6,119 (24.9) 5,915 (28.7) Medicaid 3,470 (7.7) 1,961 (8.0) 1,509 (7.3) Medicare 28,069 (62.1) 15,533 (63.2) 12,536 (60.8) Other 1,616 (3.6) 965 (3.9) 651 (3.2) Missing 90 (0.2) 59 (0.2) 31 (0.2) Number of outpatient visits, mean (SD) 3.5 (4.39) 3.2 (4.04) 3.9 (4.75) <.001a Visits, No. (%) Diabetes education 7,844 (17.3) 4,325 (17.6) 3,519 (17.0) .16b Nutrition 2,449 (5.4) 1,350 (5.5) 1,099 (5.3) .47b Endocrinology 3,257 (7.2) 1,347 (5.5) 1,928 (9.3) <.001b Primary care clinician type, No. (%) <.001b Advanced practice provider 8,170 (18.0) 6,289 (25.5) 1,881 (9.1) Physician 36,356 (80.3) 18,192 (73.8) 18,164 (88.0) Resident or fellow 743 (1.6) 152 (0.6) 591 (2.9) Other 10 (<0.1) 4 (<0.1) 6 (<0.1) D5 Metric Total, No. (%)
(N = 45,279)Location P
ValueaRural, No. (%)
(n = 24,637)Urban, No. (%)
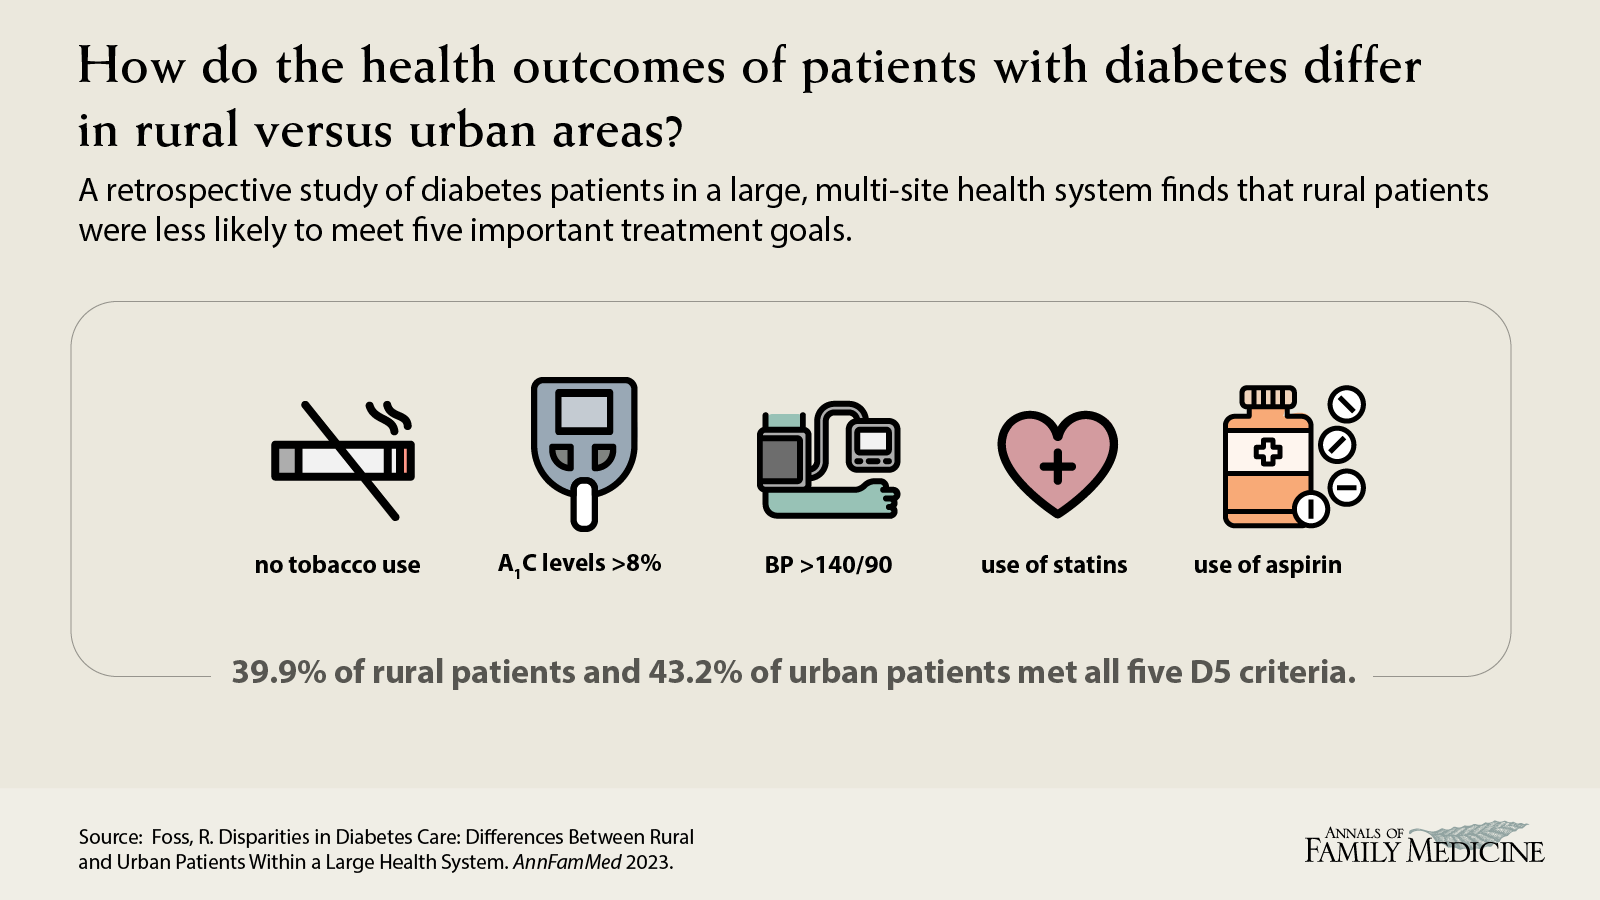
(n = 20,642)Component goals met Antiplatelet medication use as indicated 44,740 (98.8) 24,337 (98.8) 20,403 (98.8) .56 Blood pressure <140/90 mm Hg 34,299 (75.8) 18,553 (75.3) 15,746 (76.3) .02 A1c level <8.0% 31,364 (69.3) 16,924 (68.7) 14,440 (70.0) .004 LDL cholesterol level at goal or statin prescribed 38,576 (85.2) 20,722 (84.1) 17,854 (86.5) <.001 No tobacco use 37,754 (83.4) 20,316 (82.5) 17,438 (84.5) <.001 All 5 goals met 18,752 (41.4) 9,842 (39.9) 8,910 (43.2) <.001 A1c = glycated hemoglobin; D5 = diabetes 5-item composite metric; LDL = low-density lipoprotein.
↵a From Kruskal-Wallis analysis.
Characteristic Adjusted Odds
Ratio (95% CI)aP
ValueRural vs urban 0.93 (0.88-0.97) .003 Female vs male 1.08 (1.03-1.12) .001 Increasing age, per 10 years 1.22 (1.10-1.02) <.001 ACG risk score <1 vs ≥1 1.19 (1.13-1.25) <.001 Diabetes education visit vs none 0.92 (0.87-0.97) .004 Nutrition visit vs none 1.06 (0.97-1.16) .17 Endocrinology visit vs none 0.80 (0.73-0.86) <.001 Increasing outpatient visits, per 1 visit 1.03 (1.03-1.04) <.001 Insurance Commercial (reference group) 1.00 … Medicaid 0.58 (0.53-0.63) <.001 Medicare 1.17 (1.10-1.24) <.001 Other 0.97 (0.87-1.09) .63 Non-White vs White 0.83 (0.77-0.90) <.001 APP vs physicianb 0.94 (0.87-1.02) .12 ACG = adjusted clinical group; APP = advanced practice provider; D5 = diabetes 5-item composite metric.
Notes: Results of the generalized linear mixed model. D5 is a set of 5 treatment goals for diabetes developed by the Minnesota Community Measurement to represent the gold standard for managing diabetes.
↵a An odds ratio greater than 1 indicates that the first characteristic listed is associated with higher odds of meeting the D5 metric. All characteristics shown have been adjusted for in the same model as fixed effects; site and primary care clinician type were random effects in the model.
↵b Physician includes residents and fellows.
Additional Files
VISUAL ABSTRACT IN PNG FILE BELOW
- 21.3_Foss_v06.png -
PNG file
- 21.3_Foss_v06.png -


