
Article Figures & Data
Figures
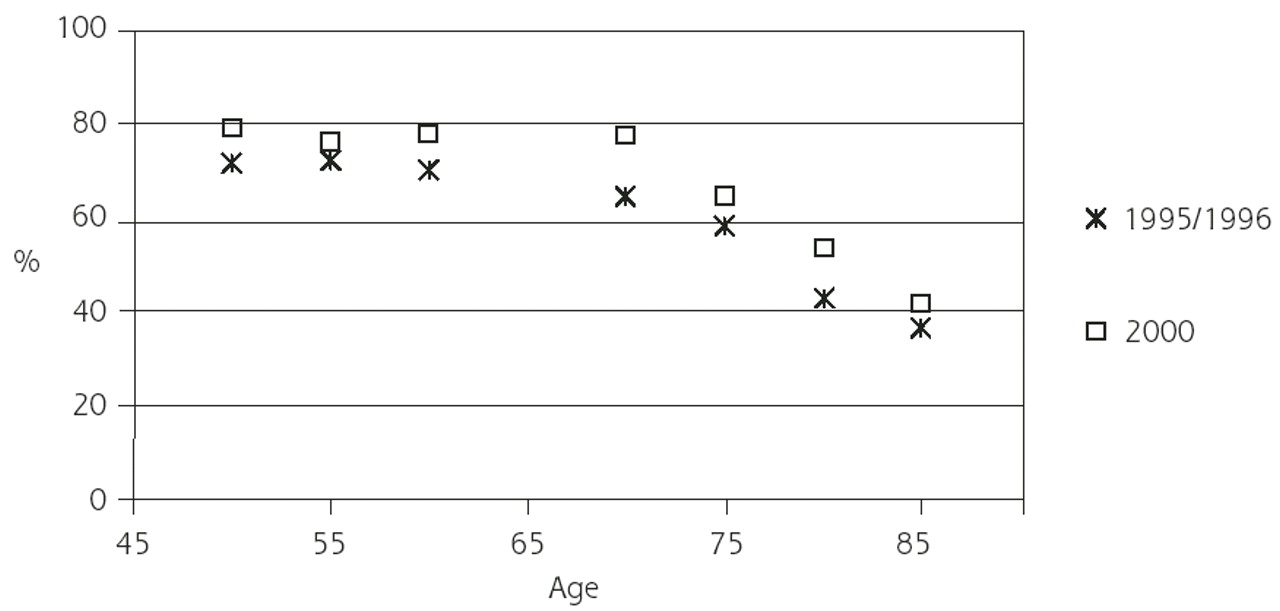
- Figure 1.
Mammography: proportion (weighted) reported screening in the last 2 years, by age-group and year.
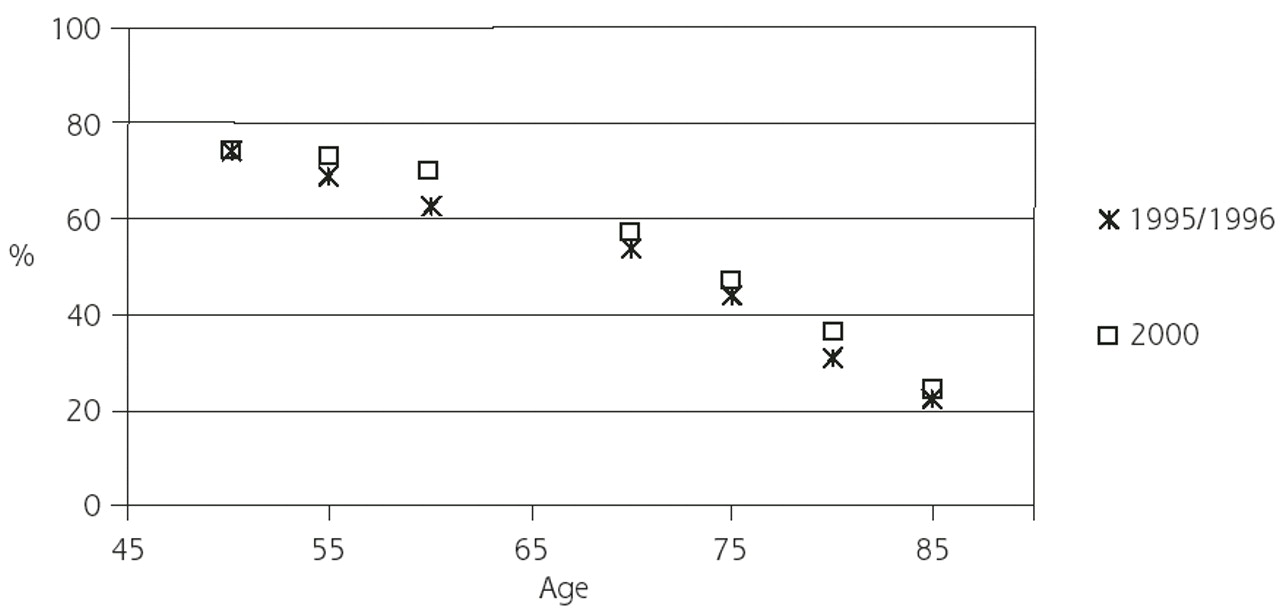
- Figure 2.
Cervical cancer: proportion (weighted) reported screening in the last 2 years, by age-group and year.


Tables
- Table 1.
Receipt of Preventive Services by Survey Wave in Selected Subgroups (Weighted Percentages)
HRS AHEAD Pap Test Mammogram Pap Test Mammogram Variables 1996n=4,370 2000n=4,854 1996n=4,370 2000n=4,854 1995n=3,818 2000n=3,040 1995n=3,818 2000n=3,040 Pap = Papanicolaou; HRS = Health and Retirement Study; AHEAD = Asset and Health Dynamics Among the Oldest Old. * Income categories: HRS – 1996: 1, ≤ $13,000; 2, $13,001-$31,600; 3, $31,601-$58,269; 4, > $58,269. 2000: 1, ≤ $8,295; 2, $8,296-$20,420; 3, $20,421-$49,504; 4, >$49,504. AHEAD – 1995: 1, ≤ $10,560; 2, $10,561-$18,000; 3, $18,001-$30,000; 4, > $30,000. 2000: 1, ≤ $8,400; 2, $8,401-$12,000; 3, $12,001-$18,840; 4, > $18,840. † Subjective life expectation: HRS: “(What is the percent chance) that you will live to be 75 or more?” AHEAD: “(Using a number from 0 to 100) what do you think are the chances that you will live another 5 years?” Demographic Age, years 50–54 74 74 72 79 – – – – 55–59 69 73 72 76 – – – – 60–64 63 70 71 78 – – – – 70–74 – – – – 54 57 65 77 75–79 – – – – 44 47 59 65 80–84 – – – – 31 36 43 54 85–89 – – – – 23 25 37 42 White 68 70 72 77 42 43 54 62 Black 68 70 73 78 47 44 57 58 Socioeconomic Completed high school 71 72 76 80 46 48 61 68 Not completed high school 57 60 60 69 35 35 44 49 Born in the United States 68 70 72 77 42 44 54 62 Born abroad 70 68 71 77 38 43 50 61 Married 71 73 75 81 49 52 64 71 Not married 61 63 64 70 38 38 48 56 Income category* 1 58 65 59 73 35 34 44 49 2 65 64 69 73 42 41 54 58 3 70 69 76 77 44 47 58 67 4 80 80 85 87 50 51 63 71 Health Smokers 57 58 60 64 41 36 51 52 Non smokers 71 72 75 81 42 44 54 62 Less physical activity – 66 – 75 – 40 – 58 Vigorous exercise – 74 – 80 – 52 – 70 Health excellent, very good, good 70 72 73 79 45 46 56 64 Health poor or fair 60 63 66 72 36 38 50 57 Cognitively normal – – – – 44 44 57 64 Cognitively impaired – – – – 34 40 40 48 Subjective life expectation† 0%–33% 61 64 65 73 37 36 48 54 34%–66% 64 69 70 77 48 49 63 68 67%–100% 73 74 75 81 49 50 60 67 Health care Uninsured 46 49 44 52 – – – – Insured 71 71 75 80 – – – – No additional private insurance – – – – 37 43 45 62 Additional private insurance – – – – 43 61 57 74 Not in hospital last year 68 70 71 77 43 44 54 62 Hospitalized in the last year 64 66 73 78 39 42 53 61 0–2 physician visits last year 59 57 59 63 41 33 50 47 3–5 physician visits last year 73 75 78 82 44 44 56 62 6+ physician visits last year 72 74 78 82 42 46 57 66 - Table 2.
Adjusted Relative Odds of Receipt of Cancer Screening Services: Health and Retirement Study (HRS) Multivariate Models
Variables Pap TestFull ModelOR (95% CI)(n = 10,146)* MammogramFull ModelOR (95% CI)(n = 10,156)* Pap = Papanicolaou; OR = odds ratio; CI = confidence interval. * Number of observations in model. Most women contributed 2 observations: 1996 and 2000. A total of 5,942 answered at least 1 survey question once. † Reference categories: year = 1996; age = 50–54.9 years; race = white. ‡ Reference categories: education = not completed high school; birth place = born abroad; marital status = not married; income = category 4 (see footnote to Table 1). § Reference categories: smoking status = not smoking; exercise = less physical activity; health = excellent, very good, or good; subjective life expectations = 0%–33% (see footnote to Table 1). || Reference categories: health insurance = some health insurance; hospitalization in last year = not in hospital last year; physician visits in last year = 0–2 visits in last year. Demographic‡ Year 2000 0.96 (0.88–1.05) 1.22 (1.11–1.35) Age 55–59.9 years 0.97 (0.87–1.08) 1.17 (1.04–1.31) Age 60–64.9 years 0.87 (0.78–0.97) 1.18 (1.05–1.33) Black 1.38 (1.22–1.56) 1.37 (1.20–1.57) Socioeconomic‡ Completed high school 1.25 (1.13–1.40) 1.26 (1.12–1.41) Born in the United States 0.86 (0.74–1.00) 0.80 (0.68–0.94) Married 1.22 (1.10–1.35) 1.30 (1.17–1.45) Income category 1 0.63 (0.55–0.73) 0.55 (0.47–0.65) Income category 2 0.60 (0.52–0.68) 0.58 (0.50–0.67) Income category 3 0.69 (0.60–0.79) 0.64 (0.55–0.74) Health§ Smoking 0.70 (0.63–0.77) 0.58 (0.52–0.65) Vigorous exercise 1.25 (1.14–1.37) 1.12 (1.01–1.23) Poor or fair health 0.77 (0.69–0.87) 0.80 (0.70–0.91) Subjective life expectation 34%–66% 1.03 (0.91–1.16) 1.03 (0.90–1.17) Subjective life expectation 67%–100% 1.28 (1.14–1.44) 1.15 (1.01–1.23) Health care|| Uninsured 0.53 (0.46–0.61) 0.38 (0.34–0.44) In hospital in last year 0.88 (0.78–1.00) 0.98 (0.85–1.13) 3–5 physician visits in last year 1.90 (1.68–2.13) 2.15 (1.90–2.43) 6+ physician visits in last year* 2.11 (1.89–2.36) 2.54 (2.26–2.86) - Table 3.
Adjusted Relative Odds of Receipt of Cancer Screening Services: Asset and Health Dynamics Among the Oldest Old (AHDEAD) Multivariate Models
Variables Pap TestFull ModelOR (95% CI)(n = 6,330)* MammogramFull ModelOR (95% CI)(n = 6,347)* Pap = Papanicolaou; OR = odds ratio; CI = confidence interval. * Number of observations in model – most women contributed 2 observations: 1995 and 2000. A total of 4,543 women answered at least 1 survey question once. † Reference categories: year = 1995; age = 70–74.9 years; race = white. ‡ Reference categories: education = not completed high school; birth place = born abroad; marital status = not married; income = category 4 (see footnote to Table 1). § Reference categories: smoking status = not smoking; exercise = less physical activity; health = excellent–very good–or good; mental status = cognitively normal; subjective life expectation = 0%–33% (see footnote to Table 1). || Reference categories: health insurance = no other private insurance; hospitalization in last year = not in hospital last year; physician visits in last year = 0–2 physicians in last year. Demographic † Year 2000 0.91 (0.76–1.09) 1.11 (0.93–1.33) Age 75–79.9 years 0.84 (0.74–0.96) 0.93 (0.81–1.06) Age 80–84.9 years 0.54 (0.46–0.63) 0.61 (0.52–0.71) Age 85–89.9 years 0.41 (0.33–0.51) 0.46 (0.37–0.56) Black 1.58 (1.34–1.87) 1.57 (1.40–1.78) Socioeconomic ‡ Completed high school 1.37 (1.22–1.55) 1.58 (1.40–1.78) Born in the United States 0.83 (0.69–1.01) 0.67 (0.55–0.81) Married 1.32 (1.17–1.48) 1.30 (1.15–1.47) Income category 1 0.77 (0.65–0.90) 0.64 (0.54–0.75) Income category 2 0.82 (0.70–0.95) 0.74 (0.63–0.87) Income category 3 0.88 (0.76–1.02) 0.91 (0.78–1.07) Health § Smoking 0.77 (0.64–0.94) 0.74 (0.61–0.90) Vigorous exercise 1.36 (1.21–1.53) 1.32 (1.16–1.49) Poor or fair health 0.79 (0.70–0.89) 0.91 (0.80–1.03) Cognitive impairment 0.97 (0.79–1.18) 0.73 (0.60–0.88) Subjective life expectation 34%–66% 1.11 (0.98–1.27) 1.26 (1.11–1.44) Subjective life expectation 67%–100% 1.13 (0.99–1.28) 1.10 (0.97–1.27) Health care || Additional private insurance 1.20 (1.01–1.44) 1.31 (1.10–1.57) In hospital in last year 1.00 (0.88–1.14) 0.97 (0.85–1.10) 3–5 physician visits in the last year 1.43 (1.24–1.65) 1.63 (1.41–1.88) 6+ physician visits in the last year 1.61 (1.39–1.85) 2.01 (1.74–2.32)


Jump to section
Related Articles
Cited By...
- Increasing Efforts to Reduce Cervical Cancer through State-Level Comprehensive Cancer Control Planning
- Reversals of Association for Pap, Colorectal, and Prostate Cancer Testing among Hispanic and Non-Hispanic Black Women and Men
- The Break-Even Point: When Medical Advances Are Less Important Than Improving the Fidelity With Which They Are Delivered
- Provocative Questions
- In This Issue: Cervical Cancer Screening