
Article Figures & Data
Figures
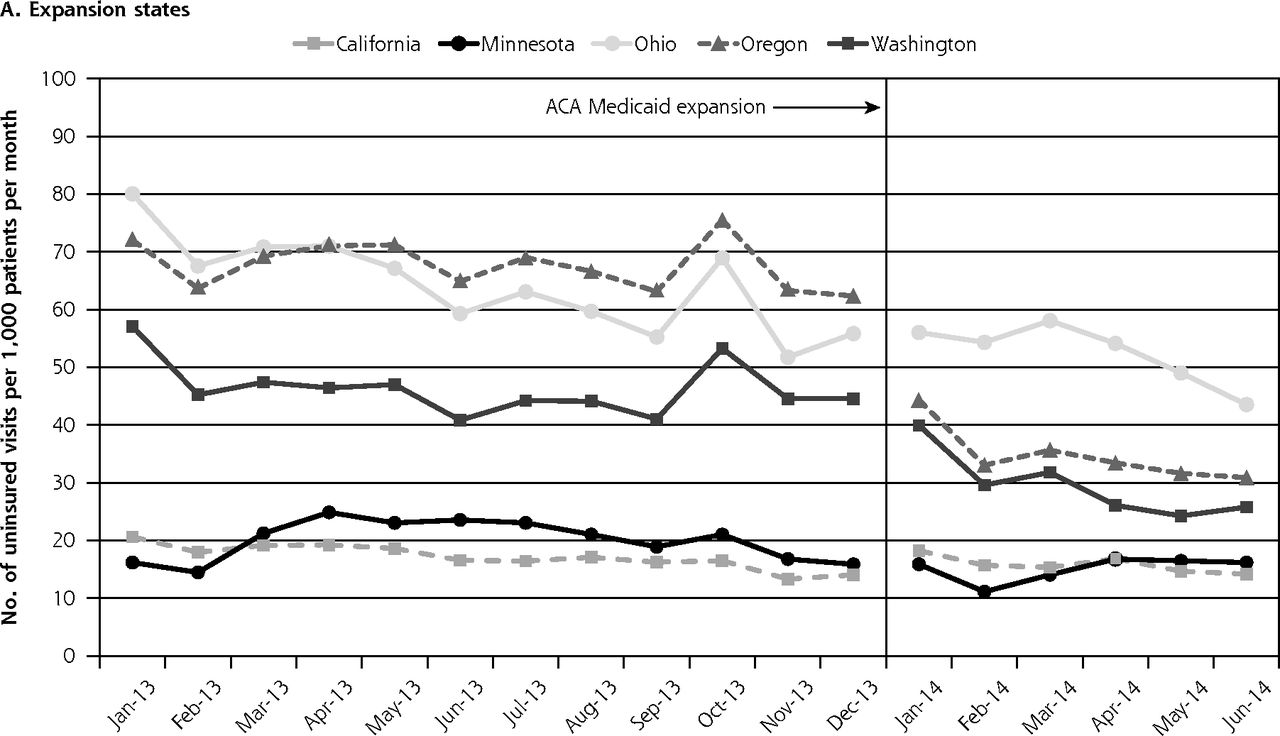
- Figure 1
Adjusted rates of uninsured visits by month among CHCs in expansion and nonexpansion states.
ACA = Affordable Care Act; CHC = community health center.
Notes: Rates calculated per 1,000 adult patients across entire study period. Poisson general estimating equation (GEE) model adjusted for percent of patients aged younger than 40 years and percent Hispanic, accounting for temporal correlation within CHCs over time.
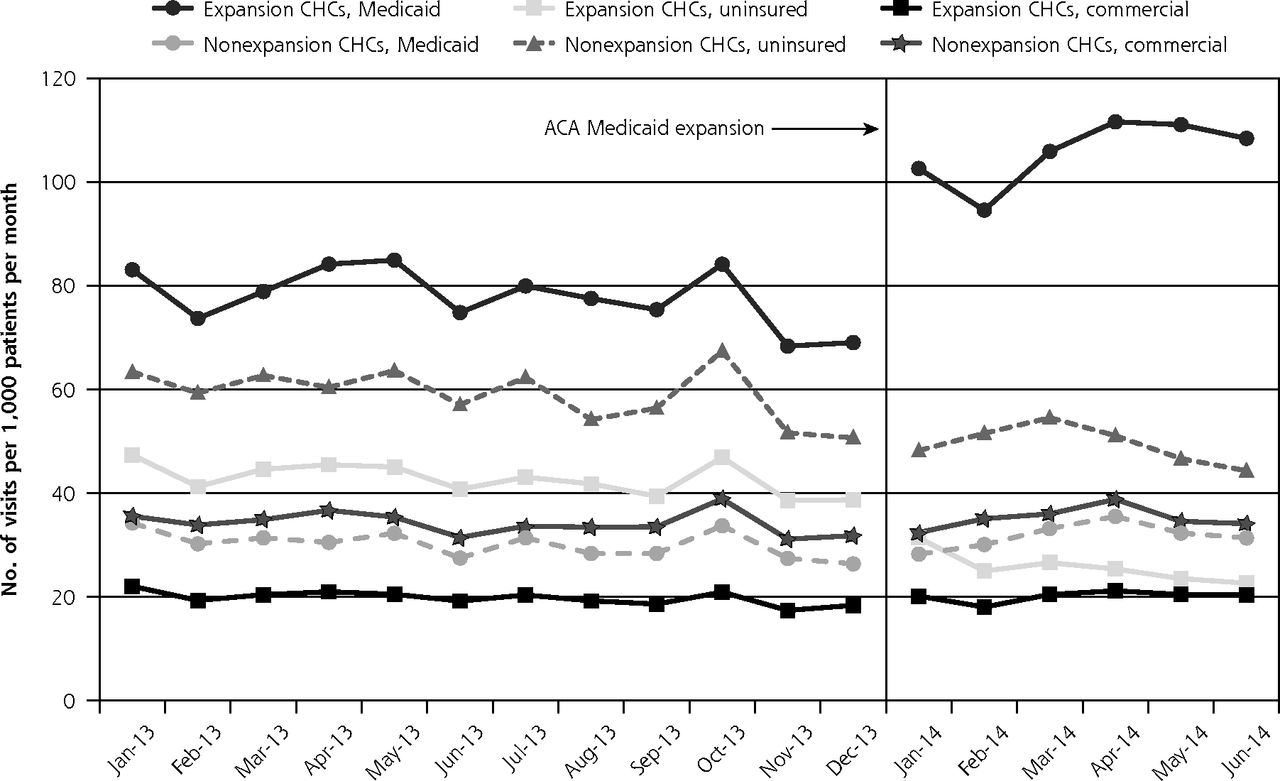
- Figure 2
Adjusted visit rates by coverage status and month among CHCs in expansion and nonexpansion states.
ACA = Affordable Care Act; CHC = community health center.
Notes: Rates calculated per 1,000 adult patients across entire study period. Poisson general estimating equation (GEE) model adjusted for percent nonwhite race, percent Hispanic, percent ≤138% federal poverty level (FPL), and percent with unknown FPL; models account for temporal correlation within CHCs over time.


Tables
- Table 1
Characteristics of States, CHCs, and Encounter Rates Before and After Medicaid Expansion
Expansion States8 Nonexpansion States8 Characteristic CA MN OH OR WA Total AK IN MT NC Total State-level factors Adult Medicaid eligibility,a pre-22/post-8 expansion period, % of FPL 106/138 215/205 96/138 39/138 71/138 – 78/128 24/24 54/54 47/45 – Minimum wage, 2014,19 $/hr 8.00 7.25 7.95 9.10 9.32 – 7.50 7.25 7.90 7.25 – Unemployment rate, 2014,20 % 7.6 4.6 5.5 6.9 6.1 – 6.4 5.7 4.6 6.4 – Adult uninsured rate, 2013,21 % 21.6 9.5 13.9 19.4 16.8 – 18.9 15.3 20.7 20.4 – Insurance marketplace23 State State Federal Stateb State – Federal Federal Federal Federal – OCHIN CHC characteristics Primary care CHCs, No. 29 4 14 85 5 137 1 9 5 4 19 Total patients, 2013–June 2014, No. 91,282 7,912 30,422 156,440 14,571 300,356c 2,198 10,244 9,014 11,861 33,315c Female sex, No. (%) 54,890(60.1) 4,477 (56.6) 18,045 (59.3) 93,620 (59.8) 8,819 (60.5) 179,675 (59.8)d 1,221 (55.6) 6,700 (65.4) 5,265 (58.4) 7,004 (59.1) 20,188 (60.6) Age-group, as of last visit, No. (%) 19 to 25 y 12,356 (13.5) 1,318 (16.7) 5,466 (18.0) 23,078 (14.8) 2,202 (15.1) 44,386 (14.8)d 347 (15.8) 1,469 (14.3) 1,876 (20.8) 1,269 (10.7) 4,961 (14.9) 26 to 39 y 29,037 (31.8) 2,920 (36.9) 10,052 (33.0) 52,389 (33.5) 4,696 (32.2) 99,000 (33.0) 760 (34.6) 3,091 (30.2) 2,569 (28.5) 2,683 (22.6) 9,102 (27.3) 40 to 64 y 49,889 (54.7) 3,674 (46.4) 14,904 (49.0) 80,973 (51.8) 7,673 (52.7) 156,970 (52.3) 1,091 (49.6) 5,684 (55.5) 4,569 (50.7) 7,909 (66.7) 19,252 (57.8) Household income, No. (%) ≤138 % of FPL 60,107 (65.8) 5,415 (68.4) 24,214 (79.6) 114,117 (72.9) 11,338 (77.8) 214,958 (71.6)d 718 (32.7) 7,507 (73.3) 5,431 (60.3) 5,410 (45.6) 19,066 (57.2) >138 % of FPL 11,416 (12.5) 523 (6.6) 2,962 (9.7) 24,645 (15.8) 3,118 (21.4) 42,628 (14.2) 1,016 (46.2) 1,038 (10.1) 2,181 (24.2) 2,822 (23.8) 7,055 (21.2) Missing/unknown 19,759 (21.6) 1,974 (24.9) 3,246 (10.7) 17,678 (11.3) 115 (0.8) 42,770 (14.2) 464 (21.1) 1,699 (16.6) 1,402 (15.6) 3,629 (30.6) 7,194 (21.6) Nonwhite race, No. (%) 7,914 (8.7) 6,191 (78.2) 15,365 (50.5) 14,709 (9.4) 1,033 (7.1) 45,192 (15.0)d 647 (29.4) 5,704 (55.7) 332 (3.7) 6,783 (57.2) 13,466 (40.4) Hispanic ethnicity, No. (%) 41,999 (46.0) 125 (1.6) 4,331 (14.2) 38,243 (24.4) 1,472 (10.1) 86,145 (28.7)d 227 (10.3) 1,041 (10.2) 336 (3.7) 491 (4.1) 2,095 (6.3) Urban residence, No. (%) 88,368 (96.8) 7,841 (99.1) 30,410(100.0) 147,320(94.2) 13,518 (92.8) 287,204 (95.6)d 2,172 (98.8) 10,195 (99.5) 8,083 (89.7) 8,886 (74.9) 29,335 (88.1) Adjustede visit RRs, postexpansion period vs preexpansion periodf Total visits, RR (95% CI) 0.99 (0.93–1.05) 1.05 (1.03–1.08)g 1.02 (0.94–1.10) 1.07 (1.03–1.11)g 1.34 (1.00–1.79) 1.05 (1.01–1.08)g 0.94h 0.99 (0.76–1.28) 0.94 (0.85–1.05) 0.93 (0.80–1.08) 0.95 (0.87–1.04) Uninsured visits, RR (95% CI) 0.92 (0.78–1.09) 0.75 (0.65–0.87)g 0.82 (0.71–0.94)g 0.51 (0.45–0.59)g 0.64 (0.54–0.75)g 0.60 (0.54–0.67)g 0.84h 0.88 (0.68–1.14) 0.83 (0.78–0.88)g 0.78 (0.57–1.07) 0.84 (0.74–0.95)g Medicaid visits, RR (95% CI) 1.03 (0.94–1.12) 1.11 (1.03–1.19)g 1.17 (1.07–1.29)g 1.78 (1.60–1.98)g 2.04 (1.39–2.99)g 1.36 (1.24–1.49)g 1.07h 1.18 (0.86–1.62) 1.03 (1.00–1.07) 0.96 (0.81–1.12) 1.05 (0.94–1.18) Commercially insured visits, RR (95% CI) 1.08 (0.92–1.27) 0.99 (0.90–1.09) 1.22 (1.09–1.37)g 0.96 (0.89–1.05) 1.03 (0.84–1.27) 1.02 (0.94–1.09) 0.96h 1.20 (0.89–1.61) 1.01 (0.82–1.24) 1.03 (0.99–1.06) 1.03 (0.96–1.11) -
AK= Alaska; CA = California; CHC = community health center; FPL = federal poverty level; GEE = generalized estimating equation; IN = Indiana; MN = Minnesota; MT= Montana; NC = North Carolina; OCHIN = formerly the Oregon Community Health Information Network; OH = Ohio; OR= Oregon; RR = rate ratio; WA = Washington.
-
↵a Eligibility FPL levels may differ between adults with children and without, or those who are working and those who are jobless. The number reported indicates the highest FPL limit for open full Medicaid coverage in a given state among these categories.
-
↵b Because of problems with its state exchange rollout, Oregon opted to switch to the federal exchange in mid-2014.
-
↵c Expansion group numbers may not sum because an individual patient can have visits in more than 1 state.
-
↵d Overall percentage differs significantly between expansion states and nonexpansion states by χ2 test (P < .001).
-
↵e Rates by state: Poisson GEE model adjusted for CHC-level factors (percent female, percent younger than age 40 years, percent nonwhite, percent Hispanic, percent ≤138% FPL, percent with unknown FPL, percent urban). Rates by expansion status: Poisson GEE model adjusted for all CHC-level factors plus state-level factors (2014 minimum wage, 2014 unemployment rate, 2013 adult uninsurance rate). All GEE models accounted for temporal correlation over time within CHCs.
-
↵f Preexpansion period: January 1, 2013, to December 31, 2013; postexpansion period: January 1, 2014, to June 30, 2014.
-
↵g RR is significantly different from 1.0.
-
↵h CI cannot be computed because Alaska had only 1 CHC in the sample.
-
The Article in Brief
An Early Look at Rates of Uninsured Safety Net Clinic Visits After the Affordable Care Act
Heather Angier , and colleagues
Background The Affordable Care Act supports significant expansions in Medicaid coverage in the United States. This study explores the number of patient visits to uninsured safety net clinics in states that implemented Medicaid expansion compared with states that did not expand Medicaid.
What This Study Found Medicaid expansions appear to have successfully decreased the number of uninsured safety net patients in the US. Community health centers in states that expanded Medicaid had a 40 percent decrease in the rate of uninsured visits and a 36 percent increase in the rate of Medicaid-covered visits. In contrast, clinics in non-expansion states had a 16 percent decline in the rate of uninsured visits but no change in the rate of Medicaid-covered visits.
Implications
- This study confirms other reports showing increased health insurance coverage rates following state Medicaid expansion and adds new information demonstrating a measurable effect on community health center visits in Medicaid expansion states.
In this issue


Jump to section
Related Articles
Cited By...
- Health Care Expenditures Among Adults With Diabetes After Oregons Medicaid Expansion
- Impact of Alternative Payment Methodology on Primary Care Visits and Scheduling
- Following Uninsured Patients Through Medicaid Expansion: Ambulatory Care Use and Diagnosed Conditions
- The Impact of the Affordable Care Act (ACA) Medicaid Expansion on Visit Rates for Diabetes in Safety Net Health Centers
- Implementation of Health Insurance Support Tools in Community Health Centers
- Uninsured Primary Care Visit Disparities Under the Affordable Care Act
- At Federally Funded Health Centers, Medicaid Expansion Was Associated With Improved Quality Of Care
- Medicaid Expansion And Grant Funding Increases Helped Improve Community Health Center Capacity
- After Medicaid Expansion In Kentucky, Use Of Hospital Emergency Departments For Dental Conditions Increased
- Community Health Center Use After Oregon's Randomized Medicaid Experiment
- In This Issue: Policy and Practice