
Article Figures & Data
Figures
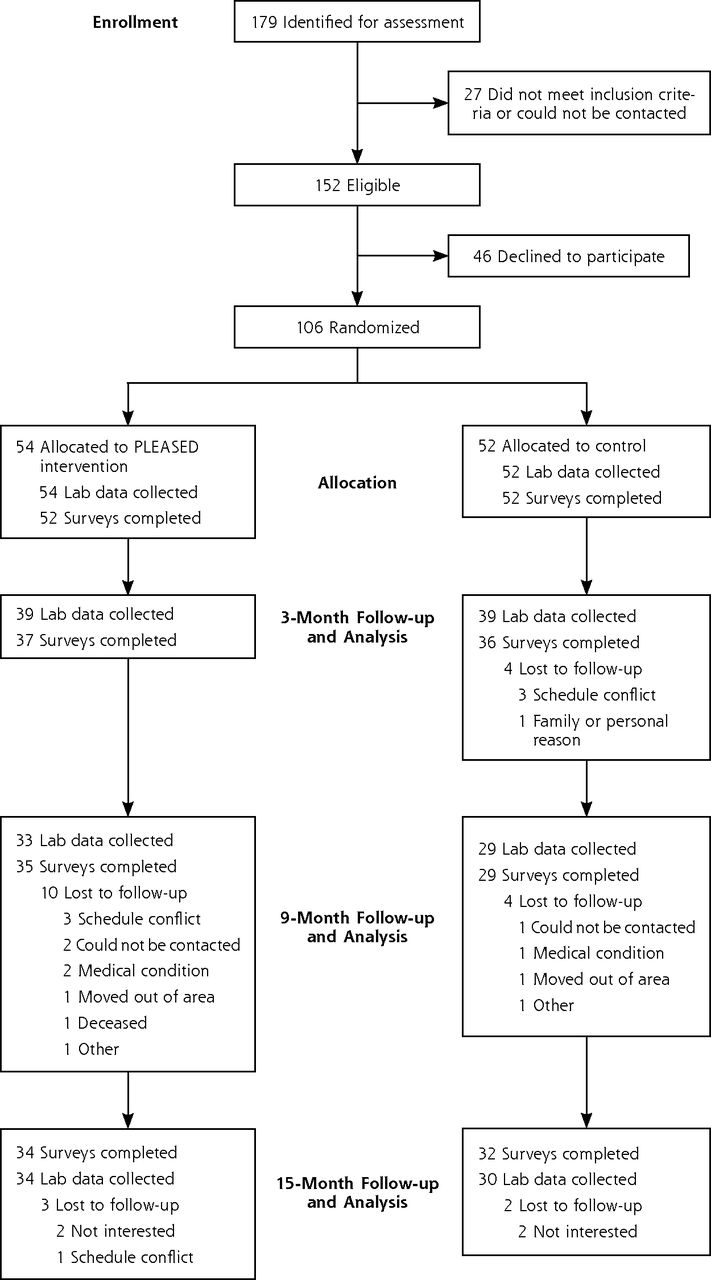
- Figure 1
CONSORT 2012 flow diagram: PLEASED Study
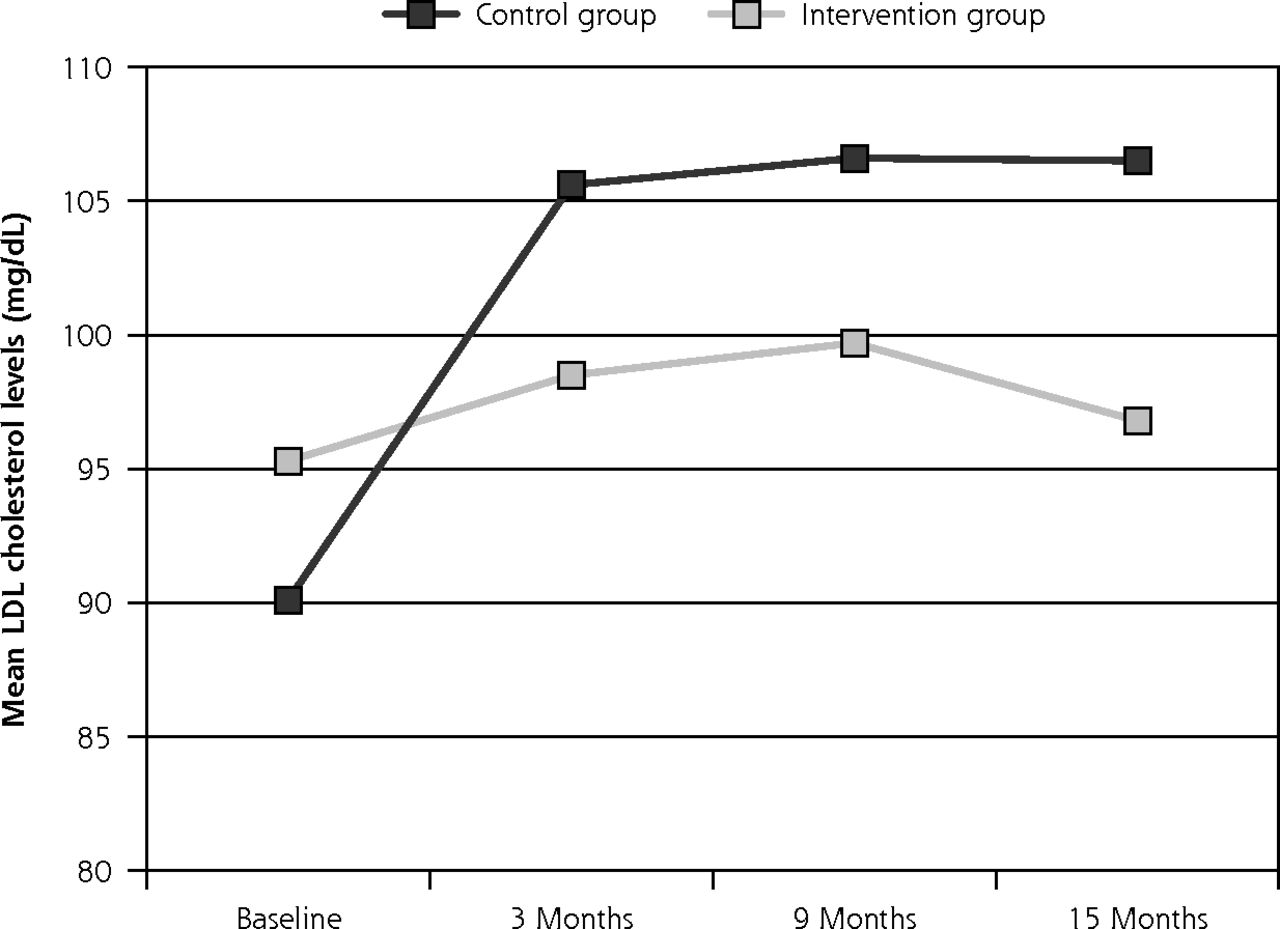
- Figure 2
Trajectory of unadjusted mean LDL cholesterol levels over time
Note: At baseline, LDL cholesterol (LDL-C) levels did not differ significantly between groups. All increases within the Control group were significant (P <.05) relative to the Intervention group. Within-group changes from baseline to 3, 9, and 15 months were all significant for the Control group (P = .01).

Tables
Characteristic Peer-led Group (n = 54) Control Group (n = 52) Total (n = 106) P Value for Between-Group Difference Age, y, mean (SD) 56.7 (11.5) 55.9 (11.3) 56.3 (11.4) .71a Men, n (%) 17 (31.5%) 18 (34.6%) 35 (33.0%) .73b Race or ethnicity, n (%) N/A African American 54 (100%) 52 (100%) 106 (100%) Education, n (%) .33c Some high school or less 5 (9.6%) 3 (5.8%) 8 (7.7%) High school graduate or GED 6 (11.5%) 7 (13.5%) 13 (12.5%) Some college/technical/vocational training 25 (48.1%) 18 (34.6%) 43 (41.3%) College graduate or higher 16 (30.8%) 24 (46.2%) 40 (38.5%) Employed, n (%) 20 (38.5%) 25 (48.1%) 45 (43.3%) .32b Have health insurance, n (%) 45 (95.7%) 49 (100.0%) 94 (97.9%) .24c Household income, n (%) .25b <$20,000 9 (17.3%) 14 (26.9%) 23 (22.1%) $20,000 – $49,999 21 (40.4%) 24 (46.2%) 45 (43.3%) $50,000 or more 20 (38.5%) 13 (25.0%) 33 (31.7%) Social support Married or partnered, n (%) 26 (50.0%) 24 (46.2%) 50 (48.1%) .69b Diabetes social support, mean (SD) 5.4 (1.3) 5.3 (1.5) 5.3 (1.4) .73a Antihyperglycemic medication, n (%) .97b No medications 7 (14.0%) 6 (12.2%) 13 (13.1%) Only oral diabetes medication 24 (48.0%) 24 (49.0%) 48 (48.5%) Insulin, with or without medication 19 (38.0%) 19 (38.8%) 38 (38.4%) Medication adherence, n (%) Often or very often miss insulin dose/wk 2 (10.0%) 1 (4.8%) 3 (7.3%) .61c Often or very often miss medication dose/wk 0 (0.0%) 1 (2.2%) 1 (1.3%) >.99c General health Self-rated fair or poor general health, n (%) 17 (32.7%) 19 (36.5%) 36 (34.6%) .68b Minimal depression,d n (%) 37 (72.5) 29 (55.8) 66 (64.1) .08b Diabetes distress scalee .83b Little or no distress 30 (57.7) 33 (63.5) 63 (60.6) Moderate distress 15 (28.8) 13 (25.0) 28 (26.9) High distress 7 (13.5) 6 (11.5) 13 (12.5) Physiological measures Hemoglobin A1c, %, mean (SD) 7.8 (2.1) 8.0 (1.6) 7.9 (1.9) .53a Hemoglobin A1c, mmol/mol, mean (SD) 62.0 (23.0) 64.0 (17.5) 63.0 (20.8) .53a Total cholesterol, mg/DL, mean (SD) 155.3 (42.3) 151.8 (40.1) 153.5 (41.1) .67a LDL cholesterol, mg/DL, mean (SD) 95.3 (33.8) 90.1 (31.8) 92.7 (32.8) .43a HDL Cholesterol, mg/DL, mean (SD) 46.4 (15.2) 49.6 (15.6) 48.0 (15.4) .28a Total cholesterol / HDL cholesterol 3.5 (1.0) 3.2 (1.0) 3.4 (1.0) .12a Systolic BP, mm Hg, mean (SD) 137.2 (19.5) 137.8 (18.5) 137.5 (18.9) .87a Diastolic BP, mm Hg, mean (SD) 87.5 (13.2) 86.4 (13.4) 87.0 (13.2) .69a Body mass index, kg/m2, mean (SD) 36.2 (7.4) 35.4 (8.5) 35.8 (7.9) .59a Waist circumference, inches, mean (SD) 44.9 (6.3) 45.3 (6.6) 45.1 (6.4) .73a Diabetes duration, years, mean (SD) 8.0 (6.9) 10.5 (9.7) 9.2 (8.5) .14f Outcome Group Baseline 3 Months–Baseline 9 Months-Baseline 15 Months-Baseline HbA1c, %, mean (CI) Intervention 7.8 (7.2–8.4) −0.1 (−0.4 to 0.3) P = .72 0.0 (−0.4 to 0.4) P >.99 0.5 (−0.1 to 1.1) P = .10 Control 8.0 (7.6–8.5) −0.3 (−0.7 to 0.0) P = .08 0.1 (−0.3 to 0.5) P = .61 0.1 (−0.5 to 0.8) P = .71 Control vs Intervention −0.2 (−1.0 to 0.5) P = .53 0.3 (−0.2 to 0.8) P = .30 −0.1 (−0.7 to 0.5) P = .71 0.4 (−0.5 to 1.3) P = .39 HbA1c, mmol/mol mean, (CI) Intervention 62.0 (55.0–68.0) −1.1 (−4.4 to 3.3) P = .72 0.0 (−4.4 to 4.4) P >.99 5.5 (−1.1 to 12.0) P = .10 Control 64.0 (60.0–69.0) −3.3 (−7.7 to 0.0) P = .07 1.1 (−3.3 to 5.5) P = .61 1.1 (−5.5 to 8.7) P = .71 Control vs Intervention −2.2 (−10.9 to 5.5) P = .53 3.3 (−2.2 to 8.7) P = .30 −1.1 (−7.7 to 5.5) P = .71 4.4 (−5.5 to 14.2) P = .39 LDL cholesterol, mg/dL, mean (CI) Intervention 95.3 (85.8–104.7) 3.0 (−3.8 to 9.9) P = .39 4.6 (−2.6 to 11.8) P = .22 1.6 (−7.7 to 10.9) P = .74 Control 90.1 (81.3–99.0) 15.5 (8.6–22.3) P <.001 16.5 (8.9–24.1) P <.001 16.6 (6.8–26.3) P = .002 Control vs Intervention 5.1 (−7.6 to 17.9) P = .43 −12.5 (−22.1 to −2.8) P = .01 −11.9 (−22.4 to −1.5) P = .03 −15.0 (−28.5 to −1.5) P = .03 HDL cholesterol, mg/dL, mean (CI) Intervention 46.3 (42.1–50.6) 5.8 (3.4–8.3) P <.001 13.6 (10.3–16.9) P <.001 14.1 (9.9–18.2) P <.001 Control 49.6 (45.3–54.0) 0.8 (−1.7 to 3.2) P = .54 14.3 (10.8–17.8) P <.001 13.3 (8.9–17.7) P <.001 Control vs Intervention −3.3 (−9.3 to 2.7) P = .28 5.1 (1.7–8.5) P = .005 −0.7 (−5.5 to 4.1) P = .78 0.8 (−5.3 to 6.8) P = .81 Systolic blood pressure, mm Hg, mean (CI) Intervention 137.2 (131.8–142.5) −0.7 (−5.6 to 4.2) P = .78 −0.6 (−6.0 to 4.8) P = .83 −2.5 (−7.7 to 2.7) P = .35 Control 137.8 (132.6–142.9) 3.6 (−1.3 to 8.6) P = .15 4.3 (−1.2 to 9.9) P = .13 7.5 (2.0–13.0) P = .008 Control vs Intervention −0.6 (−7.9 to 6.7) P = .87 −4.3 (−11.3 to 2.6) P = .23 −4.9 (−12.7 to 2.8) P = .22 −10.0 (−17.6 to −2.4) P = .01 Diastolic blood pressure, mm Hg, mean (CI) Intervention 87.4 (83.8–91.1) −4.5 (−7.7 to −1.3) P = .007 −3.3 (−6.7 to 0.1) P = .06 −6.4 (−9.8 to −3.1) P <.001 Control 86.4 (82.7–90.2) 1.9 (−1.3 to 5.1) P = .26 1.6 (−2.0 to 5.1) P = .39 1.9 (−1.7 to 5.4) P = .31 Control vs Intervention 1.0 (−4.1 to 6.1) P = .69 −6.4 (−10.9 to −1.8) P = .007 −4.8 (−9.8 to 0.1) P = .06 −8.3 (−13.2 to −3.4) P = .001 BMI, kg/m2, mean (CI) Intervention 36.2 (34.2–38.3) −0.4 (−0.9 to 0.1) P P = .12 −0.7 (−1.2 to −0.1) P = .01 −1.0 (−1.5 to −0.5) P <.001 Control 35.4 (33.1–37.8) −0.2 (−0.7 to 0.3) P = .42 −0.3 (−0.8 to 0.3) P = .35 −0.2 (−0.7 to 0.3) P = .49 Control vs Intervention 0.8 (−2.2 to 3.9) P = .59 −0.2 (−0.9 to 0.5) P = .60 −0.4 (−1.2 to 0.3) P = .29 −0.8 (−1.6 to −0.1) P = .03 Waist circumference, inches, mean (CI) Intervention 44.8 (43.1–46.6) −1.0 (−1.8 to −0.2) P = .02 −1.3 (−2.2 to −0.5) P = .003 −1.4 (−2.2 to −0.5) P = .003 Control 45.3 (43.4–47.1) −0.7 (−1.5 to 0.1) P = .10 −1.4 (−2.3 to −0.5) P = .003 −1.3 (−2.2 to −0.4) P = .004 Control vs Intervention −0.4 (−2.9 to 2.1) P = .73 −0.3 (−1.5 to 0.9) P = .61 0.0 (−1.2 to 1.3) P = .95 0.0 (−1.3 to 1.2) P = .98 Diabetes support scale, mean (CI) Intervention 5.4 (5.0–5.7) 0.5 (0.1–0.9) P = .02 0.2 (−0.2 to 0.6) P = .33 0.4 (0.0–0.9) P = .04 Control 5.3 (4.8–5.7) 0.4 (0.0–0.8) P = .07 0.4 (0.0–0.8) P = .08 0.2 (−0.2 to 0.6) P = .31 Control vs Intervention 0.1 (−0.5 to 0.7) P = .73 0.1 (−0.5 to 0.7) P = .75 −0.2 (−0.8 to 0.4) P = .53 0.2 (−0.4 to 0.8) P = .48 Little to no diabetes distress,a % (CI) Intervention 58.1 (45–71) 74.4 (59–85) P = .01 69.5 (55–81) P = .08 64.0 (50–76) P = .30 Control 63.5 (50–75) 90.2 (74–97) P = .01 85.0 (68–94) P = .04 83.7 (67–93) P = .03 Control vs Intervention −5.3 (−24 to 13) P = .58 .−10.5 (−32 to 11) P = .19 −10.1 (−33 to 12) P = .29 −14.4 (−37 to 9) P = .13 BMI = body mass index; CI = 95% confidence interval.
Note: N = 106: Intervention n = 54, Control n = 52. All longitudinal outcomes except diabetes distress were analyzed using a linear mixed model (LMM). Diabetes distress was analyzed using a generalized estimating equation (GEE). Control-vs-Intervention P values are between-group values; other P values given are for within-group difference from baseline to the specified time.
↵a Diabetes Distress Scale (DDS). DDS <2: little or no distress; 2≤ DDS <3: moderate distress; DDS ≥3: high distress. P values for DDS are for change relative to baseline. Due to sparse cell counts in the “High Diabetes Distress” category at follow-up times, the logistic regression categories were “Little to no Diabetes Distress” vs “Moderate to High Diabetes Distress.” For the method used to determine confidence intervals for diabetes distress scores, see Supplemental Appendix at http://www.annfammed.org/content/13/Suppl_1/S27/suppl/DC1.
b Minimal depression indicated by PHQ (Primary Care Evaluation of Mental Disorders) ≥3.
Supplemental Appendixes
Supplemental Appendixes
Files in this Data Supplement:
- Supplemental data: Appendixes - PDF file


Jump to section
Related Articles
Cited By...
- Investigating the sustainability of self-help programmes in the context of leprosy and the work of leprosy missions in Nigeria, Nepal and India: a qualitative study protocol
- Patients perspectives of prehabilitation as an extension of Enhanced Recovery After Surgery protocols
- Challenges in the Ethical Review of Peer Support Interventions