
Article Figures & Data
Figures
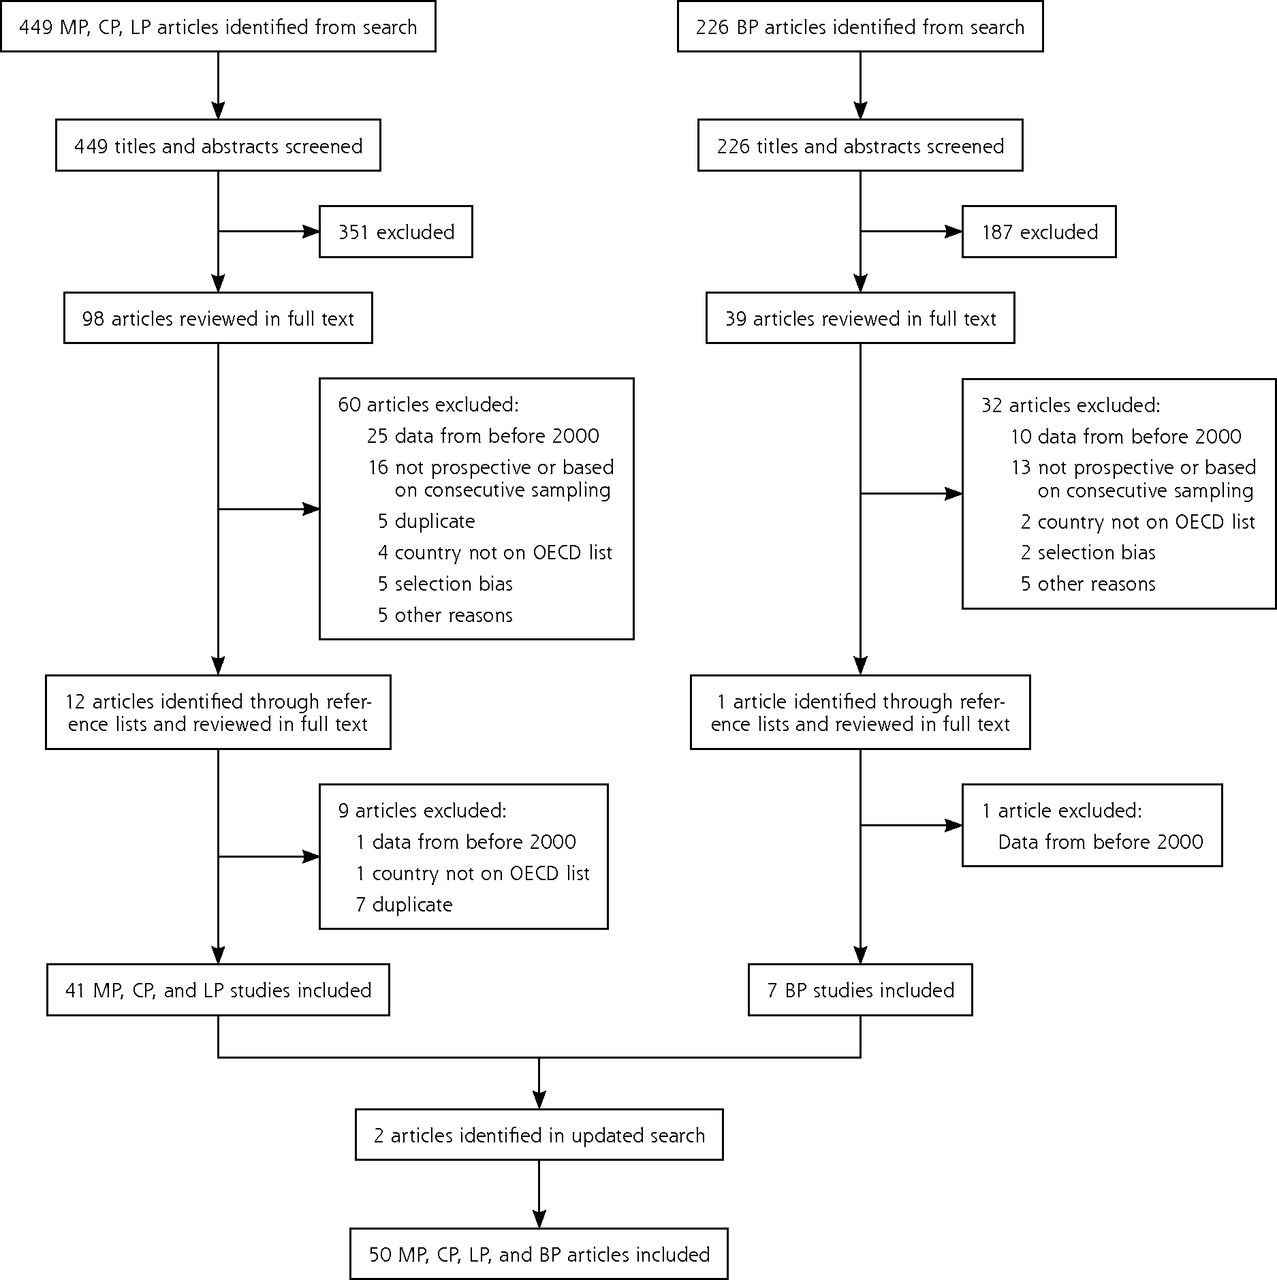
- Figure 1
PRISMA diagram.
BP = Bordetella pertussis; CP = Chlamydophila pneumoniae; LP = Legionella pneumophila; MP = Mycoplasma pneumonia; OECD = Organization for Economic Cooperation and Development.
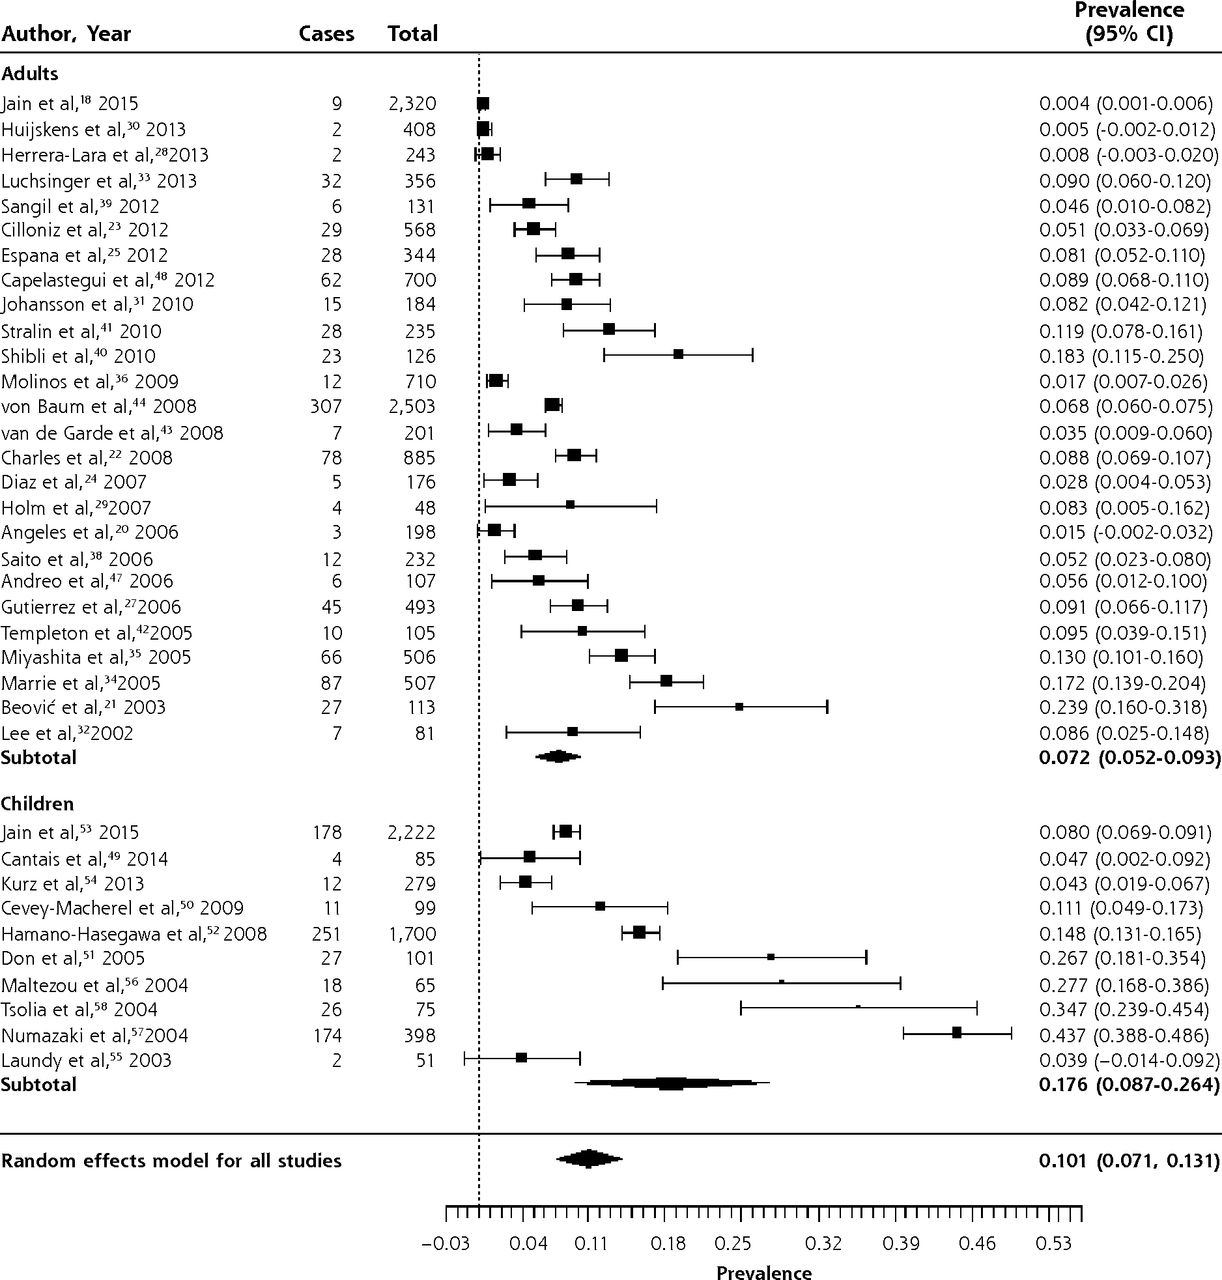
- Figure 2
Forest plot of the prevalence of Mycoplasma pneumoniae in adults and children with community-acquired pneumonia, sorted in reverse chronological order.
Heterogeneity (I2) = 99.27
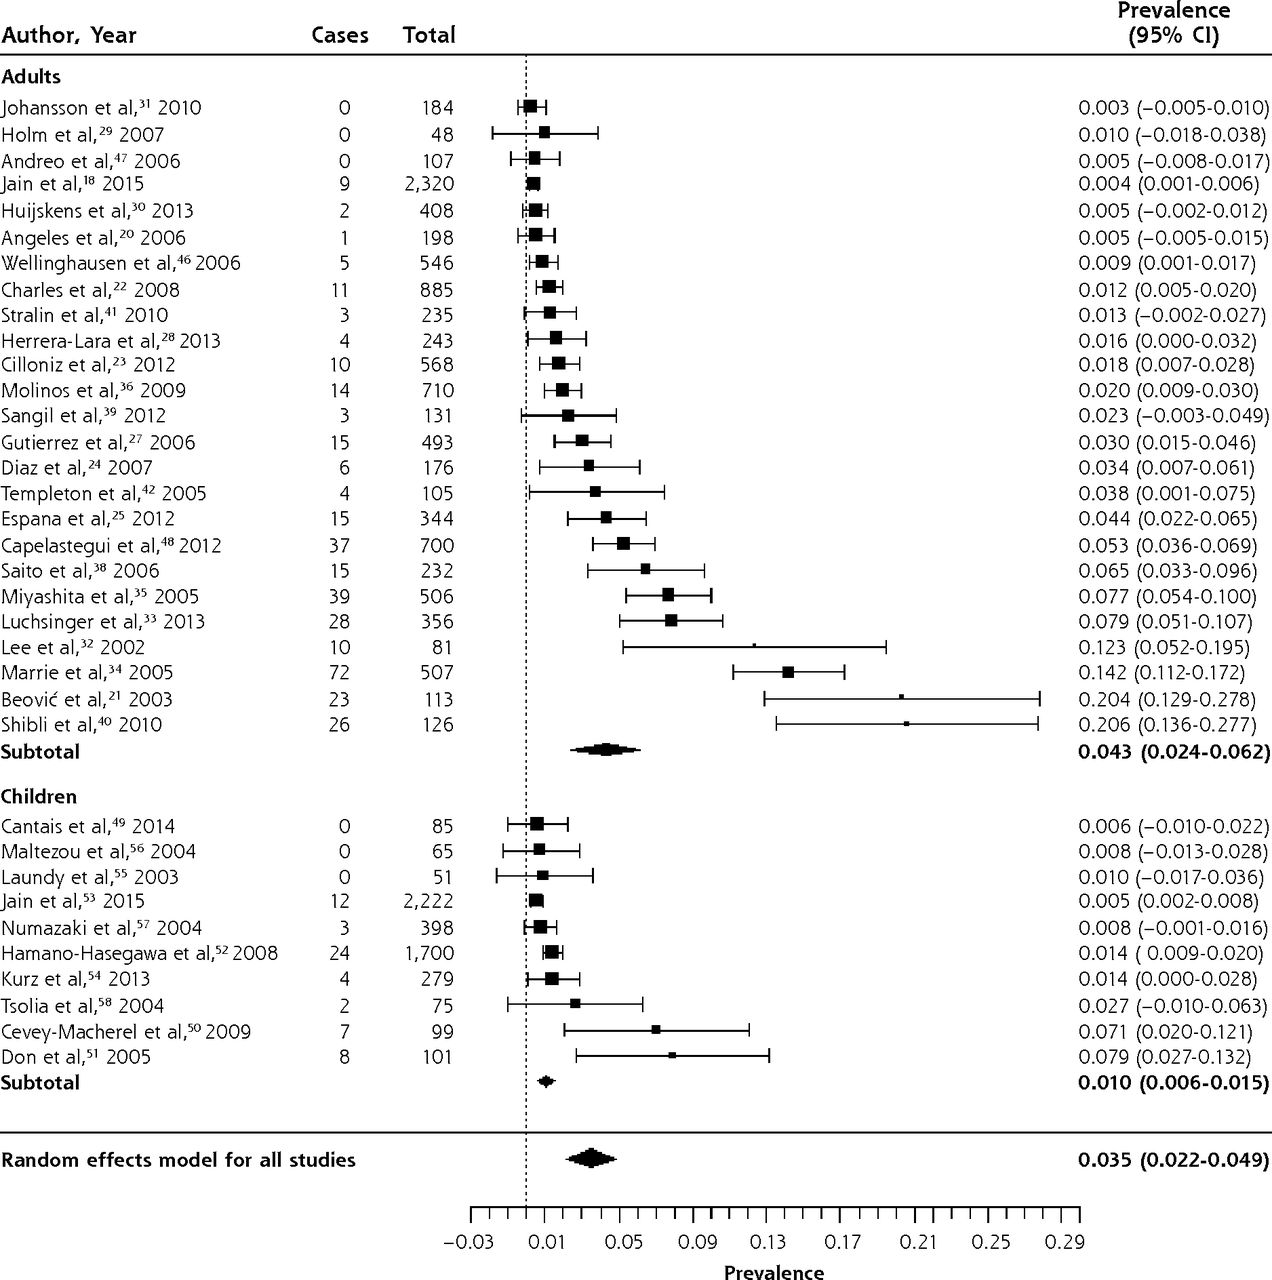
- Figure 3
Forest plot of the prevalence of Chlamydia pneumoniae in adults and children with community-acquired pneumonia, sorted by prevalence.
Heterogeneity (I2) = 98.4
- Figure 4
Forest plot of the prevalence of Legionella pneumophila in adults and children with community-acquired pneumonia, sorted by prevalence.
Heterogeneity (I2) = 91.18
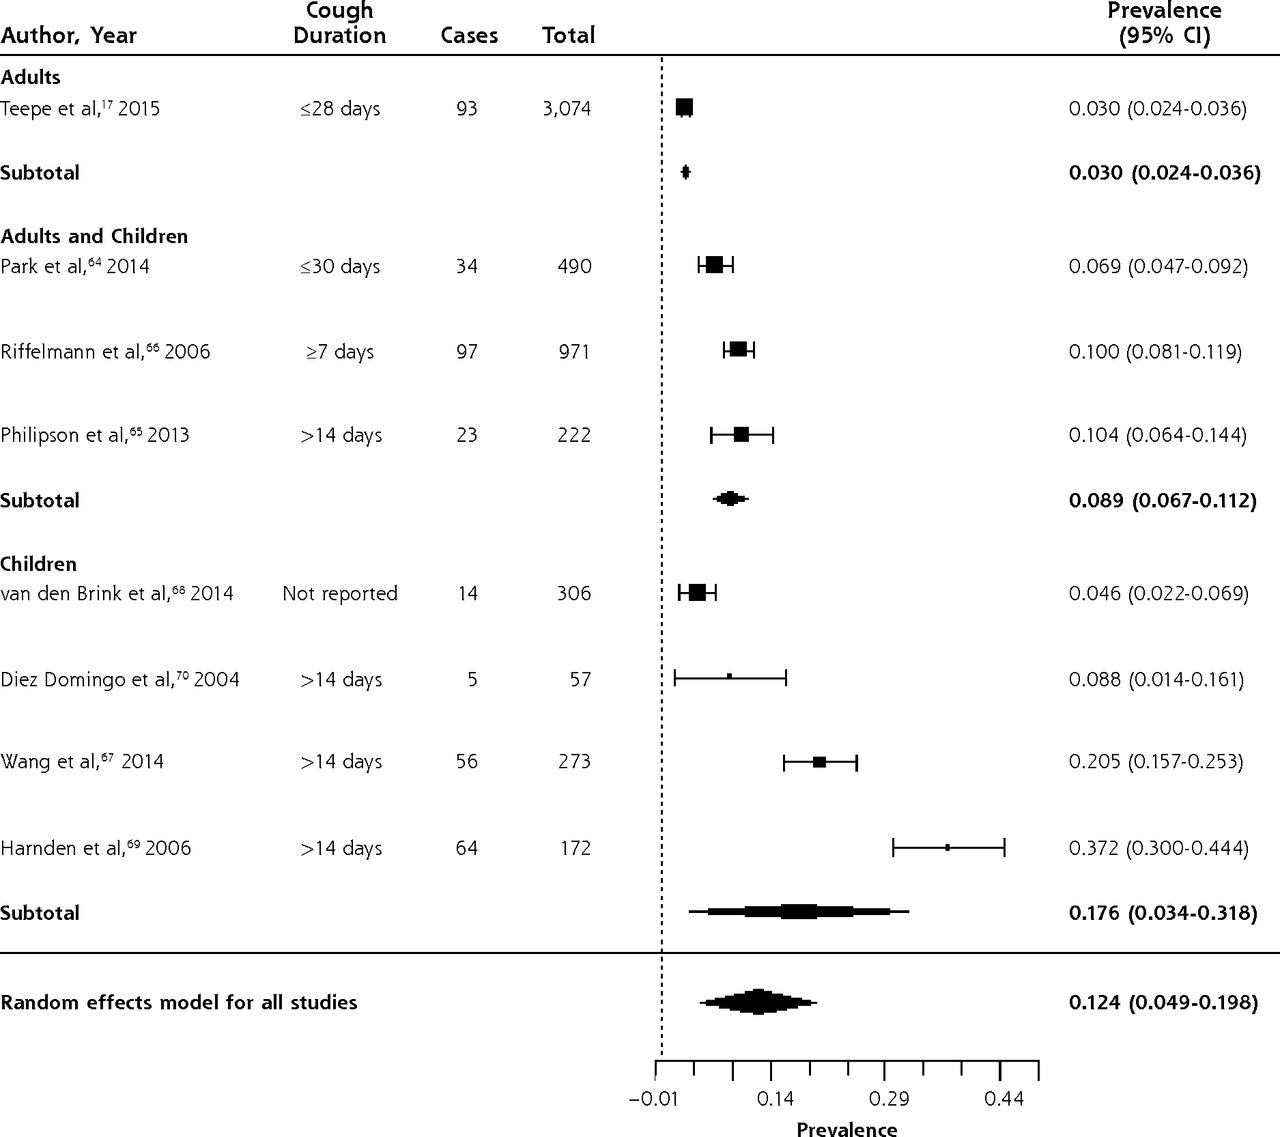
- Figure 5
Forest plot of the prevalence of Bordetella pertussis in outpatients with prolonged cough or non-pneumonia lower respiratory tract infection, sorted by prevalence.
Heterogeneity (I2) = 98.83


Tables
- Table 1
Reported Bordetella pertussis and Legionella pneumophila Prevalence in 2012 by Case-Based Surveillance Systems of High-Income Countries Belonging to the OECD
Countrya BP Cases LP Cases Populationb BP Rate per 100,000 LP Rate per 100,000 Australia 24,069 382 22,918,688 105.0 1.67 Austria 425 101 8,428,915 5.0 1.20 Belgium ND 106 10,787,788 ND 0.98 Canada 4,540 483 34,674,708 13.1 1.39 Chile 4,237 ND 17,423,214 24.3 ND Czech Republic 707 56 10,565,678 6.7 0.53 Denmark 1,136 127 5,592,738 20.3 2.27 Estonia 149 3 1,339,762 11.1 0.22 Finland 541 10 5,402,627 10.0 0.19 France ND 1,298 63,457,777 ND 2.05 Germany ND 628 81,990,837 ND 0.33 Greece 40 27 11,418,878 0.35 0.77 Hungary 5 33 9,949,589 0.05 0.24 Iceland 36 2 328,290 11.0 0.61 Ireland 264 15 4,579,498 5.8 0.33 Italy 262 1,332 60,964,145 0.43 2.18 Japan ND 903 126,434,653 ND 0.71 Korea, Rep. 126 25 48,588,326 0.26 0.05 Luxembourg 11 5 523,362 2.1 0.96 Netherlands 12,868 304 16,714,228 77.0 1.82 New Zealand 2,320 152 4,461,257 52.0 3.41 Norway 4,243 25 4,960,482 85.5 0.50 Polandc 1,824 8 38,317,090 4.8 0.02 Portugal 230 140 10,699,333 2.1 1.31 Slovak Republic 917 4 5,480,332 16.7 0.07 Slovenia 153 82 2,040,057 7.5 4.02 Spain 1,565 972 46,771,596 3.3 2.08 Sweden 279 12 9,495,392 2.9 0.13 Switzerland ND 91 7,733,709 ND 1.18 United Kingdom 11,993 401 62,798,099 19.1 0.64 United States 48,277 3,688 315,791,284 15.3 1.17 - Table 2
Characteristics of Studies of the Prevalence of Mycoplasma pneumoniae, Chlamydia pneumoniae, and Legionella pneumophila in Patients With Community-Acquired Pneumonia or Lower Respiratory Tract Infection
Author, Year (Country) Population Total/Confirmed Casesa Setting Age Pathogen Data Collection Period Diagnostic Method CAP in Adults Jain et al,18 2015b (United States) Adults ≥18 y with CAP 2,320/853 Inpatient Median 57 y, MP, CP, LP 2010–2012 PCR, Culture, UA Angeles et al,20 2006 (Spain) Adults ≥15 y with CAP 198/112 Inpatient Median 70 y MP, CP, LP 2003–2004 Serology, UA Beović et al,21 2003 (Slovenia) Adults ≥15 y with CAP (PSI = I or II) 113/68 NR Mean 44.9 y MP, CP, LP 1999–2001 Serology Charles et al,22 2008 (Australia) Adults ≥18 y with CAP 885/404 Inpatient Mean 65.1 y, range 18 y–100 y) MP, CP, LP 2004–2006 Serology, UA Cilloniz et al,23 2012 (Spain) Adults ≥16 y with CAP 568/188 Outpatient Mean 47.2 y MP, CP, LP 2000–2010 Serology, UA Diaz et al,24 2007 (Chile) Adults ≥16 y with CAP 176/98 Inpatient Mean 65.8 y, range 17 y–101 y MP, CP, LP 2003–2005 Serology, UA Espana et al,25 2012 (Spain) Adults ≥18 y with CAP 344/153 73 Inpatient, 271 outpatient Mean 53.5 y MP, CP, LP 2006–2007 Serology, UA Falguera et al,26 2010 (Spain) Adults ≥18 y or older with CAP (PSI IV or V) 88/25 Inpatient Mean 64 y LP 2006–2008 Serology, UA Gutierrez et al,27 2006 (Spain) Adults ≥15 y with CAP 493/250 361 Inpatient, 132 outpatient Mean 56.6 y, range 15 y–94 y MP, CP, LP 1999–2001 Serology, UA Herrera-Lara et al,28 2013 (Spain) Adults ≥18 y with CAP 243/139 Inpatient Mean 63.9 y MP, CP, LP 2006–2009 Serology, UA Holm et al,29 2007b (Denmark) Adults ≥18 y with CAP 48/21 9 Inpatient, 39 outpatient Mean 61 y, range 22 y–88 y MP, CP, LP 2002–2003 PCR Huijskens et al,30 2013 (Netherlands) Adults ≥20 y with CAP 408/263 NR Mean 65 y, range 20 y–94 y MP, CP, LP 2008–2009 Serology, PCR, UA Johansson et al,31 2010 (Sweden) Adults ≥18 y with CAP 184/124 Inpatient Mean 61.3 y, range 18 y–93 y MP, CP, LP 2004–2005 Serology, PCR, UA Lee et al,32 2002 (South Korea) Adults ≥16 y with CAP 81/15 Inpatient Mean 66.3 y, range 17 y–92 y MP, CP, LP 1999–2000 Serology Luchsinger et al,33 2013 (Chile) Adults ≥18 y with CAP 356/232 330 Inpatient, 26 outpatient Mean 59.3 yc MP, CP, LP 2005–2007 Serology, PCR, UA Marrie et al,34 2005 (Canada) Adults ≥18 y with CAP 507/245 Outpatient Mean 47.8 y MP, CP 2003 Serology Miyashita et al,35 2005 (Japan) Adults >16 y with CAP 506/318 400 Inpatient, 106 outpatient Mean 58.3 y, range 16 y–97 y MP, CP, LP 1998–2003 Serology, UA Molinos et al,36 2009 (Spain) Patients with CAPd 710/274 Inpatient Mean 67.1 y MP, CP, LP 2003–2004 Serology, UA Prat et al,37 2006 (Spain) Patients with CAPd 217/116 Inpatient Mean 56.6 y LP 2005–2005 UA Saito et al,38 2006 (Japan) Adults ≥17 y with CAP 232/170 200 Inpatient, 32 outpatient Mean 60.2 y, range 17 y–99 y MP, CP, LP 1999–2000 Serology, PCR, UA, Culture Sangil et al,39 2012 (Spain) Adults ≥18 y with CAP 131/92 Inpatient Mean 64.4 y, range 48 y–80 MP, CP, LP 2009–2010 Serology, PCR, UA Shibli et al,40 2010 (Israel) Adults ≥18 y with CAP 126/84 Inpatient Mean 58.3, range 18 y–93 y MP, CP, LP 2006–2007 Serology, PCR Stralin et al,41 2010 (Sweden) Adults ≥18 y with CAP 235/133 Inpatient Median 71 y, range 18 y–96 y MP, CP, LP 1999–2002 Serology, PCR, UA Templeton et al,42 2005 (Netherlands) Adults ≥18 y with CAP 105/80 92 inpatient, 13 outpatient NR MP, CP, LP 2000–2002 PCR van de Garde et al,43 2008 (Netherlands) Patients with CAPd 201/128 Inpatient Mean 63 y MP, LP 2004–2006 PCR von Baum et al,44 2008 (Germany [CAPNETZ]) Adults ≥18 y with CAP 2,503/877 1,727 Inpatient, 776 outpatient Mean 61 y LP 2002–2005 PCR, UA, Culture von Baum et al,45 2009 (Germany [CAPNETZ]) Adults ≥18 y with CAP 4,532/928 2,922 Inpatient, 1,610 outpatient Mean 60 y MP 2002–2005 Serology, PCR Wellinghausen et al,46 2006 (Germany [CAPNETZ]) Adults ≥18 y with CAP 546/NR 364 Inpatient, 182 outpatient Median 62 y; CP 2002–2004 PCR Andreo et al,47 2006 (Spain) Adults ≥16 y with CAP 107/39 Inpatient Mean 58.6 y, range 16 y–86 y MP, CP, LP 2000–2001 Serology Capelastegui et al,48 2012 (Spain) Adults ≥18 y with CAP 700/390 276 Inpatient, 424 outpatient Mean 59.7 y MP, CP, LP 2006–2007 Serology, UA CAP in Children Cantais et al,49 2014 (France) Children age 1 mo to 16.5 y with CAP 85/81 Inpatient Median 2.8 y, range 1 mo to 16.5 y MP, CP 2012–2013 PCR Cevey-Macherel et al,50 2009 (Switzerland) Children 2 mo to 5 y with CAP 99/85 Inpatient Mean 29 mo, range 2 mo to 5 y MP, CP 2003–2005 Serology, PCR Don et al,51 2005 (Italy) Children 4 mo to 16 y with CAP 101/66 Inpatient Mean 4.7 y, range 0.3 y–16 y MP, CP 2001–2002 Serology Hamano-Hasegawa et al,52 2008 (Japan) Children <19 y with CAP 1,700/1,316 NR Median 6.1 y for MP; Median 5.4 y for CP, Range 0 y–19 y MP, CP, LP 2005–2006 PCR Jain et al,53 2015a (United States) Children <18 y with CAP 2,222/1,802 Inpatient Median 2 y, range 0 y–17 y MP, CP 2010–2012 PCR Kurz et al,54 2013 (Austria) Children 2 mo to 17 y with CAP 279/190 Inpatient Median 36 mo, range 2 mo to 17 y MP, CP 2005–2008 PCR Laundy et al,55 2003 (England) Children <5 y with CAP 51/25 42 Inpatient, 9 outpatient Median 1.3 y, range 2 wk to 4,8 y MP, CP 2001–2002 PCR Maltezou et al,56 2004e (Greece) Children 6 mo to 14 y with CAP (n = 60), cough >3 weeks (n = 1) or infectious asthma exacerbation (n = 4) 65/19 Inpatient Mean 6 y, range 10 mo to 13 y MP, CP, LP 2001 Serology Numazaki et al,57 2004b (Japan) Children <15 y with CAP 398/383 362 Inpatient, 36 outpatient NR MP, CP 2000–2001 Serology, PCR Tsolia et al,58 2004 (Greece) Children 5y–14 y with CAP 75/58 Inpatient Median 86.5 mo, range 5 y–14 y MP, CP 2003 Serology, PCR Nonpneumonia LRTI Graffelman et al,59 2008f (Netherlands) Adults ≥18 y consulting GP with LRTI; 26 of 129 had CAP 129/84 Outpatient Mean 50 y MP 1998–2001 Serology, PCR, Culture Numazaki et al,57 2004b (Japan) Children <15 y with non-pneumonia LRTI 523/470 436 Inpatient, 87 outpatient NR MP, CP 2000–2001 Serology, PCR Holm et al,29 2007b (Denmark) Adults ≥18 y with non-pneumonia LRTI 316/124 10 Inpatient, 306 outpatient Median 48 y, range 18 y–94 y MP, CP, LP 2002–2003 PCR Various Defilippi et al,60 2008 (Italy) Children with LRTI (acute bronchitis, wheezy bronchitis, pneumonia, or bronchiolitis) admitted to the hospital 886/NR Mean 6.2 y, range 1 mo to 13.5 y MP 2005–2006 PCR AP = community-acquired pneumonia; CP = Chlamydia pneumoniae; LP = Legionella pneumophila; LRTI = lower respiratory tract infection; MP = Mycoplasma pneumoniae; NR = not reported; PCR = polymerase chain reaction; PSI = pneumonia severity index; UA = urine antigen testing.
↵a Total = number of patients included in study. Confirmed = number of patients with a pathogen identified.
↵b Study findings reported separately for patients with CAP and those with non-pneumonic LRTI.
↵c Estimated from median using method of Hozo.61
↵d Age not reported but presumably adult based on hospital and mean age.
↵e Classified as study of CAP if at least 85% of patients in the series were diagnosed with CAP.
↵f In this study, LRTI was defined as abnormal lung sounds plus 2 of 3 of: (1) fever; (2) dyspnea or cough; (3) tachypnea, malaise or confusion.
- Table 3
Characteristics of Studies of the Prevalence of Bordetella pertussis in Outpatients With Prolonged Cough or Non-Pneumonia Lower Respiratory Tract Infection
Author, Year Population Age Year of Data Collection Diagnostic Method Adults and children Park et al,64 2014 (South Korea) Adolescents and adults age 11 y and older presenting to GP with bothersome cough up to 30 days duration Mean 44.3 y 2011–2012 PCR Philipson et al,65 2013 (New Zealand) Children and adults age 5 to 49 y with cough for 2 weeks or longer Range 5–49 y 2011 Serology Riffelmann et al,66 2006 (Germany) Patients presenting to GP with at least 7 days cough Not reported (all ages) 2001–2004 Serology or PCR Children Wang et al,67 2014 (United Kingdom) Children with cough of 2–8 weeks duration presenting to GP Mean 9.6 y 2010–2012 Serology van den Brink et al,68 2014 (Netherlands) Children age 12 y and under with RTI referred for evaluation of suspected BP <12 y 2007–2009 PCR Harnden et al,69 2006 (England, United Kingdom) Children 5–16 y presenting to their GP with cough for at least 2 weeks Mean age 9.4 y, range 5–17 2001–2005 Serology Diez Domingo et al,70 2004 (Spain) Children age 15 y and under presenting with cough for at least 2 weeks Mean 6.2 y, range 0–15 y 2001–2002 Serology Adults Teepe et al,17 2015 (12 European countries) Adults with acute cough <28 days duration presenting to GP Mean age 50 y 2007–2010 Serology or PCR BP = Bordetella pertussis; GP = general practitioner; PCR = polymerase chain reaction.
Symptom or Sign (number of studies) Sensitivity (95%CI) Specificity (95%CI) Positive LR (95%CI) Negative LR (95%CI) Mycoplasma pneumoniaea Cough (5) 0.89
(0.67–0.97)0.15
(0.05–0.37)1.04
(0.95–1.13)0.78
(0.44–1.39)Wheeze (6) 0.25
(0.17–0.36)0.67
(0.56–0.76)0.76
(0.60–0.97)1.12
(1.02–1.23)Coryza (4) 0.32
(0.08–0.72)0.66
(0.28–0.91)0.95
(0.71–1.26)1.03
(0.90–1.17)Crepitations (5) 0.84
(0.78–0.88)0.22
(0.14–0.32)1.06
(0.96–1.18)0.77
(0.52–1.12)Fever (5) 0.53–0.94 0.02–0.43 Rhonchi (4) 0.11–0.74 0.33–0.81 Chest pain (2) 0.08–0.19 0.93–0.97 Diarrhea (2) 0.14–0.21 0.79–0.85 Chlamydophila pneumoniae Adultsb History of cough 0.81 History of sore throat 0.52 Abnormal breathing sounds 0.38 History of fever 0.24 Childrenc Rales 0.85 Fever 0.80 Cough 0.50 Rhinitis 0.30 Tachypnea 0.25 Wheezes 0.20 Rhonchi 0.15 Legionella pneumophilad aOR (95% CI) C-reactive protein >187 mg, L 4.4 (2.0–9.6) Sodium <133 mmo/L 4.5 (2.2–9.0) Temperature >39.4°C 4.3 (1.9–9.8) Platelet count <171 × 103/mL 1.2 (0.6–2.5) Lactate dehydrogenase >225 mmol/L 1.7 (0.4–7.6) Dry cough 0.6 (0.3–1.4) Bordetella pertussise Paroxysmal cough 1.1 (1.1–1.2) 0.52 (0.27–.0) Posttussive emesis 1.8 (1.4–2.2) 0.58 (0.44–0.77) Inspiratory whoop 1.9 (1.4–2.6) 0.78 (0.66–0.93) aOR = adjusted odds ratio from multivariate analysis; CAP = community-acquired pneumonia; LR = likelihood ratio.
↵a Cochrane systematic review of 7 moderate quality studies with a total of 1,491 children, although each sign and symptom was only reported by a subset of studies. Pooled results from 4 to 6 studies are shown for cough, wheeze, coryza, and crepitations; for the other signs and symptoms, a range or the results of a single study are shown.81
↵b Data from a study of 21 adult primary care patients diagnosed with Chlamydophila pneumoniae infection (7 primary infections and 14 with reinfection based on the antibody pattern).82
↵c Data from a study of 20 children hospitalized for CAP and diagnosed with Chlamydophila pneumoniae.83
↵d Data from 37 patients hospitalized with CAP due to Legionella pneumophila. A clinical rule that included 6 variables had an area under the receiver operating curve of 0.73.84
↵e Systematic review of 3 studies with a total of 486 adults and children set in South Korea, United Kingdom, and United States.85
The Article in Brief
Prevalence of Atypical Pathogens in Patients With Cough and Community-Acquired Pneumonia: A Meta-Analysis
Mark H. Ebell , and colleagues
Background In most primary care patients with cough, the cough is caused by a virus. In about 5% of cases, patients with cough have community-acquired pneumonia. In addition, some coughs are caused by an atypical bacterial infection, which has the potential to cause serious complications. This study analyzes existing research to describe the prevalence of atypical pathogens among two groups: 1) patients with cough, acute bronchitis, or lower respiratory tract infection in the ambulatory setting and 2) patients with community-acquired pneumonia.
What This Study Found The study found high rates of atypical bacterial pathogens in patients with acute lower respiratory tract diseases, including cough, bronchitis and community-acquired pneumonia (CAP). Among adults with CAP, 14 percent had an atypical pathogen: 7 percent had mycoplasma pneumoniae, 4 percent had Chlamydophila pneumoniae, and 3 percent had Legionella pneumophila. Among children with CAP, 18 percent had Mycoplasma pneumoniae, only 1 percent had Chlamydophila pneumoniae, and Legionella pneumophila was extremely rare (only one case in 1,765 patients). Among patients with prolonged cough, 9 percent of adults and 18 percent of children had Bordetella pertussis.
Implications
- The findings suggest these conditions are underreported, underdiagnosed and undertreated in current clinical practice.
- The authors call for future research to help clinicians more accurately diagnose these pathogens and determine if and when antibiotic treatment is helpful.
Supplemental Appendixes 1-2
Supplemental Appendixes 1-2
Files in this Data Supplement:
- Supplemental data: Appendixes 1-2 - PDF file
In this issue


Jump to section
Related Articles
Cited By...
- Prevalence of atypical pathogens in patients with severe pneumonia: a systematic review and meta-analysis
- Application of a Chlamydia trachomatis Expression System To Identify Chlamydia pneumoniae Proteins Translocated into Host Cells
- In Vitro and Intracellular Activities of Omadacycline against Legionella pneumophila
- Response: Re: Clinical Diagnosis of Bordetella Pertussis Infection: A Systematic Review
- Clinical Diagnosis of Bordetella Pertussis Infection: A Systematic Review
- In This Issue: Social Context; Disease Causes