
Article Figures & Data
Figures
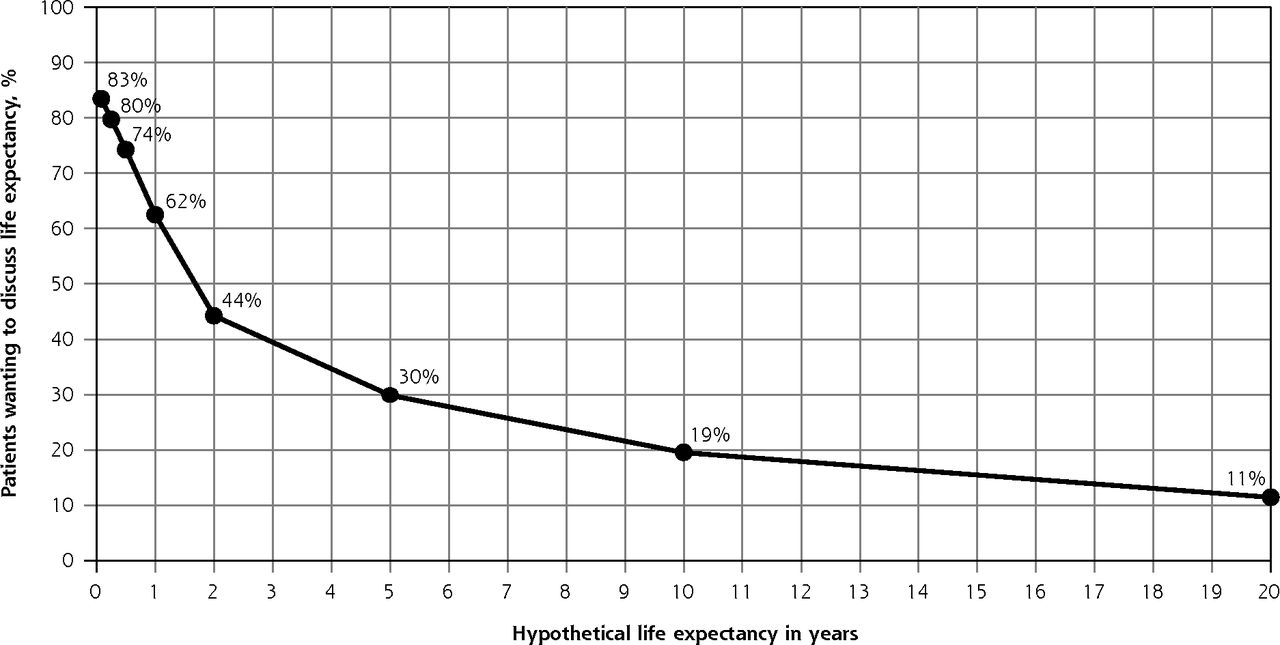
- Figure 1
Preferences for discussing life expectancy at various time points.

Tables
Characteristic All (N = 878) Preference for Discussing Life Expectancy Wanted to Discussa
(n = 363)Did Not Want to Discussa
(n = 515)P Value Age, mean (SD), y 73.4 (6.1) 73.5 (6.1) 73.3 (6.2) .70 Female sex, No. (%) 462 (55.1) 177 (51.9) 285 (57.4) .20 Race, No. (%) White 575 (77.2) 261 (80.9) 314 (74.7) .15 African American 214 (8.7) 68 (6.3) 146 (10.4) Other 89 (14.1) 34 (12.8) 55 (14.9) Educational level, No. (%) <High school 61 (14.4) 13 (9.6) 48 (17.7) <.001 High school 268 (33.2) 80 (26.2) 188 (37.9) <4-year college 243 (24.2) 104 (25.9) 139 (23.0) College graduate or postgraduate degrees 306 (28.3) 166 (38.2) 140 (21.5) Health literacy,b,36 mean (SD) 13.1 (2.1) 13.2 (2.2) 13.0 (2.0) .33 Numeracy,c,37 mean (SD) 13.8 (3.5) 14.4 (3.4) 13.4 (3.6) <.001 Predicted life expectancy,31 No. (%) >10 years 631 (68.9) 262 (69.7) 369 (68.4) .76 <10 years 197 (31.1) 81 (30.3) 116 (31.6) Self-perceived life expectancy, No. (%) ≥10 years 762 (83.4) 322 (84.7) 440 (82.5) .54 <10 years 110 (16.6) 41 (15.3) 69 (17.5) Belief that life expectancy can be predicted,21 No. (%) Disagree 446 (47.3) 155 (39.5) 291 (52.6) <.001 Neutral 308 (38.6) 132 (39.1) 176 (38.2) Agree 122 (14.2) 74 (21.4) 48 (9.2) Has had life-threatening illness,32 No. (%) 252 (29.3) 120 (33.4) 132 (26.5) .09 Has discussed life expectancy of a loved one,32 No. (%) 240 (24.8) 156 (40.7) 84 (14.0) <.001 Complete trust in doctor,35 No. (%) Disagree 81 (8.6) 26 (7.0) 55 (9.7) .53 Neutral 231 (27.6) 98 (27.6) 133 (27.6) Agree 565 (63.8) 238 (65.4) 327 (62.7) Preferred decision-making role, 33 No. (%) Make own decisions 533 (62.5) 220 (62.0) 313 (62.9) .83 Shared or leave to doctor 337 (37.5) 141 (38.0) 196 (37.1) Religion is important,34 No. (%) 633 (70.8) 242 (65.5) 391 (74.5) .02 ↵a Responses to the hypothetical scenario. See Methods for description.
b Possible range 3 to 15; higher scores indicate better health literacy.
c Possible range 3 to 18; higher scores indicate better numeracy.
Characteristic Unadjusted Odds Ratio (95% CI) P Value Adjusted Odds Ratio (95% CI)a P Value Age, per year 1.01 (0.98-1.03) .62 – – Female sex 0.80 (0.61-1.05) .11 – – Race .05 .55 White Ref Ref Black 0.56 (0.33-0.93) 0.80 (0.45-1.43) Other 0.79 (0.53-1.17) 0.82 (0.53-1.28) Education <.001 .004 <High school Ref Ref High school 1.27 (0.80-2.01) 1.09 (0.66-1.82) Some college 2.06 (1.28-3.33) 1.66 (0.96-2.85) >College 3.26 (2.05-5.19) 2.18 (1.25-3.80) Health literacy,36 per point 1.05 (0.98-1.12) .15 – – (scale 3-15) Numeracy,37 per point (scale 3-18) 1.09 (1.05-1.14) <.001 1.04 (0.99-1.09) .11 Predicted 10-year mortalityb,31 0.81 (0.46-1.43) .47 – – Self-perceived 10-year mortalityb 1.08 (0.62-1.87) .78 – – Doctors can accurately predict <.001 <.001 life expectancy21 Disagree Ref Ref Neutral 1.36 (1.01-1.83) 1.59 (1.14-2.21) Agree 3.10 (2.05-4.69) 3.06 (1.93-4.86) Has had life-threatening illness32 1.39 (1.04-1.86) .03 1.50 (1.07-2.09) .02 Has discussed life expectancy 4.22 (3.05-5.85) <.001 3.98 (2.82-5.62) <.001 of a loved one32 Complete trust in doctor35 .36 Disagree Ref – – Neutral 1.38 (0.80-2.37) – – Agree 1.44 (0.87-2.39) – – Prefers shared decision making or leaving decision to doctor (vs making own decisions)33 1.04 (0.79-1.37) .79 – – Religion is important34 0.65 (0.48-0.87) .004 0.69 (0.49-0.97) .03 Note: Preference expressed in the hypothetical patient scenario. See Methods for description.
Ref = reference group.
↵a Only variables having P ≤.05 in univariate analysis were included in multivariate analysis.
↵b Analyzed as continuous variables with range of 0 to 1 in the regression model. For example, one person’s 10-year mortality risk may be 0.02 or 2%, and another person’s 10-year mortality risk may be 0.92 or 92%. Here, the odds ratio is per 1 unit of mortality risk, ie, comparing 100% mortality risk with 0%.
Reason/Preference Wanted to Discuss Life Expectancya (n = 363) Did Not Want to Discuss Life Expectancya (n = 515) Reason for wanting to discuss life expectancyb – Help patient better plan life 270 (72.3) Important to be honest and open 151 (42.2) Other 16 (4.6) Reason for not wanting to discuss life expectancyb – Doctors cannot predict life expectancy 302 (56.7) May worry or depress patient 272 (52.2) Other 43 (9.7) Acceptable for the doctor to offer to discuss life expectancy? Yes, as long as I can say no 344 (94.8) 222 (40.1) No, the doctor should not have brought up the topic at all 16 (5.2) 291 (59.9) Want the doctor to discuss life expectancy with family or friends? Yes 198 (57.9) 65 (12.3) No 164 (42.1) 450 (87.7) If the doctor recommends stopping cancer screening due to limited life expectancy of the patient, should doctor then discuss life expectancy with the patient? Yes 305 (84.5) 114 (21.3) No 58 (15.5) 401 (78.7) How should the doctor describe life expectancy of about 5 years? In the range of a few years 174 (49.2) 255 (48.7) About a 50-50 chance to live another 5 years 188 (50.8) 252 (51.3)
Supplemental Appendix
Supplemental Appendix
Files in this Data Supplement:
- Supplemental data: Appendix - PDF file
The Article in Brief
Older Adults' Preferences for Discussing Long-Term Life Expectancy: Results From a National Survey
Nancy Li Schoenborn , and colleagues
Background Clinical practice guidelines recommend incorporating long-term life expectancy to inform a number of decisions in primary care. We aimed to examine older adults' preferences for discussing life expectancy in a national sample.
What This Study Found A majority of older adults do not wish to discuss life expectancy when presented with a hypothetical scenario on the topic. In a survey of communication around life expectancy, 878 adults age 65 years and older received a description of a hypothetical patient with limited life expectancy who is not imminently dying. Participants were asked, as the hypothetical patient, if they would like to talk with the doctor about how long they might live, if it was acceptable for the doctor to offer such discussion, whether they would want the doctor to discuss life expectancy with family or friends, and when life expectancy should be discussed. Fifty-nine percent of participants (n = 515) did not want to discuss how long they might live in the presented scenario. Among these, 291 participants did not think that the doctor should offer discussion, and 450 participants did not want the doctor to discuss life expectancy with family or friends. As estimated life expectancy increased, fewer participants felt that it should be discussed. Fifty-six percent of participants (n = 478) only wanted to discuss life expectancy if it were less than two years. Factors associated with wanting to discuss life expectancy included higher educational levels, belief that doctors can predict life expectancy, and past experiences with either a life-threatening illness or with discussing life expectancy of a loved one. Reporting that religion is important was associated with lower odds of choosing to discuss life expectancy.
Implications
- Overall, this research--the first national study to examine these questions--found that long-term life expectancy can be an important factor in health care decisions for older adults, but whether, when, and how to communicate with patients about it is not clear.
- The authors suggest that strategies to address this topic include assessing patient factors associated with willingness to discuss life expectancy and offering the discussion when closer to the patient's final year of life.


Jump to section
Related Articles
Cited By...
- "It Cant Hurt!": Why Many Patients With Limited Life Expectancy Decide to Accept Lung Cancer Screening
- Attitudes of multimorbid patients to surviving future acute illness and subsequent functional disability: A systematic review
- Exploring how GPs discuss statin deprescribing with older people: a qualitative study
- In This Issue: Continuity, Relationships, and the Illusion of a Steady State