
Abstract
PURPOSE Total and out-of-pocket visit expenditures for primary care physician visits may affect how primary care is delivered. We determined trends in these expenditures for visits to US primary care physicians.
METHODS Using the 2002-2017 Medical Expenditure Panel Survey, we ascertained changes in total and out-of-pocket visit expenditures for primary care visits for Medicare, Medicaid, and private insurance. We calculated mean values for each insurer using a generalized linear model and a 2-part model, respectively.
RESULTS Analyses were based on 750,837 primary care visits during 2002-2017. Over time, the proportion of primary care visits associated with private insurance or no insurance decreased, while Medicare- or Medicaid-associated visits increased. The proportion of visits with $0 out-of-pocket expenditure increased, primarily from an increase in $0 private insurance visits. Total expenditure per visit increased for private insurance and Medicare visits, but did not notably change for Medicaid visits. Out-of-pocket expenditures rose primarily from increases in private insurance visits with higher expenditures of this type. Medicare and Medicaid had minimal change in out-of-pocket expenditure per visit.
CONCLUSIONS Between 2002 and 2017, mean total expenditures and out-of-pocket expenditures increased for primary care visits, but at notably lower rates than those previously documented for emergency department visits. A rise in total expenditure per visit was identified for private insurance and Medicare, but not for Medicaid. Out-of-pocket expenditures increased marginally related to changes in out-of-pocket expenditures for private insurance visits. We would expect increasing difficulty with primary care physician access, particularly for Medicaid patients, if the current trends continue.
- primary care
- outpatients
- office visits
- health care delivery
- health services research
- cost
- health insurance
- health expenditures
- health policy
- economics, medical
- vulnerable populations
INTRODUCTION
Previous research has not characterized changes over time in total and out-of-pocket expenditures for primary care physician visits among different insurance types in the United States. Research in the inpatient setting, however, has shown that total expenditures for inpatient visits are greater for private insurance than for public insurance, and this gap is expected to widen over time.1 Similarly, total expenditures for emergency department visits increased nearly threefold for private insurance but did not increase for either Medicare or Medicaid between 1999 and 2016.2,3 Annual increases in out-of-pocket expenditures for emergency department visits during roughly the same time period were much greater for private insurance than for Medicare or Medicaid.3
Identifying changes over time in total and out-of-pocket expenditures for primary care visits for individuals with Medicare, Medicaid, and private insurance may help explain recent changes in the overall population and in specific populations (ie, those covered by different insurance types) served by primary care. For example, differing payment structures could explain, in part, why the number of individuals in the United States who visited a primary care physician at least once in a given month decreased between 2002 and 2016.4 Although research has previously demonstrated that physician office visits among adults aged 18 to 64 years paid by private insurance and Medicare had higher total expenditures and out-of-pocket expenditures than those paid by Medicaid during 2014-2015,5 determining whether this gap widened over time for primary care visits may help us better understand problems Medicaid recipients have had with primary care access.6 Analysis of changes in total and out-of-pocket expenditures over time for primary care visits by insurance type may also help explain the phenomenon of hospital systems opening urgent care centers in wealthier areas with higher levels of private insurance.7 Finally, comparing changes in primary care expenditures with those in emergency department expenditures may offer insights into how health systems have responded to and might respond to differing payment structures for these 2 sectors of patient care.
With all this in mind, we undertook a study to compare how total expenditures and out-of-pocket expenditures for primary care visits changed between 2002 and 2017 for Medicare, Medicaid, and private insurance.
METHODS
We performed a repeated cross-sectional analysis of office-based and outpatient files for individuals of all ages from the 2002-2017 Medical Expenditure Panel Survey (MEPS).8,9 The MEPS is sponsored by the Agency for Healthcare Research and Quality and is nationally representative of the US noninstitutionalized population. The survey annually samples about 15,000 households within 2 overlapping panels every 2 years, interviewing each panel 5 times over 2 years. The MEPS collects payment information for medical expenses directly from interviewees and supplements this information with data gathered from providers.
Our unit of analysis was office-based or outpatient visits to physicians identified as primary care physicians (general practice, family medicine, general internal medicine, general pediatrics, and geriatrics practitioners). We excluded telephone-call visits, surgeries, and visits associated with a flat fee (ie, visits paid with a fixed dollar amount included in a package of services, which comprised less than 0.5% of our sample).
Out-of-pocket expenditures (the sum of deductibles and copayments made by individuals) and total visit expenditures (the sum of out-of-pocket expenditures and all payments by third parties) for individual visits were our study outcomes. Capitation payments are imputed by the MEPS, which treats total charges as the primary variable.
We assigned visits to private insurance, Medicare, Medicaid, uninsured, or “other payer” insurance categories through a multistep process. First, we assigned visits to private insurance, Medicare, or Medicaid using the insurance type that paid the greatest amount for the visit.2,3 Second, we assigned visits with no Medicare, Medicaid, or private insurance payments to private insurance if the individual reported having private insurance during the month of the visit. We performed this step given the rise in high-deductible health plans over the last decade.10 Third, we assigned visits not already assigned to Medicare, Medicaid, or private insurance in the first 2 steps to uninsured if the individual who made the visit reported no insurance during the year of the visit. Fourth, we assigned all visits that remained after the first 3 steps to “other payers.”
For our initial analysis, we determined the proportion of visits with $0 out-of-pocket expenditures by insurer. We also identified the 10th, 25th, 50th, 75th, and 90th percentile per visit for total expenditure and out-of-pocket expenditure amounts for 1-year and 2-year intervals between 2002 through 2017. To better visualize the data, we then created scatterplots of total expenditure per visit and out-of-pocket expenditure per visit by insurer, which included fractional polynomials. We excluded several outliers when graphing scatterplots so that their scales were not so large as to make appreciating the year-to-year trends difficult. No values were excluded from the fractional polynomials.
Mean total expenditures per visit and out-of-pocket expenditures per visit over time for each insurance type were then modeled using 2 separate models. We modeled mean total expenditure per visit using a generalized linear model with a log link function and a gamma distribution. We modeled mean out-of-pocket expenditure per visit with a 2-part model (logistic regression analysis followed by a generalized linear model with gamma distribution and a log link function) because of the large number of $0 out-of-pocket expenditure visits. The models for total expenditures and out-of-pocket expenditures included the following variables: radiographs, laboratory tests, magnetic resonance imaging and computed tomography scans, electrocardiograms, insurance type, year (separately as a continuous and as a categorical variable), and an interaction term between insurance type and year. After running each model, we used postprediction average marginal effects (treating year as a continuous variable) to calculate mean annual increases in total expenditures and out-of-pocket expenditures for each insurance type.
We adjusted all dollar amounts to 2017 US dollars using the Consumer Price Index11 and applied complex survey weights to make our findings applicable to the US noninstitutionalized population. We recoded a single Medicaid visit out-of-pocket expenditure outlier from 2002 to $1,800 (one-tenth of its initial value). We used Stata version 15 (StataCorp LLC) for all analyses.
The OhioHealth Institutional Review Board ruled this study exempt.
RESULTS
Analyses were based on 750,837 primary care visits during 2002-2017. The proportion of visits associated with private insurance and no insurance decreased during this period, whereas the proportion of visits associated with Medicare or Medicaid increased. The proportion of visits with $0 out-of-pocket expenditure increased from 39.1% (95% CI, 37.8%-40.5%) in 2002 to 56.1% (95% CI, 54.7%-57.5%) in 2017. Visits with $0 out-of-pocket expenditures increased the most for private insurance, from 18.9% (95% CI, 17.6%-20.3%) in 2002 to 37.8% (95% CI, 36.2%-39.4%) in 2017 (Figure 1).
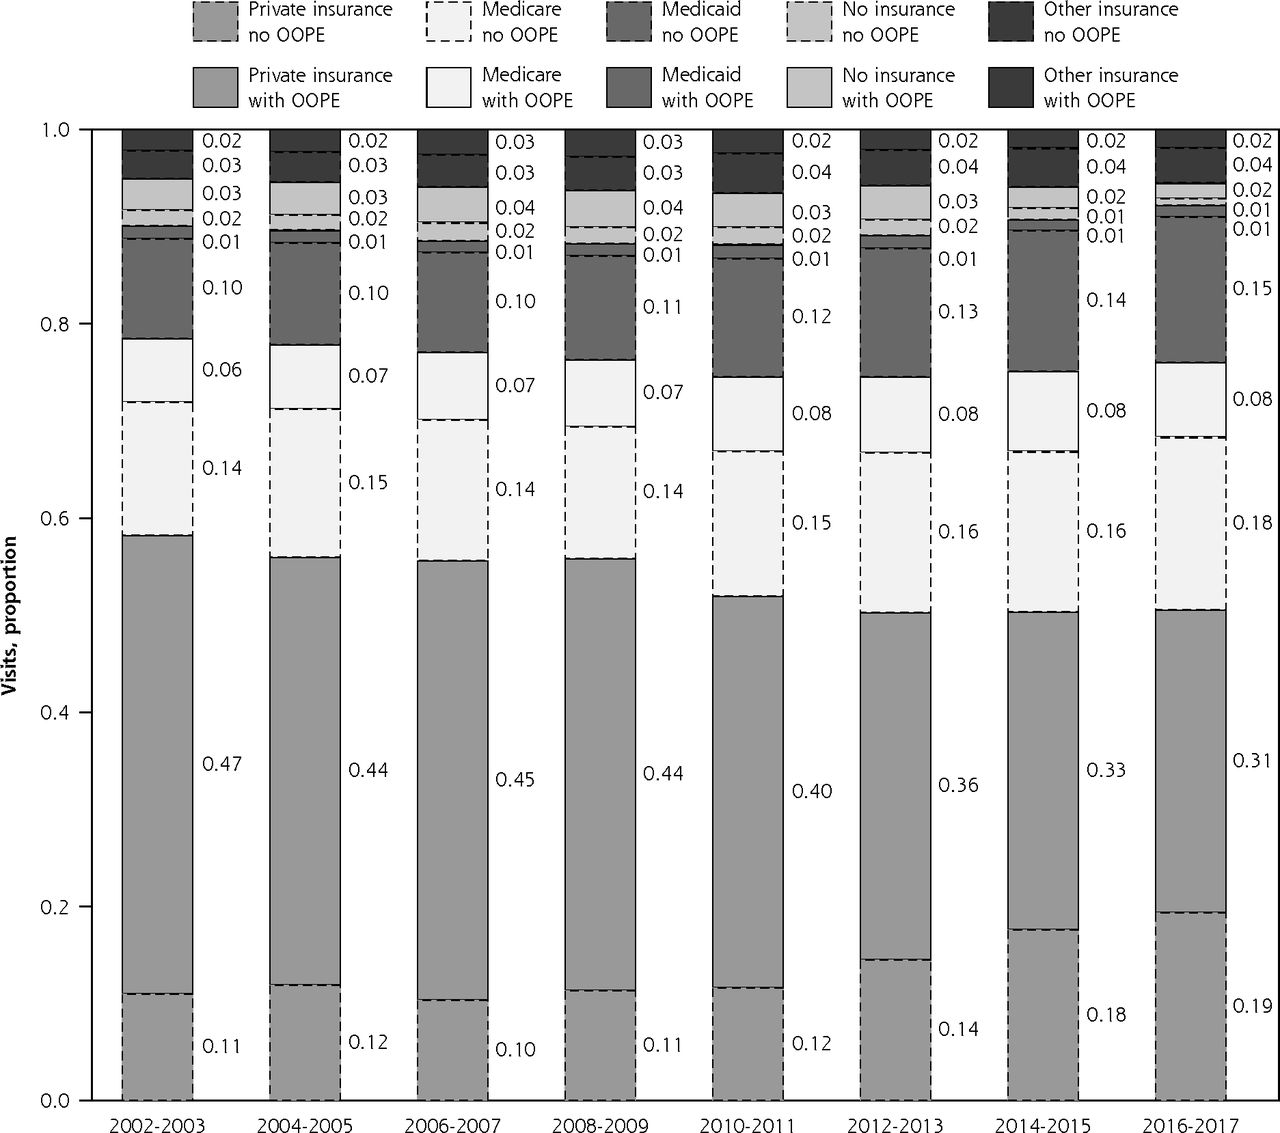
Proportion of primary care visits by insurance type and out-of-pocket expenditure, 2002-2017.
OOPE = out-of-pocket expenditure.
Notes: Categorization of visits is detailed in Methods. Darker bars represent $0 out-of-pocket expenditure visits, whereas lighter bars represent visits with an out-of-pocket expenditure.
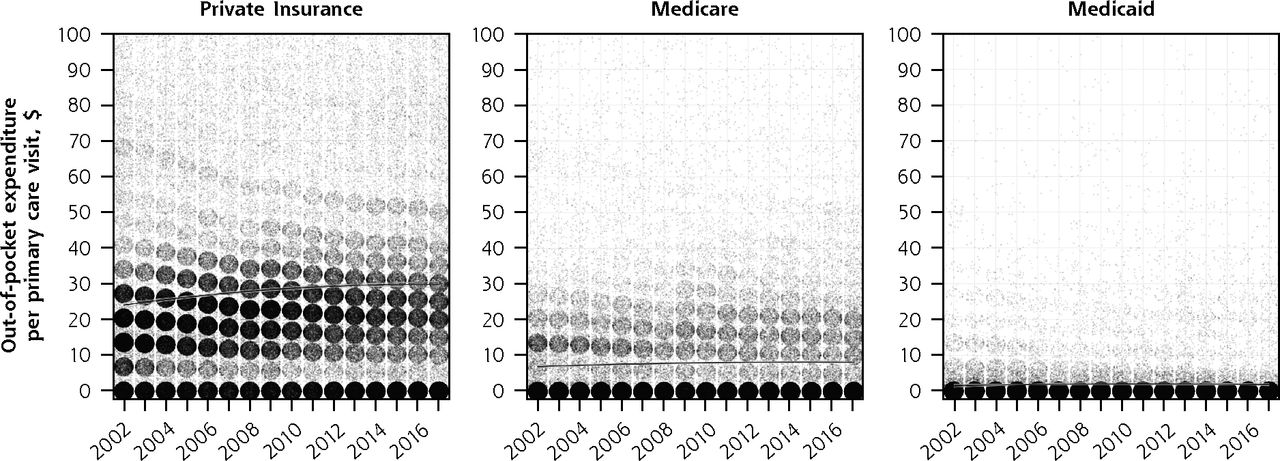
Between 2002 and 2017, the 10th, 25th, 50th, 75th, and 90th percentile total expenditure per visit for private insurance increased. The 25th percentile out-of-pocket expenditures for private insurance decreased during that period, dropping to $0 in 2012, whereas the 90th percentile increased over time. Medicare total expenditures per visit also increased at the 10th, 25th, 50th, 75th, and 90th percentile levels, but out-of-pocket expenditures had only small changes. Outside of some changes to its 90th percentile total visit expenditures, Medicaid’s total visit expenditure and out-of-pocket expenditure changed minimally. Few visits associated with Medicaid had any out-of-pocket expenditure (Table 1 and Supplemental Figure 1, available at https://www.AnnFamMed.org/content/18/5/430/suppl/DC1/). Similar patterns are seen in the scatterplots and fractional polynomials in Figure 2 and Figure 3.
Total Visit Expenditure and Out-of-Pocket Expenditure by Insurance Type, 2002-2017
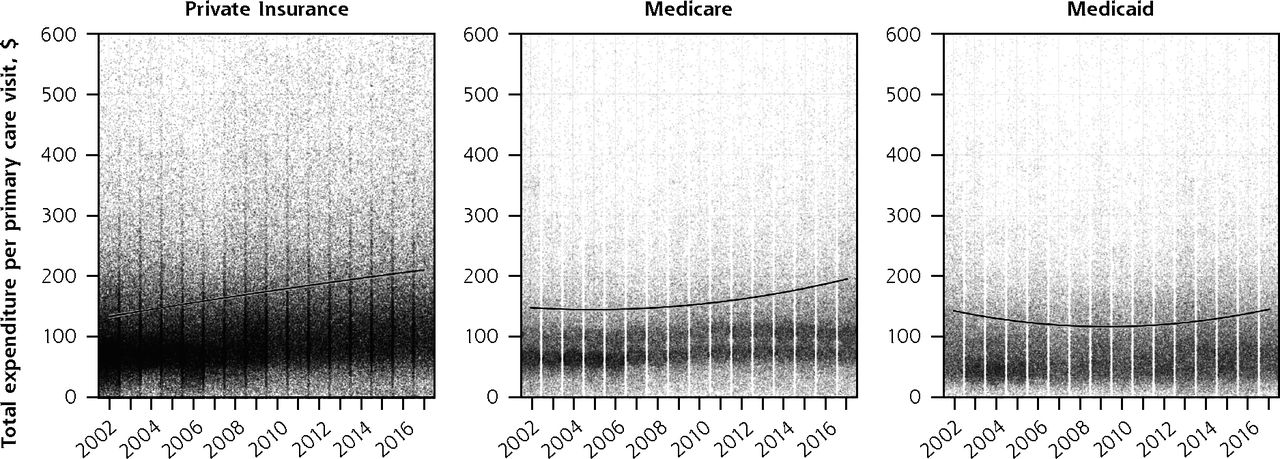
Scatterplots of total expenditure per primary care visit, 2002-2017.
Notes: The y axis represents dollar amounts adjusted to 2017 US dollars using the Consumer Price Index. The line represents the fractional polynomial.

Scatterplots of out-of-pocket expenditure per primary care visit, 2002-2017.
Notes: The y axis represents dollar amounts adjusted to 2017 US dollars using the Consumer Price Index. The line represents the fractional polynomial.
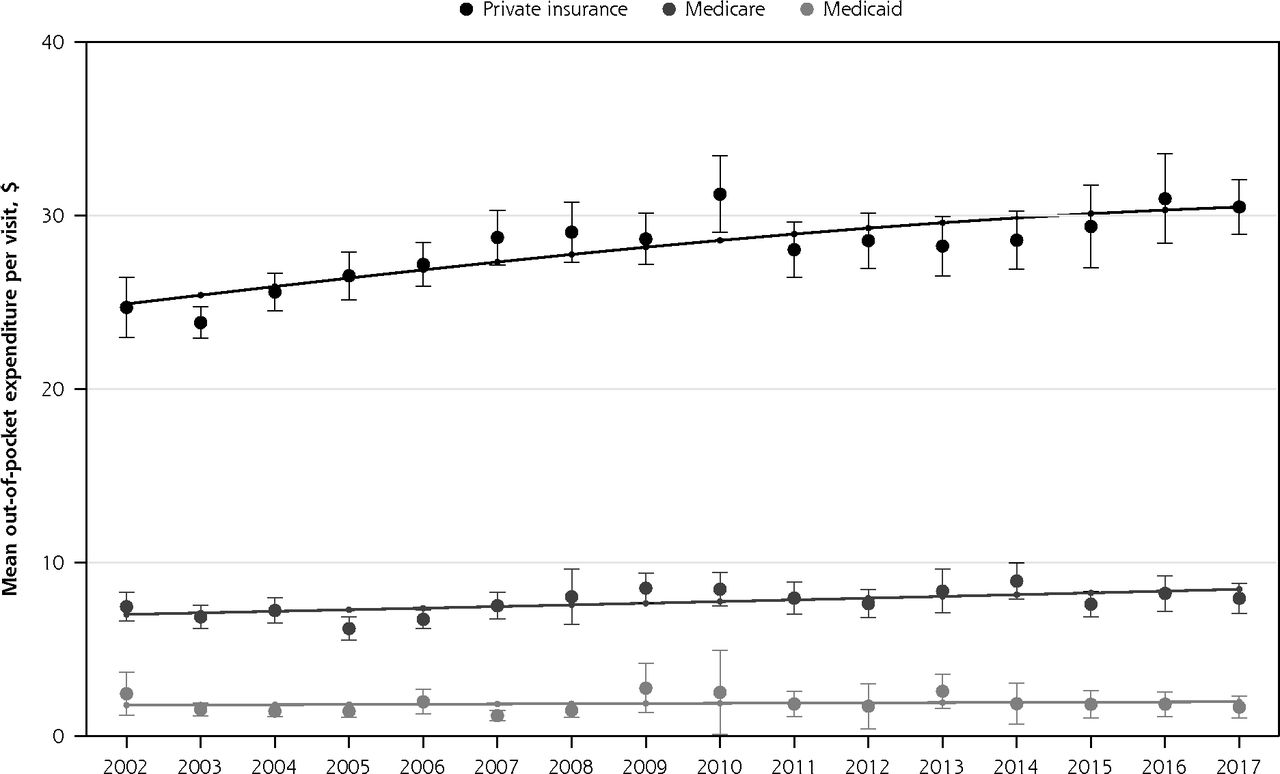
With use of postprediction average marginal effects, mean total expenditures for visits increased significantly for private insurance (by $5.36 per year; 95% CI, $4.67 to $6.06; P <.001) and Medicare (by $3.19 per year; 95% CI, $2.39 to $3.99; P <.001), but not for Medicaid (by $0.38 per year; 95% CI, –$0.21 to $0.98; P = .20) (Figure 4). Total expenditure per visit began diverging for private insurance and Medicare as compared with Medicaid around 2007-2008 (Figure 5). Mean out-of-pocket expenditures for visits also increased significantly for private insurance (by $0.37 per year; 95% CI, $0.26 to $0.49; P <.001) and Medicare (by $0.10 per year; 95% CI, $0.04 to $0.16; P = .001), but not Medicaid (by $0.01 per year; 95% CI, –$0.03 to $0.06; P = .58).
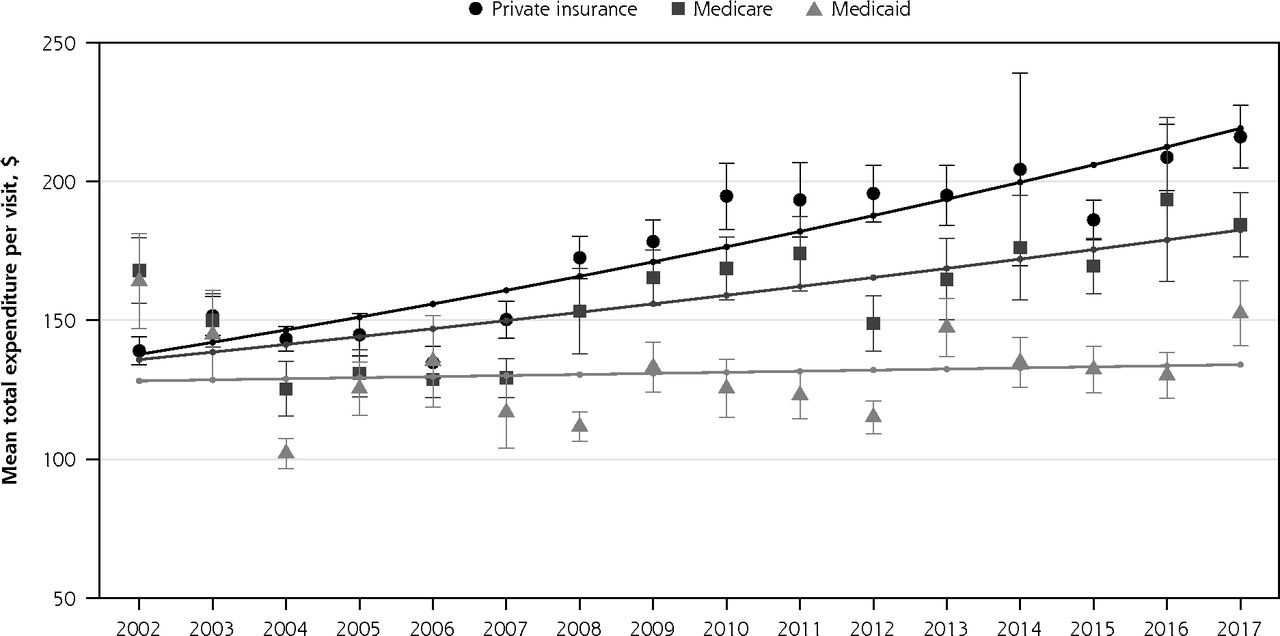
Mean total expenditure per visit by insurance type, 2002-2017.
Notes: Figure represents the postprediction average marginal effects derived from two generalized linear models (one with year as a continuous variable and one with year as a categorical variable). Each model included insurance type, year as either a continuous or categorical variable, an interaction term between insurance type and year, electrocardiograms, radiographs, magnetic resonance imaging and computed tomography scans, and laboratory tests. The 95% CIs are plotted only for the categorical model. Total visit expenditures are adjusted to 2017 US Dollars using the Consumer Price Index.

Mean out-of-pocket expenditure per visit by insurance type, 2002-2017.
Notes: The figure represents the post-predication average marginal effects derived from two 2-part models (one with year as a continuous variable and one with year as a categorical variable). Each model included insurance type, year as either a continuous or categorical variable, an interaction term between insurance type and year, electrocardiograms, radiographs, magnetic resonance imaging and computed tomography scans, and laboratory tests. The 95% CIs are plotted only for the categorical model. Total visit expenditures are adjusted to 2017 US Dollars using Consumer Price Index.
DISCUSSION
During a recent 15-year period, the proportion of primary care visits paid for by private insurance decreased, whereas the proportion of visits paid for by Medicare and Medicaid increased. Total expenditures per primary care visit increased primarily among those covered by private insurance or Medicare, but Medicaid visits had minimal change during 2002-2017. Total expenditure per visit between Medicaid and both private insurance and Medicare began diverging around 2007-2008. We also found that although the proportion of primary care visits paid for by private insurance with no out-of-pocket expenditure increased, visits paid for by private insurance with at least some out-of-pocket expenditure generally had higher amounts over time. The out-of-pocket expenditure per visit showed minimal change for Medicare and Medicaid visits.
Findings in Context
The increased proportion of primary care visits with zero out-of-pocket expenditure likely resulted from provisions of the Patient Protection and Affordable Care Act that removed copays for preventive care, including wellness examinations.12 Higher out-of-pocket expenditures among private insurance primary care visits with at least some copay perhaps stemmed from the recent shift to high-deductible health plans.10 The increase in the proportion of primary care visits paid for by Medicaid is likely secondary to the Great Recession followed by Medicaid expansion.
When we contextualize our findings with similar data from emergency department visits, which are arguably primary care’s functional counterpoint within the US health care system, we find that growth in emergency department total expenditure per visit dwarfed the growth of primary care total expenditure per visit for private insurance (an increase from approximately $800 in 2002 to $1,700 per visit in 2015 compared with an increases from approximately $140 in 2002 to $200 in 2015).2 Multiple factors could explain this change and include the strong bargaining positions of hospitals and primary care physicians relative to private insurers13 as well as the increase in use of imaging and technology during emergency department visits.14 Importantly, although we previously found the growth in total expenditures per visit was markedly greater for private insurance than for Medicare for emergency department care,2 we found a notably smaller difference in annual growth in total expenditures for primary care between Medicare and private insurance in this study. When absolute dollar amounts were considered, private insurance out-of-pocket expenditures also increased decidedly more for emergency department visits (from approximately $75 per visit in 2002 to $200 per visit in 2016) than for primary care, which may be one way that insurers have attempted to incentivize patients to use primary care. It is also unlikely that changes in out-of-pocket expenditures for primary care visits have caused the decades-long decline in primary care physician visit rates noted by previous research,4,15 given that increases in out-of-pocket payments over time were minimal for private insurance, very minimal for Medicare, and nonexistent for Medicaid.
Policy makers in Oregon and Rhode Island have passed legislation requiring higher rates of spending toward primary care, while some states such as Vermont, West Virginia, and Colorado have looked into other ways to increase primary care spending.16,17 The intended effect of these state-level efforts is presumably to increase reimbursement for primary care, which will, in turn, lead to increased visits or contact with primary care clinicians. We suspect, however, that the actual effect that these interventions have in improving disparities to primary care access and overall primary care access will be a function of how the increased funding for primary care is allocated. To explain, one interpretation of our results is that differential changes over time in total expenditures per visit by insurer are likely a cause of the primary care access disparities that currently exist among patients with different insurance types. In 1971, Julian Tudor Hart described the inverse care law, which asserts that “the availability of good medical care tends to vary inversely with the need of the population served.”18 Hart posited that the main causative force for this law was the pressures of the free market and that the “more health services are removed from the force of the market, the more successful we can be in redistributing care away from its ‘natural’ distribution in a market economy.”18 In this light, simply increasing the proportion of health care spending dedicated to primary care spending is unlikely to result in a more equitable distribution of medical care in the United States if the current blend of free market forces and regulation unique to the country remain the same as they have been over the last decade. For example, if the trends we observed continue, we would not be surprised to see more nonphysician clinicians providing primary care in clinics that primarily serve Medicaid patients,19 along with greater challenges in access to care in areas that have high levels of individuals with this type of insurance.
Limitations
Our study has numerous limitations. Potential underreporting of office visits by survey participants may have biased our results if there were differences by insurance type. Improved visit reporting began in 2013 from changes in MEPS methodology, which may affect the validity of comparisons between years before and after 2013.20 Results also may have been influenced by incorrect allocation of insurer type to primary care visits because of MEPS survey methodology, as well as erroneous assignment to insurers from our own study methodology. The study’s findings are not necessarily generalizable to primary care visits with procedures. There was inadequate adjustment for visit intensity over time. Further changes in the MEPS survey methodology in the 2017 final interview21 might also have affected our results. Finally, the imputed payments per member per month to primary care clinics or health systems could have increased measurement error.
Conclusions
Between 2002 and 2017, mean total expenditures and out-of-pocket expenditures increased for primary care visits, but at notably lower rates than those previously documented for emergency department visits. Increases in the total expenditure per visit were identified for private insurance and Medicare, but not for Medicaid. Out-of-pocket expenditures rose marginally related to changes in out-of-pocket expenditures for private insurance visits. We would expect increasing difficulty with primary care physician access, particularly for Medicaid patients, if the current trends continue.
Footnotes
Conflicts of interest: authors report none.
To read or post commentaries in response to this article, see it online at https://www.AnnFamMed.org/content/18/5/430.
Author contributions: M.E.J. conceived the study, had full access to all study data, and takes responsibility for the integrity of the data and the accuracy of the data analysis. M.E.J. and J.D.Y.Y. analyzed the data, drafted the manuscript, and contributed substantially to its revision.
Supplemental materials: Available at https://www.AnnFamMed.org/content/18/5/430/suppl/DC1/.
- Received for publication October 30, 2019.
- Revision received March 4, 2020.
- Accepted for publication March 5, 2020.
- © 2020 Annals of Family Medicine, Inc.
In this issue


Jump to section
Related Articles
Cited By...
- No citing articles found.