
Abstract
PURPOSE We undertook a study to examine national trends in potentially preventable hospitalizations—those for ambulatory care–sensitive conditions that could have been avoided if patients had timely access to primary care—across 3,200 counties and various subpopulations of older adults in the United States.
METHODS We used 2010-2014 Medicare claims data to examine trends in potentially preventable hospitalizations among beneficiaries aged 65 years and older and developed heat maps to examine county-level variation. We used a generalized estimating equation and adjusted the model for demographics, comorbidities, dual eligibility (Medicare and Medicaid), ZIP code–level income, and county-level number of primary care physicians and hospitals.
RESULTS Across the 3,200 study counties, potentially preventable hospitalizations decreased in 327 counties, increased in 123 counties, and did not change in the rest. At the population level, the adjusted rate of potentially preventable hospitalizations declined by 3.45 percentage points from 19.42% (95% CI, 18.4%-20.5%) in 2010 to 15.97% (95% CI, 15.3%-16.6%) in 2014; it declined by 2.93, 2.87, and 3.33 percentage points among White, Black, and Hispanic patients to 14.96% (95% CI, 14.67%-15.24%), 17.92% (95% CI, 17.27%-18.58%), and 17.10% (95% CI, 16.25%-18.0%), respectively. Similarly, the rate for dually eligible patients fell by 3.71 percentage points from 21.62% (95% CI, 20.5%-22.8%) in 2010 to 17.91% (95% CI, 17.2%-18.7%) in 2014. (P <.001 for all).
CONCLUSIONS During 2010-2014, rates of potentially preventable hospitalization did not change in the majority of counties. At the population level, although the rate declined among all subpopulations, dually eligible patients and Black and Hispanic patients continued to have substantially higher rates compared with non–dually eligible and White patients, respectively.
- Medicare
- potentially preventable hospitalization
- prevention quality indicators
- trends
- health care use
- vulnerable populations
- healthcare disparities
- access to health care
- health services
INTRODUCTION
The Agency for Healthcare Research and Quality (AHRQ) has developed potentially preventable hospitalizations and other prevention quality indicators as measures of access to and quality of primary care.1 These hospitalizations capture admissions for ambulatory care–sensitive conditions (ACSCs) that could have been avoided if patients had had timely access to primary care.2 Potentially preventable hospitalizations are costly and negatively affect the health and well-being of individuals, particularly older adults.3 By 2030, 1 in every 5 Americans will be 65 years of age and older. Changes in potentially preventable hospitalization rates may signal improvement or worsening in access to or quality of primary care among older adults.4
Prior research has shown increasing racial and socioeconomic gaps in rates of potentially preventable hospitalizations. For example, examining 2003-2009 trends, Mukamel et al5 showed that rates declined among White patients but did not change among Black patients. Because of policy efforts in the last decade, hospitalization has consistently declined in the United States.6,7 Since 2012, the Centers for Medicare & Medicaid Services have initiated a series of incentives to reduce potentially preventable hospitalizations.8 Examination of trends in these hospitalizations among various subpopulations of older adults who may be at elevated risk for adverse health events and across counties can inform policies that target specific populations.
With use of 2010-2014 Medicare claims data, our primary aim was to examine recent national trends in potentially preventable hospitalization rates among subgroups of older adults in the United States. Our secondary aim was to examine trends in these hospitalizations at the county level across the country. We hypothesized a declining but different potentially preventable hospitalization trend among various socioeconomic and racial/ethnic minorities. Furthermore, we hypothesized that there would be large variations in the change of rates across counties.
METHODS
Data Source and Study Sample
We used a 20% random sample of Medicare fee-for-service beneficiaries and 2010-2014 administrative claims. We extracted data from the Beneficiary Summary file, Medicare Provider and Analysis Review (MedPAR) file, Outpatient file, Carrier (office visits) file, and Part D event file. Claims data included information on diagnoses from International Classification of Diseases, Ninth Revision, Clinical Modification (ICD-9-CM) codes, and on procedures from Current Procedural Terminology 4 (CPT-4) codes and the Healthcare Procedural Coding System (HCPCS). Enrollment data included indicators for enrollment in Medicare Managed Care and dual eligibility (Medicare and Medicaid). The Beneficiary Summary file also included limited demographic information on age, sex, and race/ethnicity, as well as ZIP code for place of residence. We merged claims data for our Medicare fee-for-service cohort with the ZIP code–level 2010 US Census and the 2016 Area Resource File (ARF). The Census data included ZIP code–level socioeconomic data, and the ARF included data on number and characteristics of health care professionals, health facilities, environment, and population characteristics at the county level. The study was deemed exempt by the institutional review board at our institution.
Sample Selection
We included in our sample all beneficiaries with annual enrollment in fee-for-service and Medicare Parts A, B, and D between 2010 and 2014 who experienced a hospitalization. Beneficiaries enrolled in Medicare Managed Care were excluded because Medicare claims do not provide an exhaustive capture of their service use during enrollment. Individuals aged younger than 65 years, with disabilities, or having end-stage renal disease were also excluded because the purpose of this study was to examine potentially preventable hospitalizations among a population norm of older adults. Furthermore, we excluded patients who died or switched to Medicare Managed Care during the year because we did not have their full-year data and their inclusion might have led to underestimation of results.
Supplemental Figure 1, available at https://www.AnnFamMed.org/content/18/6/511/suppl/DC1/, shows our sample selection process. To achieve model convergence, we selected a 25% random sample of our original 20% fee-for-service cohort for each year with race/ethnicity, sex, and dual eligibility stratification to ensure appropriate and sufficient representation within each stratum (Supplemental Figure 2, available at https://www.AnnFamMed.org/content/18/6/511/suppl/DC1/). Our denominator included randomly selected individuals with at least 1 hospital admission during a year over the study period. Supplemental Table 1, available at https://www.AnnFamMed.org/content/18/6/511/suppl/DC1/, shows the characteristics of the 5% sample population.
Outcome Measures
Our primary outcome measures were trends during 2010-2014 in potentially preventable hospitalizations, and associations between various sociodemographic, health, and access variables with risk of these hospitalizations. A beneficiary was considered to have had a potentially preventable hospitalization if, during the full calendar year of enrollment, he or she had at least 1 inpatient claim with an ICD-9 code among those specified by ACSCs as a primary diagnosis for hospitalization (Supplemental Table 2, available at https://www.AnnFamMed.org/content/18/6/511/suppl/DC1/).1 Our secondary outcome measures were trends in these hospitalizations at the county level across the country.
Explanatory Variables
We drew age, sex, race, Elixhauser comorbidity index, dual eligibility (Medicare and Medicaid) status, and number of unique prescription drugs as evidence of polypharmacy from the Medicare claims files. Age was used as a continuous variable. Race was determined using the Beneficiary Summary files. Race/ethnicity was categorized into 4 groups: White (reference group), Black, Hispanic, and other/mixed/unknown. To include a measure of overall health, using carrier, outpatient, and inpatient files, we calculated the Elixhauser comorbidity index based on diagnosed conditions within 1 year before hospital admission (Supplemental Table 3, available at https://www.AnnFamMed.org/content/18/6/511/suppl/DC1/).9,10 To control for socioeconomic status of enrollees, we used dual eligibility as a binary variable if the beneficiary had Medicaid for at least 6 months of the year. As a beneficiary can move into and out of Medicaid (especially among those who are disabled), enrollment in at least 6 noncontinuous months in the calendar year was considered for dual-eligibility status. We used the 2010 US Census data to include ZIP code–level median household income. Number of county-level primary care physicians (PCP) per 1,000 in 2010-2014, hospitals per 100,000 in 2010, and Medicare Managed Care penetration rate in 2010 were extracted from the 2016 ARF and merged with our final data set. The number of PCPs per 1,000 county-level residents from 2010-2014 was included in the models as an average number over the study period.
Statistical Analysis
All bivariate analyses were conducted using ANOVA for continuous variables that were normally distributed and verified by reviewing skew, kurtosis, and quantile-quantile plots. For categorical variables, we used χ2 tests. Because of large sample sizes, 95% confidence intervals for the difference in proportions (for categorical variables) or differences in means (for continuous variables) were calculated.
For this analysis, we first considered a generalized linear mixed model with patient-level random effects. Because of lack of convergence, a repeated cross-sectional design was considered. We used a generalized estimating equation (GEE) to account for clustering of individuals at the ZIP code and county level. A multivariate logistic regression model was specified using binomial distribution and log link function as appropriate for the dichotomous outcome of potentially preventable hospitalization. We examined interaction terms between year and dual eligibility as well as year and race/ethnicity in our model to quantify differential trends in potentially preventable hospitalizations among various subpopulations over time. We calculated marginal adjusted predicted probabilities for each of the different subpopulations of interest informed by our interaction effects. All variables were tested for collinearity via estimation of Spearman rank correlations.
We constructed heat maps of county-specific potentially preventable hospitalization rates for the first and last year of the study period, 2010 and 2014, respectively. Methods for developing these heat maps are described in the Supplemental Appendix, available at https://www.AnnFamMed.org/content/18/6/511/suppl/DC1/.
All analyses were conducted using SAS version 9.4 (SAS Institute Inc), and statistical testing was performed using a significance level of .05, except in the case of the generalized linear models for county-specific trend in potentially preventable hospitalizations over time, where .10 was used.
RESULTS
Baseline characteristics of patients hospitalized in 2010 whose hospitalizations were potentially preventable vs nonpreventable are summarized in Table 1. In that year, 196,971 individuals (16.8%) in our sample had such a potentially preventable hospitalization. Patients who had such hospitalizations were older by 2.4 years (95% CI, 2.3-2.4 years) and were more commonly female (61.8% vs 57.9%; P <.001), Black (11.3% vs 8.3%; P <.001) and Hispanic (7.0% vs 5.7%; P <.001), dually eligible (29.7% vs 18.0%; P <.001), and residents of low-income neighborhoods (27.9% vs 23.9%; P <.001). On average, this group also used more prescription drugs (difference = 4; 95% CI, 3.9-4.1 drugs) and had a higher Elixhauser comorbidity index (difference = 3.8; 95% CI, 3.8-3.9) compared with counterparts having nonpreventable hospitalizations. A higher percentage of patients with a potentially preventable hospitalization, 62.4% (55.8%+6.6%), compared with those with a nonpreventable hospitalization, 60.7% (54.7% + 6.0%) lived in counties with low and medium levels of PCPs per 1,000. Conversely, a higher percentage of the former (5.9%) compared with the latter (4.7%) lived in counties with a high number of hospitals per 100,1000 (P <.001).
In 2014, population characteristics for hospitalized patients had not changed qualitatively on most measures (Table 1). The exceptions were a higher number of prescription drugs in both groups (potentially preventable hospitalization group: 14.4 in 2010 and 17.2 in 2014; nonpreventable hospitalization group: 10.4 in 2010 and 12.7 in 2014) and a higher Elixhauser comorbidity index in both groups (potentially preventable hospitalization group: 9.1 in 2010 and 10.7 in 2014; nonpreventable hospitalization group: 5.3 in 2010 and 6.8 in 2014).
Figure 1 highlights variations in the unadjusted trends of potentially preventable hospitalizations among various subpopulations. On average, rates declined from 16.8% (95% CI, 16.8%-16.9%) in 2010 to 15.7% (95% CI, 15.6%-15.8%) in 2014. Although the rates decreased among all racial/ethnic groups, Black and Hispanic patients consistently had higher rates across the study period. Potentially preventable hospitalization rates among White, Black, and Hispanic patients were 16.1% (95% CI, 16.0%-16.1%), 21.7% (95% CI, 21.4%-21.9%), and 20.0% (95% CI, 19.7%-20.0%) in 2010, respectively, and 15.0% (95% CI, 15.0%-15.1%), 20.3% (95% CI, 20.0%-20.6%), and 19.4% (95% CI, 19.0%-19.8%) in 2014, respectively. Similarly, rates were higher among those dually eligible. In 2010, the rates for dually eligible and non–dually eligible enrollees were 25.0% (95% CI, 24.8%-25.2%) and 14.8% (95% CI, 14.7%-14.9%), respectively; by 2014, they decreased to 23.5% (95% CI, 23.3%-23.7%) and 13.8% (95% CI, 13.8%-13.9%), respectively.
Heat maps of county-specific potentially preventable hospitalization rates for the first and last year of the study period, 2010 and 2014, are shown in Supplemental Figure 3, available at https://www.AnnFamMed.org/content/18/6/511/suppl/DC1/. Results are detailed in the Supplemental Appendix, and Supplemental Tables 4 and 5, available at https://www.AnnFamMed.org/content/18/6/511/suppl/DC1/. In sum, across the 3,200 study counties, potentially preventable hospitalizations decreased in 327 counties, increased in 123 counties, and did not change in the rest.
Figure 2 shows the adjusted odds ratios for potentially preventable hospitalization. Regression results are presented in Supplemental Table 6, available at https://www.AnnFamMed.org/content/18/6/511/suppl/DC1/. Odds of such hospitalization were higher for women compared with men (odds ratio [OR] = 1.09; 95% CI, 1.08-1.11); Black patients (OR = 1.20; 95% CI, 1.16-1.25) and Hispanic patients (OR = 1.18; 95% CI, 1.11-1.25) compared with White patients; dually eligible patients compared with non–dually eligible counterparts (OR = 1.31; 95% CI, 1.28-1.35); those living in a low-income neighborhood compared with those living in an average-income neighborhood (OR = 1.06; 95% CI, 1.04-1.08); those having fewer than 0.48 PCPs per 1,000 (low level) compared with those with more than 1.04 per 1,000 (high level) in their county (OR = 1.12; 95% CI, 1.09-1.16); and those having more than 6.1 hospitals per 100,000 (high level) compared with those having fewer than 1 per 100,000 (low level) in their county (OR = 1.23; 95% CI, 1.18-1.27).
Figure 3 shows the 2010-2014 adjusted predicted trends in potentially preventable hospitalizations overall (top panel); among White, Black, Hispanic, and other patients (middle panel); and among dually eligible and non–dually eligible patients (bottom panel). The overall rate declined by 3.45 percentage points from 19.42% (95% CI, 18.4%-20.5%) in 2010 to 15.97% (95% CI, 15.3%-16.6%) in 2014. Similar parallel trends were observed among all racial/ethnic groups. In 2010, the rate among Black patients was 20.79%, which fell by 2.87 percentage points to 17.92% in 2014. For Hispanic patients, the rate declined by 3.33 percentage points from 20.43% in 2010 to 17.10% in 2014. The rate of potentially preventable hospitalizations fell at a slightly faster pace among dually eligible patients (from 21.62% to 17.91%; difference = 3.71 percentage points) compared with non–dually eligible patients (from 17.39% to 14.20%; difference = 3.19 percentage points) (P <.001 for all). In 2014, there were still large gaps in rates between Black and Hispanic patients and White patients, as well as between dually eligible patients and non–dually eligible patients.
DISCUSSION
We used 2010-2014 Medicare fee-for-service claims to examine trends in rates of potentially preventable hospitalizations among older adults. Three important findings emerged. First, trends consistently declined across all subpopulations during our study period; however, disadvantaged and minority groups, such as Black and Hispanic patients compared with White patients, and Medicaid enrollees compared with non–Medicaid enrollees, still experienced higher rates. Second, although having greater access to PCPs lowered the odds of potentially preventable hospitalizations, race/ethnicity, poverty (indicated by Medicaid coverage), and availability of other resources such as hospitals were stronger risk factors for these hospitalizations. Finally, wide variations in rates exist across counties in the United States.
Despite the aging trend and increasing prevalence of chronic conditions among older adults, historical studies have shown a continuing decline in rates of hospitalization.6 Potentially preventable hospitalizations are largely attributed to social factors that exacerbate disparities in access to care and quality of care.11 This situation is exemplified by higher rates in low-income neighborhoods, where primary care physicians are not readily accessible.12,13 Race/ethnicity, socioeconomic status, number of PCPs, and their accessibility after working hours and/or on weekends14 have been shown to be salient factors associated with potentially preventable hospital admissions.15-17 Disparities in income and access to primary care manifest themselves in higher rates of potentially preventable hospitalization among those who live in rural areas, inner cities, or locales with a shortage of primary care professionals.18-20 Furthermore, because of Medicaid’s low reimbursement rates, the doors of many physicians who work in private clinics are closed to dually eligible patients.21,22 Many older adults may lack proper transportation.23 Without reliable and affordable transportation, a patient with a urinary tract infection, for example, who could have been easily cared for in an outpatient setting has to be transferred to a hospital. The primary care system needs to be accessible and affordable, particularly for populations who are at higher risk for potentially preventable hospitalizations.4 Policies with financial incentives to increase the number of PCPs, especially in rural and low-income areas, can potentially improve health care access and reduce these hospitalizations among vulnerable populations.24
Through public reporting, pay for performance, financial incentives, Medicaid expansion, and other quality initiatives, health policies since 2012 have targeted institutions such as hospitals and skilled nursing facilities (SNFs) to reduce potentially preventable transfers from these facilities to hospitals or 30-day readmissions.25,26 For instance, Interventions to Reduce Acute Care Transfers (INTERACT) is a risk assessment tool that enables participating SNFs to identify and manage ACSCs before patients become critically ill.27 The Hospital Readmissions Reduction Program (HRRP)—a value-based program that reduces payments to hospitals with excess readmission—is another example.28,29 In 2017, the Centers for Medicare & Medicaid Services applied the same strategy for SNFs with excess transfer rates to hospitals, aiming to further reduce potentially preventable hospitalizations.30-32
It is hard to discern whether financial penalties that have successfully nudged many resourceful hospitals and SNFs to enhance their discharge systems, care management units, or nursing infrastructure are sufficient to address existing income and racial/ethnic disparities. For hospitals and SNFs that had the financial resources to improve their system of care, these policies were quite successful.33 Today, however, there are still many safety-net hospitals and SNFs that primarily serve low-income or minority populations and are repeatedly penalized for higher-than-expected rates of potentially preventable readmissions or hospitalizations.34
Although we did not find county-level correlation between potentially preventable hospitalizations and number of PCPs per 1,000 (Supplemental Figure 4, available at https://www.AnnFamMed.org/content/18/6/511/suppl/DC1/), large county-level disparities in access to resources exist. Data from the 2016 ARF indicate that, on average, the number of PCPs in each county increased from 95 in 2010 to 101 in 2014; however, this change was not homogeneous across all counties. For example, in Michigan, the number of PCPs in Washtenaw County increased from 645 in 2010 to 773 in 2014. On the other hand, during the same time period, the number of PCPs in Wayne County decreased from 1,455 to 1,431. (The former county is smaller but more affluent than the latter.) Between 2010 and 2014, 86% of counties did not have a significant change in their potentially preventable hospitalization rates. Furthermore, in 123 counties, the rate increased over time; a great majority of this group (81%) were located in small, impoverished, rural areas.
Our findings are subject to a few limitations. First, not all potentially preventable hospitalizations are or should be considered avoidable. ACSCs are considered conditions for which hospitalization is preventable, but depending on severity of the condition and a whole host of other factors, it is not possible to determine which ones could have been prevented. We tried to address this limitation by excluding patients with disabilities and kidney failure, and by controlling for age, sex, and comorbidity index. Second, we lacked information about use of other community health services such as urgent care centers and about patient preferences regarding their use vs using hospitals as an alternative. Third, we used Medicare claims data because the purpose of this study was to examine potentially preventable hospitalizations among a nationally representative sample of older adults. Administrative claims data, however, lack measures of self-reported health/functional status, granular socioeconomic status, and access to care. Finally, because of funding constraints, we had access only to 2010-2014 data. Future studies should continue examining potentially preventable hospitalizations with more current years of data.
In conclusion, our analysis indicates a favorable downward trend in the rate of potentially preventable hospitalizations among older adults between 2010 and 2014. Despite this progress, racial/ethnic minorities, those dually Medicare and Medicaid eligible, and those living in impoverished areas with access to fewer resources were still at higher risk for these hospitalizations. Improving access to primary care among vulnerable populations and those who live in rural areas should remain a priority.
Figures and Tables

Unadjusted rates of potentially preventable hospitalization: 2010-2014.
Note: Source is Medicare claims data (2010-2014).
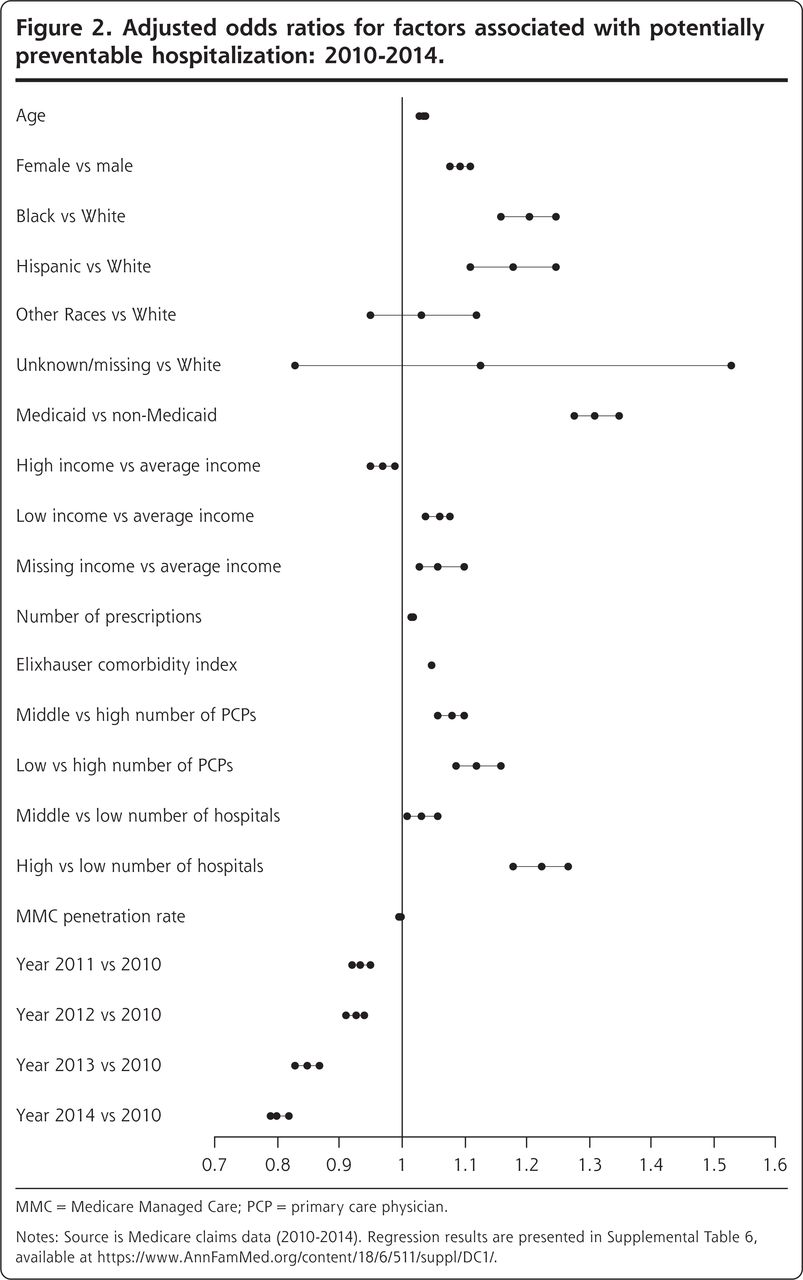
Adjusted odds ratios for factors associated with potentially preventable hospitalization: 2010-2014.
MMC = Medicare Managed Care; PCP = primary care physician.
Notes: Source is Medicare claims data (2010-2014). Regression results are presented in Supplemental Table 6, available at https://www.AnnFamMed.org/content/18/6/511/suppl/DC1/.
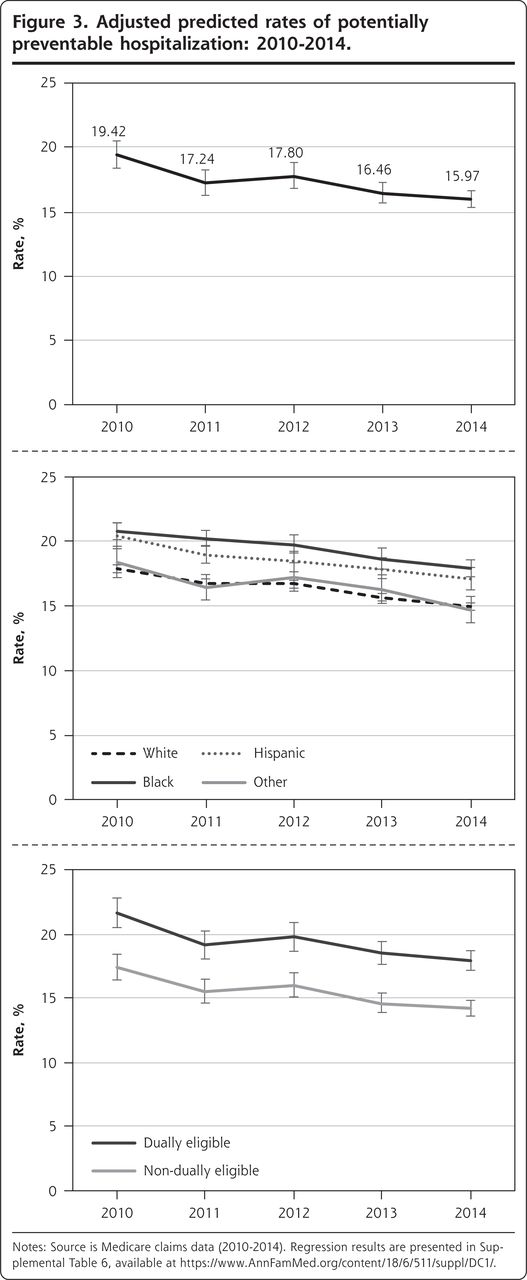
Adjusted predicted rates of potentially preventable hospitalization: 2010-2014.
Notes: Source is Medicare claims data (2010-2014). Regression results are presented in Supplemental Table 6, available at https://www.AnnFamMed.org/content/18/6/511/suppl/DC1/.
Characteristics of Patients With Potentially Preventable and Nonpreventable Hospitalizations in 2010 and 2014
Footnotes
Conflicts of interest: authors report none.
To read or post commentaries in response to this article, see it online at https://www.AnnFamMed.org/content/18/6/511.
Funding support: This study was supported by a grant from the National Institutes of Health (P30 AG015281) and the Michigan Center for Urban African American Aging Research, and by a grant from the University of Michigan Claude D. Pepper Older Americans Independence Center (AG024824).
Disclaimer: The views expressed are solely those of the authors and do not necessarily represent official views of the authors’ affiliated institutions or funders.
Supplemental materials: Available at https://www.AnnFamMed.org/content/18/6/511/suppl/DC1/.
- Received for publication August 6, 2019.
- Revision received April 24, 2020.
- Accepted for publication April 28, 2020.
- © 2020 Annals of Family Medicine, Inc.
References
In this issue


Jump to section
Related Articles
Cited By...
- No citing articles found.