
Article Figures & Data
Figures
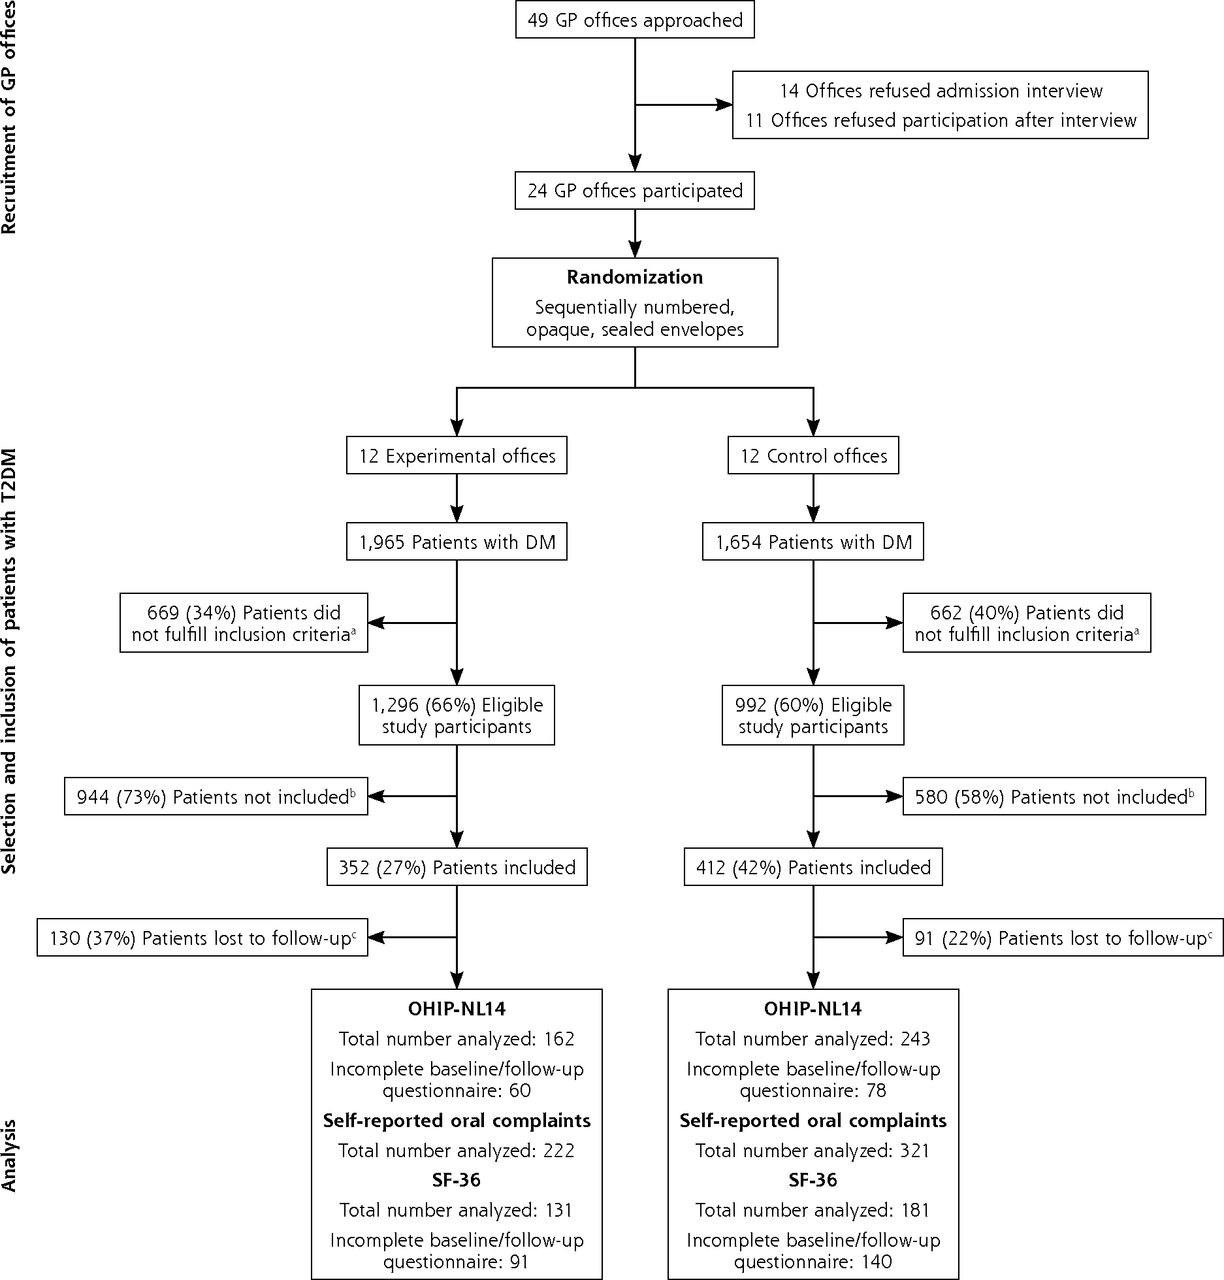
- Figure 1.
Study flowchart.
DM = diabetes mellitus; GP = general practitioner; OHIP-NL14 = 14-item Oral Health Impact Profile; SF-36 = 36-item Short Form Health Survey; T2DM = type 2 diabetes mellitus.
a Inclusion criteria: (1) aged ≥18 years; (2) diagnosed with T2DM; (3) follows the standardized primary care protocol, including an annual examination; (4) understands spoken and written Dutch.
b Main reasons for not participating in the study: lack of time and routine of the nurse practitioners and/or general practitioner; financial issues for certain patients; disinterest and lack of motivation of certain patients; dental anxiety.
c Reasons for loss to follow-up: transfer of GP office (n = 27); renounciation from participation (n = 25); illness and/or weakness, eg, due to dementia or severe diabetic complications (n = 11); death (n = 10); coding mistake, ie, data assigned to follow-up rather than baseline (n = 5); incomplete follow-up measurements without a reason (n = 143).

Tables
Experimental Control Study details No. of GP offices 12 12 No. of study participants 352 412 General patient characteristics Age, mean (SD), y 64.3 (10.9) 67.3 (10.3) Male, n/N (%) 195/351 (55.6) 231/412 (56.1) Western-European ethnicity, n/N (%) 170/220 (77.3) 230/298 (77.2) Education, n/N (%) Primary 20/224 (8.9) 30/294 (10.2) Secondary 82/224 (36.6) 114/294 (38.8) Higher 122/224 (54.5) 150/294 (51.0) Smoker, n/N (%) 51/304 (16.8) 61/403 (15.1) Metabolic control (HbA1c), n/N (%) Good (≤53 mmol/mol) 210/320 (65.6) 269/395 (68.1) Moderate (54-63 mmol/mol) 72/320 (22.5) 89/395 (22.5) Poor (≥64 mmol/mol) 38/320 (11.9) 37/395 (9.4) Body mass index, n/N (%) Normal weight (<25 kg/m2) 66/326 (20.2) 56/405 (13.8) Overweight (25-29.9 kg/m2) 125/326 (38.3) 197/405 (48.6) Obese (≥30 kg/m2) 135/326 (41.4) 152/405 (37.5) Hypertension (SBP ≥140 mmHg), n/N (%) 94/323 (29.1) 175/406 (43.1) Dyslipidemia (LDL >2.5 mmol/L), n/N (%) 142/303 (46.9) 158/387 (40.8) eGFR <60 mL/min/1.73 m2, n/N (%) 51/313 (16.3) 91/369 (24.7) Retinopathy, n/N (%) 8/199 (4.0) 10/251 (4.0) Diabetic foot risk, n/N (%) None (Simm 0) 214/275 (77.8) 243/364 (66.8) Moderate (Simm 1) 30/275 (10.9) 60/364 (16.5) High (Simm 2) 26/275 (9.5) 54/364 (14.8) Very high (Simm 3) 5/275 (1.8) 7/364 (1.9) Self-reported oral health characteristics, n/N (%) Have a dentist 299/352 (84.9) 340/412 (82.5) Regular dentist visit 278/350 (79.4) 304/412 (73.8) Have dental insurance 242/347 (69.7) 283/410 (69.0) Edentate 46/352 (13.1) 75/405 (18.5) Pain in mouth 61/352 (17.3) 52/412 (12.6) Dry mouth 123/352 (34.9) 162/412 (39.3) Bad breath 51/352 (14.5) 39/412 (9.5) Oral health–related QoLa, mean (SD) Functional limitation 0.3 (0.9) 0.3 (0.8) Physical pain 0.8 (1.4) 0.7 (1.4) Psychologic discomfort 0.5 (1.3) 0.5 (1.1) Physical disability 0.3 (0.9) 0.3 (0.9) Psychologic disability 0.3 (0.9) 0.3 (0.8) Social disability 0.2 (0.8) 0.1 (0.6) Handicap 0.2 (0.8) 0.2 (0.5) OHIP-NL14 total score 2.7 (5.7) 2.3 (4.8) General health–related QoLb, mean (SD) Physical functioning 77.2 (22.8) 72.9 (23.9) Social functioning 81.2 (20.8) 81.0 (22.6) Role limitations due to physical health problems 70.6 (39.9) 66.3 (40.5) Role limitations due to emotional problems 78.9 (35.5) 76.6 (37.3) General mental health 77.2 (17.8) 75.0 (19.1) Vitality 65.2 (19.1) 64.5 (20.4) Bodily pain 74.7 (23.9) 74.1 (24.7) General health perceptions 59.6 (17.5) 57.5 (20.3) Changes in health over time 51.8 (19.7) 53.4 (20.1) eGFR = estimated glomerular filtration rate; GP = general practitioner; HbA1c = glycated hemoglobin; LDL = low-density lipoprotein cholesterol; OHIP-NL14 = 14-item Oral Health Impact Profile; QoL = quality of life; SPB = systolic blood pressure.
Note: Data are presented as percentage of total population unless indicated otherwise. When the size of the total population for a variable differs from the total population included in the study, this is the result of missing data. Percentages represent only nonmissing data.
↵a Subdomains according to Slade.21
↵b Concept scales according to Ware Jr and Sherbourne26 and Ware Jr.27
- Table 2.
Loss to Follow-Up, Improvement in Oral Health–Related QoL, and Self-Reported Oral Health Complaints by Intervention, Including All GP Offices in the Analysis
Experimental Control χ2 Statistic P Value Intracluster Correlation Coefficient Adjusted χ2 Statistic Adjusted P Value Study details No. of GP offices 12 12 No. of study participants 352 412 Loss to follow-up GP offices 0 (0) 0 (0) N/A N/A N/A N/A N/A Study participants 130 (36.9) 91 (22.1) 20.346 <.001 0.214 2.354 .125 Improvement in oral health–related QoLa n = 162b n = 243b Functional limitation 22 (13.6) 24 (9.9) 1.324 .25 –0.008c 1.324 .25 Physical pain 45 (27.8) 53 (21.8) 1.887 .17 –0.006c 1.887 .17 Psychologic discomfort 27 (16.7) 26 (10.7) 3.043 .081 0.031 1.924 .165 Physical disability 15 (9.3) 17 (7.0) 0.684 .408 0.035 0.412 .521 Psychologic disability 25 (15.4) 21 (8.6) 4.451 .035 0.023 3.106 .078 Social disability 7 (4.3) 8 (3.3) 0.289 .591 0.011 0.240 .624 Handicap 17 (10.5) 12 (4.9) 4.513 .034 0.014 3.591 .058 OHIP-NL14 total score 57 (35.2) 63 (25.9) 3.997 .046 0.002 3.857 .049 Improvement in self-reported oral health complaints n = 222b n = 321b Pain in mouth 33 (14.9) 28 (8.7) 4.965 .026 0.017 3.451 .063 Dry mouth 38 (17.1) 59 (18.4) 0.143 .705 0.019 0.095 .758 Bad breath 19 (8.6) 19 (5.9) 1.405 .236 –0.018c 1.405 .236 Any 78 (35.1) 89 (27.7) 3.383 .066 0.036 1.750 .186 GP = general practitioner; N/A = not applicable because GP office is cluster level itself; OHIP-NL14 = 14-item Oral Health Impact Profile; QoL = quality of life.
Note: Data in Experimental and Control columns for rows Loss to follow-up and below are presented as n (%).
↵a Subdomains according to Slade.21
↵b No. of patients with a completed baseline and follow-up questionnaire.
↵c To calculate adjusted χ2 statistics, negative intracluster correlation coefficients were set to 0 for these variables.30,31
- Table 3.
Loss to Follow-Up, Improvement in Oral Health–Related QoL, and Self-Reported Oral Health Complaints by Intervention, Excluding GP Offices With Follow-Up <60%
Experimental Control χ2 Statistic P Value Intracluster Correlation Coefficient Adjusted χ2 Statistic Adjusted P Value Study details No. of GP offices 8 10 No. of study participants 210 318 Loss to follow-up GP offices 0 (0) 0 (0) N/A N/A N/A N/A N/A Study participants 39 (18.6) 48 (15.1) 1.111 .292 0.067 0.356 .551 Improvement in oral health–related QoLa n = 120b n = 205b Functional limitation 17 (14.2) 17 (8.3) 2.788 .095 –0.005c 2.788 .095 Physical pain 37 (30.8) 43 (21.0) 3.964 .046 –0.005c 3.964 .046 Psychologic discomfort 21 (17.5) 20 (9.8) 4.118 .042 –0.008c 4.118 .042 Physical disability 12 (10.0) 12 (5.9) 1.903 .168 0.033 1.152 .283 Psychologic disability 22 (18.3) 17 (8.3) 7.226 .007 0.007 6.355 .012 Social disability 4 (3.3) 8 (3.9) 0.069 .793 –0.018c 0.069 .793 Handicap 15 (12.5) 10 (4.9) 6.193 .013 0.010 5.173 .023 OHIP-NL14 total score 46 (38.3) 51 (24.9) 6.545 .011 –0.005c 6.545 .011 Improvement in self-reported oral health complaints n = 171b n = 270b Pain in mouth 26 (15.2) 28 (10.4) 2.277 .131 0.011 1.764 .184 Dry mouth 26 (15.2) 56 (20.7) 2.120 .145 –0.007c 2.120 .145 Bad breath 16 (9.4) 16 (5.9) 1.831 .176 –0.030c 1.831 .176 Any 59 (34.5) 85 (31.5) 0.436 .509 –0.009c 0.436 .509 GP = general practitioner; N/A = not applicable because GP office is cluster level itself; OHIP-NL14 = 14-item Oral Health Impact Profile; QoL = quality of life.
Note: Data in Experimental and Control columns from Loss to follow-up down are presented as n (%).
↵a Subdomains according to Slade.21
↵b Number of patients with a completed baseline and follow-up questionnaire.
↵c To calculate adjusted χ2 statistics, negative intracluster correlation coefficients were set to 0 for these variables.30,31
- Table 4.
Baseline and Follow-Up Scores for General Health–Related Quality of Life and Adjusted and Unadjusted Analysis of Differences Between Patients From Experimental and Control GP Offices
SF-36 Concept Scalea Experimental Control Primary Analysise Secondary Analysisf Baseline (n = 258)b Follow-Up (n = 163)c Mean Difference (n = 131)d Baseline (n = 286)b Follow-Up (n = 231)c Mean Difference (n = 181)d Unadjusted P Valueg Adjusted P Valueh Unadjusted P Valueg Adjusted P Valueh Physical functioning 77.2 (22.8) 75.1 (27.3) 0.1 (16.6) 72.9 (23.9) 74.5 (24.4) –1.4 (17.8) .425 .541 .633 .779 Social functioning 81.2 (20.8) 81.3 (24.4) –0.2 (22.5) 81.0 (22.6) 82.0 (20.5) –2.2 (21.3) .496 .518 .844 .865 Role limitations due to physical health problems 70.6 (39.9) 70.1 (40.2) 3.4 (34.5) 66.3 (40.5) 70.8 (39.4) –0.8 (37.0) .371 .465 .458 .566 Role limitations due to emotional problems 78.9 (35.5) 80.2 (35.6) 3.6 (39.3) 76.6 (37.3) 79.4 (34.6) –0.2 (40.4) .376 .376 .34 .34 General mental health 77.2 (17.8) 79.7 (17.6) 1.4 (12.9) 75.0 (19.1) 77.9 (17.8) 1.4 (14.8) .676 .676 .959 .959 Vitality 65.2 (19.1) 66.2 (19.1) 1.3 (14.6) 64.5 (20.4) 65.3 (19.7) 0.03 (16.1) .509 .508 .715 .887 Bodily pain 74.7 (23.9) 76.4 (24.3) 2.1 (23.3) 74.1 (24.7) 76.2 (24.7) 0.02 (23.1) .513 .513 .669 .669 General health perceptions 59.6 (17.5) 59.9 (18.5) 0.8 (15.9) 57.5 (20.3) 56.9 (19.1) –1.8 (18.7) .084 .084 .272 .272 Changes in health over time 51.8 (19.7) 51.4 (19.5) 1.0 (24.7) 53.4 (20.1) 49.0 (19.3) –5.9 (23.3) .023 .033 .035 .067 ANCOVA = analysis of covariance; GP = general practitioner; QoL = quality of life; SF-36 = 36-item Short Form Health Survey.
Note: Data are presented as mean (SD) for general health–related QoL scores (range 0-100).
↵a Concept scales according to Ware Jr and Sherbourne26 and Ware Jr.27
↵b These mean values were calculated using all completed questionnaires at baseline (n = 258 for the experimental group, n = 286 for the control group).
↵c These mean values were calculated using all completed questionnaires at follow-up (n = 163 for the experimental group, n = 231 for the control group).
↵d These mean differences were calculated using both completed baseline and follow-up questionnaires (n = 131 for the experimental group, n = 181 for the control group).
↵e Analysis of differences in general health–related QoL between the experimental and control group, including all GP offices in the analysis.
↵f Analysis of differences in general health–related QoL between the experimental and control group, excluding patients from GP offices with follow-up <60%.
↵g The unadjusted P values were calculated with ANCOVA, using baseline general health–related QoL scores as covariate.
↵h The adjusted P values were calculated with linear mixed-model analysis using baseline general health–related QoL scores and group allocation (experimental/control) as fixed factor and office number as random factor.
Supplemental data
Supplemental tables 1-3 and supplemental appendix
- Supplemental data -
PDF file
- Supplemental data -
The Article in Brief
Implementation of an Oral Care Protocol for Primary Diabetes Care: A Pilot Cluster-Randomized Controlled Trial
Martijn J.L. Verhulst , and colleagues
Background Individuals with diabetes are at greater risk of developing oral health issues, like gum disease, yet care for these linked health issues are usually disconnected, split between primary care and dental care. A research team from the University of Amsterdam developed an intervention that provided primary care–based oral health information and dental referrals for patients with diabetes.
What This Study Found In a cluster randomized controlled trial, 764 patients from 24 primary care practices received either the oral health support or standard primary care. Participants were asked to rate their oral health quality of life, as well as their general health and any oral health complaints, at the start and end of the study. Analysis showed that individuals who received the primary care–based oral health support intervention had a significant increase in their self-reported oral health quality of life when compared with the control group.
Implication
- The authors conclude that, “patients with type 2 diabetes who attend primary diabetes care can benefit from extra attention to oral health.” They add, “It also further reflects the concept of oral health and general health being connected.”
In this issue


Jump to section
Related Articles
Cited By...
- No citing articles found.