
Article Figures & Data
Tables
- Table 1.
Characteristics of and Technology-Facilitated Abuse Among Men Aged 18-35 Years (N = 1,079)
Measure Value Demographics Age, mean (SD), y 26.5 (26.2-27.0) Race and ethnicity, % (95% CI) White non-Hispanic 57.6 (54.0-61.1) Black non-Hispanic 11.6 (9.2-14.5) Hispanic 21.9 (19.0-25.1) Another non-Hispanic 7.1 (5.3-9.4) Multiracial non-Hispanic 1.8 (1.1-3.0) Education, % (95% CI) <High school 14.5 (11.6-18.1) High school 29.6 (26.4-33.0) Some college 33.0 (29.9-36.3) Bachelor’s degree or higher 22.9 (20.5-25.4) Employed, % (95% CI) 69.7 (66.1-73.0) Smartphone use Owns a smartphone, % (95% CI) 65.3 (61.3-69.1) Health service use Primary care connection, % (95% CI) 59.6 (55.7-63.4) Emergency department visits in past 2 years, % (95% CI) 22.3 (19.2-25.8) Mental health care visits ever, % (95% CI) 28.2 (24.9-31.9) Mental health problems and substance use Depression, % (95% CI)a 11.3 (9.2-13.9) Alcohol misuse, mean (SD) scoreb 3.6 (3.3-4.0) Marijuana use, mean (SD) scorec 0.6 (0.5-0.8) Prescription opioid nonmedical use, mean (SD) scorec 0.2 (0.1-0.2) Technology-facilitated abused Any delivered, % (95% CI) 29.8 (26.3-33.5) Any received, % (95% CI) 33.6 (30.0-37.5) Delivered only, % (95% CI) 4.1 (2.9-5.7) Received only, % (95% CI) 8.0 (6.0-10.6) Both delivered and received, % (95% CI) 25.6 (22.2-29.2) None delivered or received, % (95% CI) 62.3 (58.4-66.0) ↵aScore of greater than 2 on Patient Health Questionnaire-2.
↵bOn a scale from 0 to 40, where higher scores denote greater misuse.
↵cOn a scale from 0 to 6, where higher scores denote greater use.
↵dBased on respondents’ report of having experience with any of 5 acts of abuse in the past year. See Methods.
Note: Data are weighted for the US population.
Characteristic TFA Delivered Only, AOR (95% CI) TFA Received Only, AOR (95% CI) TFA Both Delivered and Received, AOR (95% CI) Demographics Age: per year 1.05 (0.95-1.16) 0.94 (0.87-1.02) 0.96 (0.92-1.01) Race/ethnicitya Black non-Hispanic 1.02 (0.20-5.36) 1.19 (0.35-4.03) 2.83b (1.44-5.58) Hispanic 2.72c (1.13-6.57) 2.55c (1.01-6.43) 1.53 (0.89-2.63) Another non-Hispanic 1.95 (0.44-8.65) 2.95 (0.79-11.0) 2.54 (0.96-6.72) Multiracial non-Hispanic 0.22 (0.02-3.21) 1.87 (0.61-5.72) 0.31 (0.07-1.43) Educationd High school education 0.48 (0.12-1.86) 0.40 (0.06-2.55) 0.90 (0.33-2.47) Some college 1.51 (0.44-5.20) 0.50 (0.08-2.94) 0.92 (0.33-2.52) Bachelor’s degree or higher 1.36 (0.40-4.69) 0.72 (0.12-4.47) 0.77 (0.27-2.14) Employed 4.25 (0.62-29.2) 1.04 (0.38-2.82) 1.61 (0.90-2.88) Smartphone use Owns a smartphone 0.72 (0.29-1.82) 0.70 (0.29-1.69) 1.80b (1.05-3.09) Health service use Primary care connection 0.83 (0.39-1.77) 0.43b (0.22-0.86) 1.19 (0.78-1.83) Emergency department visits 0.83 (0.33-2.08) 1.14 (0.49-2.62) 1.49 (0.89-2.50) Mental health care visits 0.71 (0.28-1.82) 0.95 (0.48-1.89) 1.86b (1.16-2.98) Mental health problems and substance use Depression 1.48 (0.49-4.40) 0.41 (0.09-1.85) 0.97 (0.45-2.10) Alcohol misuse 1.00 (0.91-1.10) 1.06 (0.98-1.15) 1.10e (1.04-1.17) Marijuana use 1.31b (1.02-1.68) 0.83 (0.64-1.07) 1.08 (0.94-1.24) Prescription opioid non-medical use 2.86c (1.48-5.54) 2.43c (1.34-4.39) 1.79b (1.04-3.08) AOR = adjusted odds ratio; TFA = technology-facilitated abuse.
↵aReference group is White non-Hispanic.
↵bP <.01.
↵cP <.05.
↵dReference group is less than high school.
↵eP <.001.
Notes: Results of multinomial logistic regression analysis using no TFA as the reference category. Data are weighted for the US population.
Additional Files
Supplemental materials
Supplemental Appendix: Questions assessing TFA delivered and received
- Seewald.pdf -
PDF file
- Seewald.pdf -
Visual abstract- link below
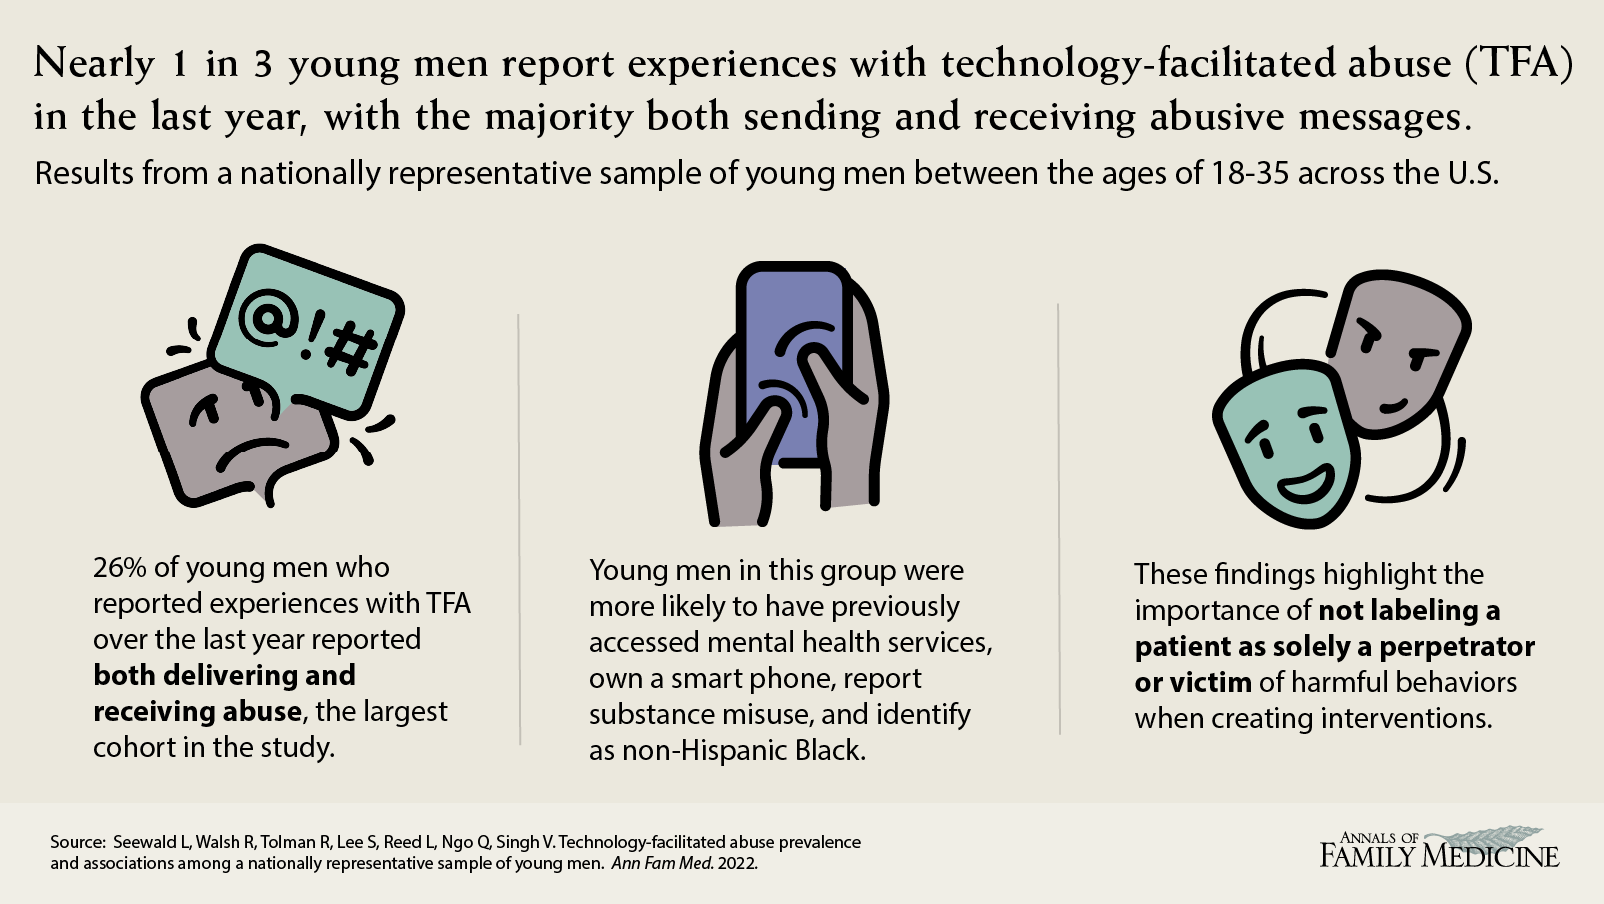
Visual abstract. Nearly 1 in 3 young men report experiences with technology-facilitated abuse (TFA) in the last year, with the majority both sending and receiving abusive messages.
- Seewald_visualabstract_20.1.png -
PNG file
- Seewald_visualabstract_20.1.png -


Jump to section
Related Articles
Cited By...
- No citing articles found.