
Article Figures & Data
Figures
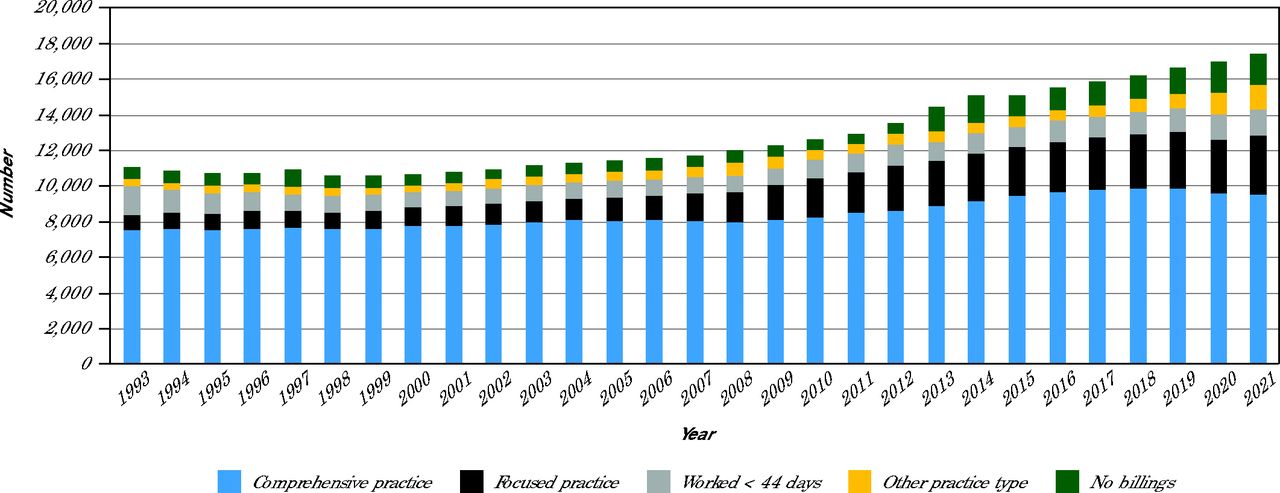
- Figure 1A.
Number of Family Physicians, by Practice Type, 1993-2021
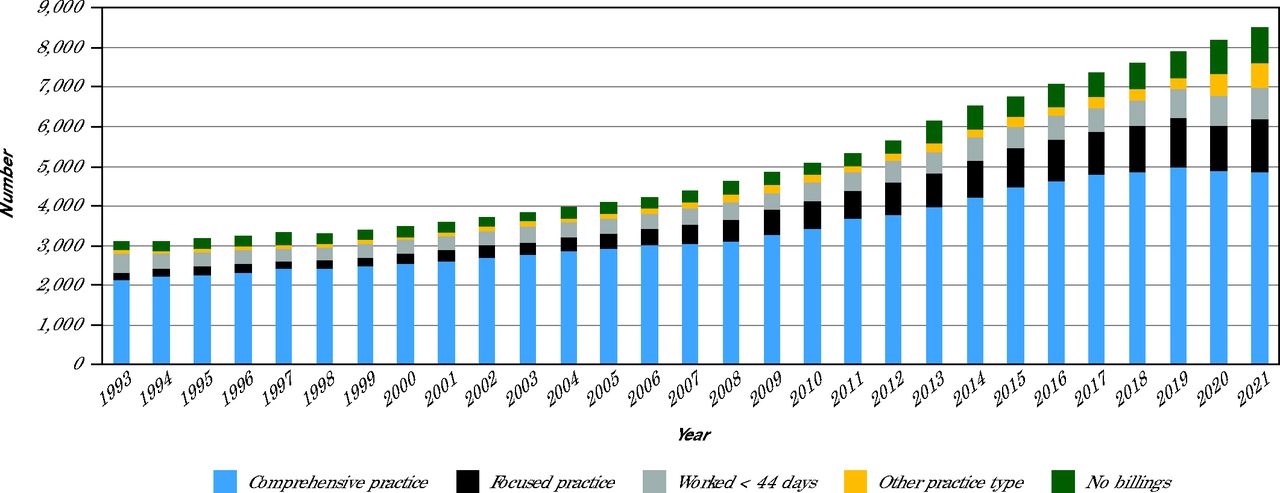
- Figure 1B.
Number of Female Family Physicians, by Practice Type, 1993-2021
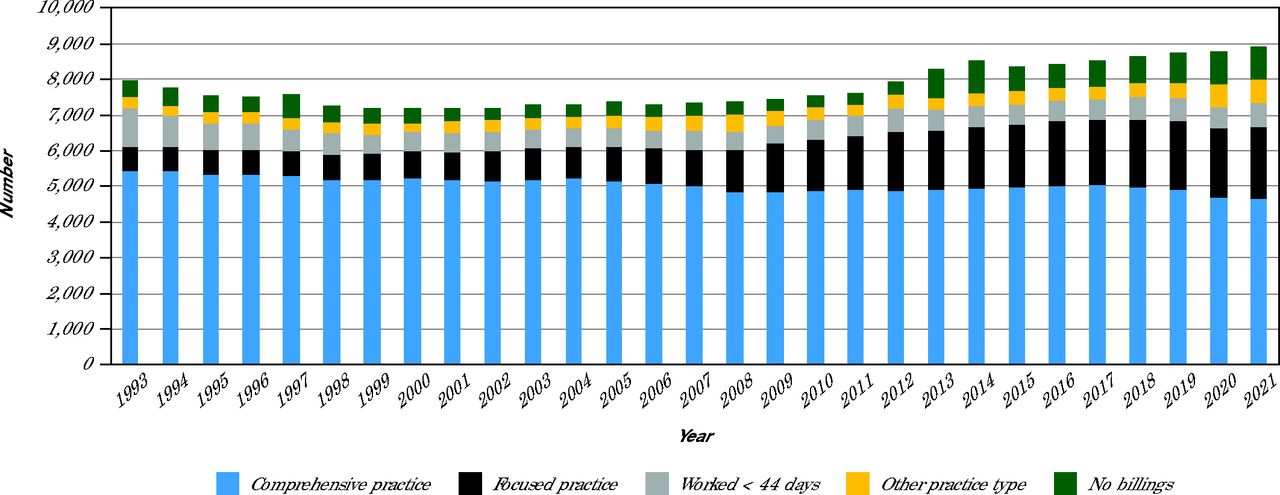
- Figure 1C.
Number of Male Family Physicians, by Practice Type, 1993-2021
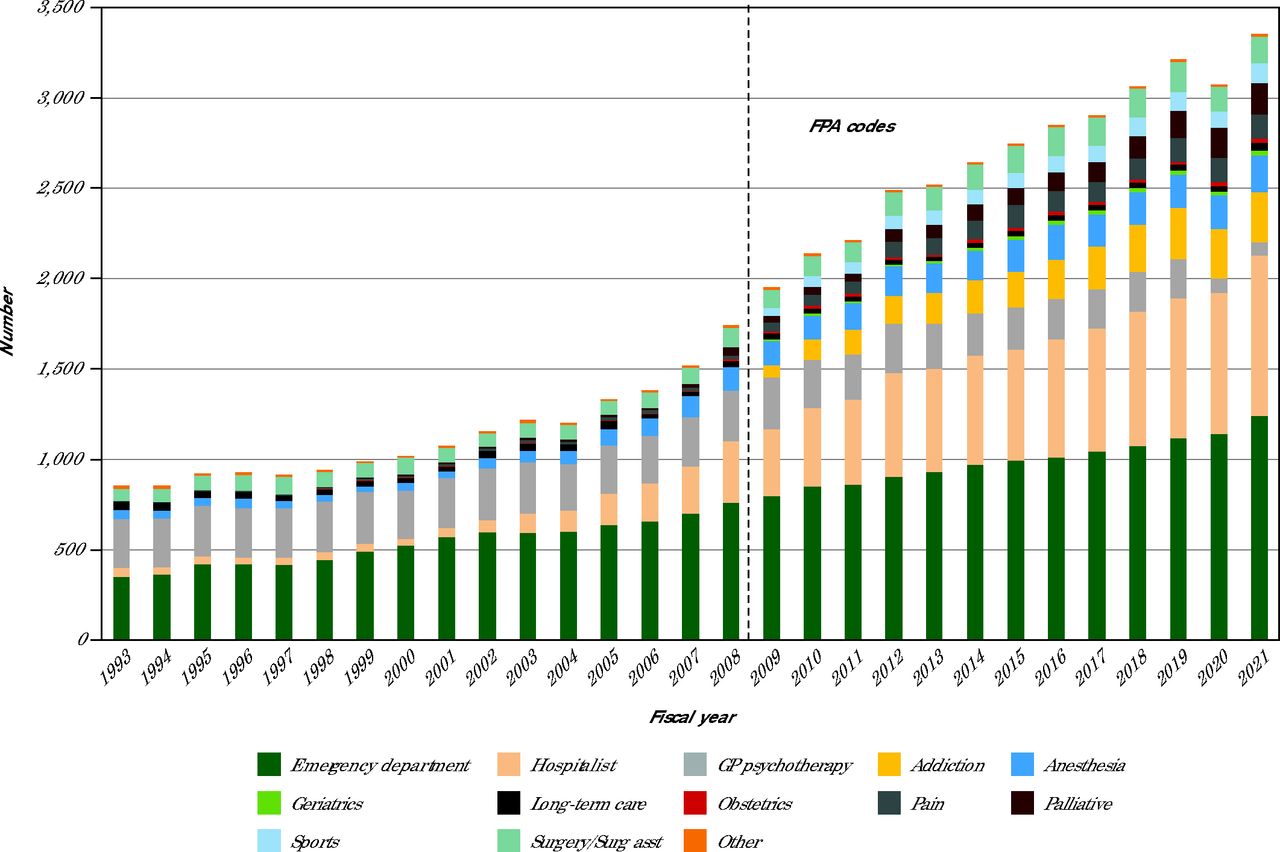
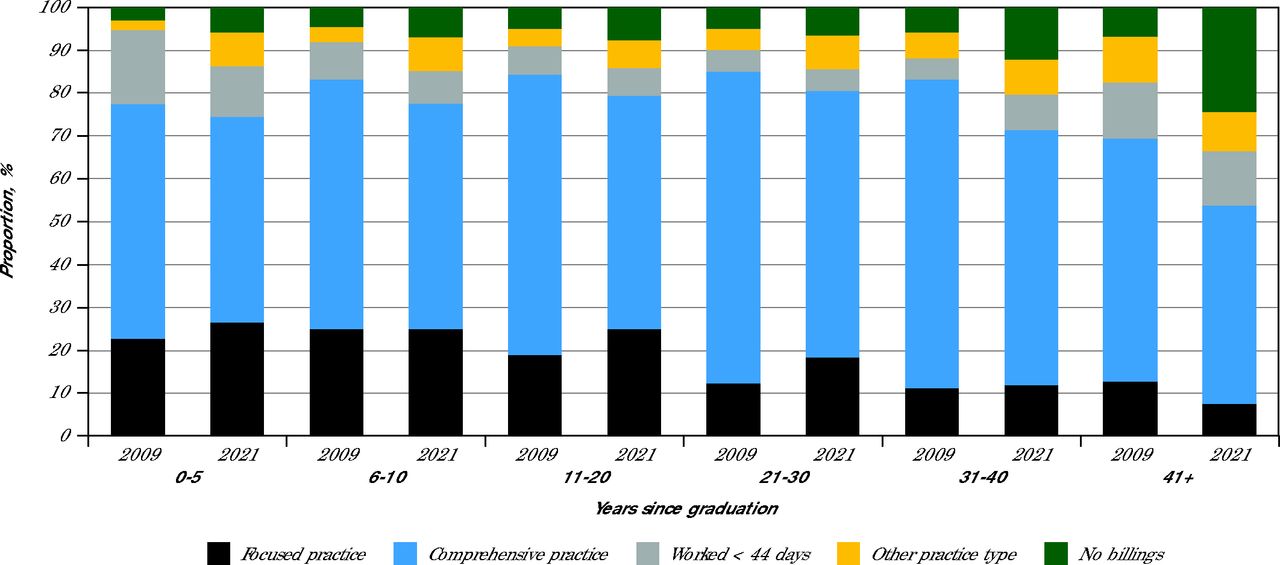
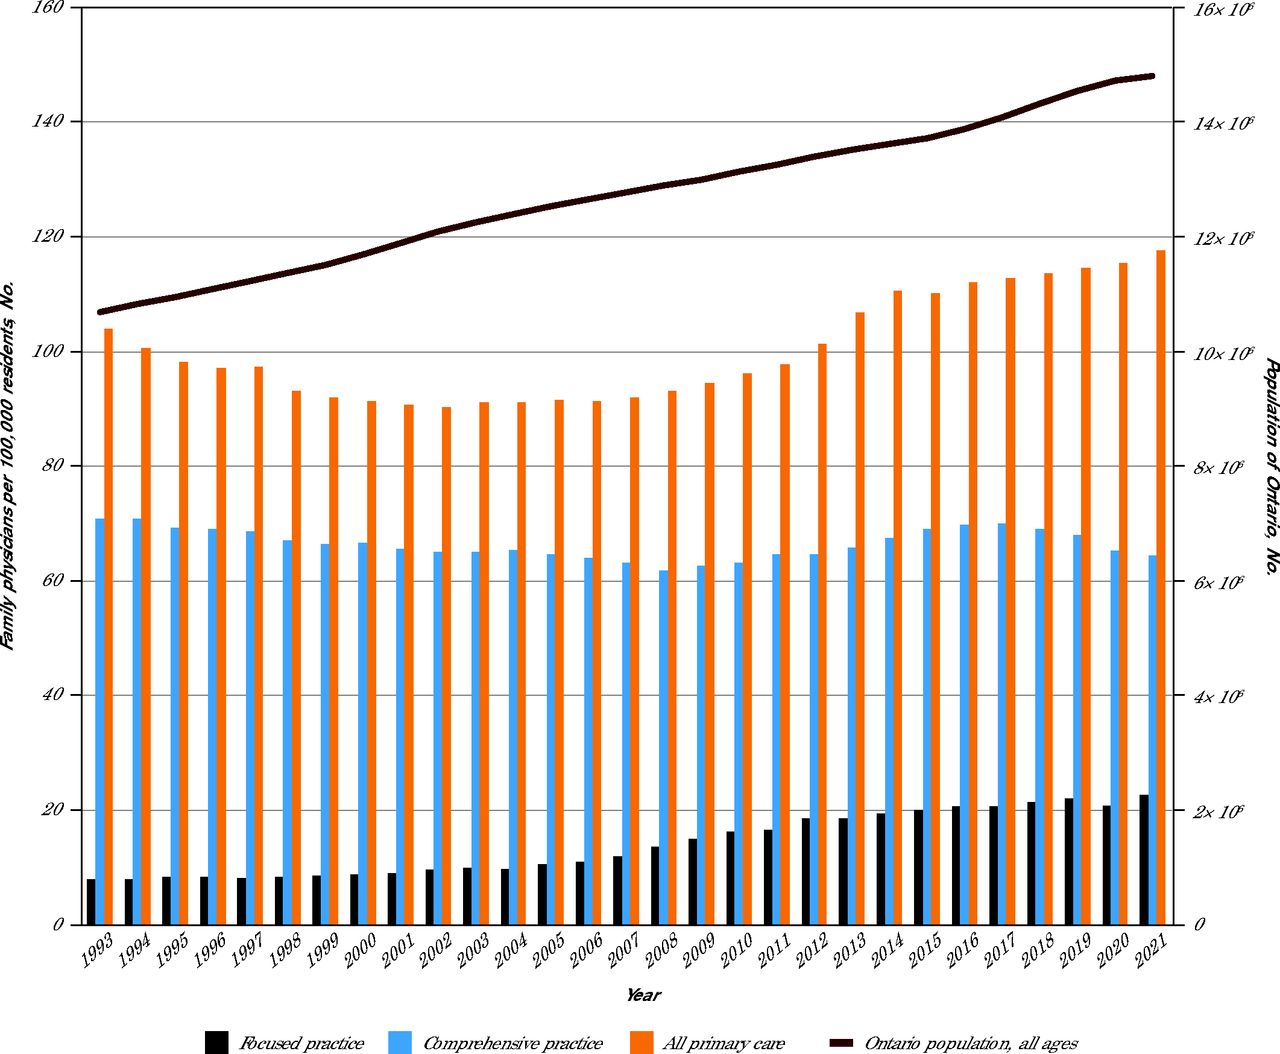
- Figure 2.
Types of Focused Practice Physicians, 1993-2021
FPA = Focused Practice Assessment; GP = general practitioner; Surg asst = surgery assistant.
- Figure 3.
Choice of Primary Care Practice Type, by Years From Graduation, 2009 vs 2021
- Figure 4.
Trends in the Number of Family Physicians Per Capita, by Practice Type, 1993-2021


Tables
- Table 1.
Characteristics of Focused Practice Physicians vs Other Practice Types, 1993 and 2021
Characteristic Comprehensive practice Focused practice Worked <44 days Other practice type No billings Overall 1993 2021 AD 1993 2021 AD 1993 2021 AD 1993 2021 AD 1993 2021 AD 1993 2021 AD Physicians, No. (%) 7,562 (68.1) 9,522 (54.7) −13.4 856 (7.7) 3,351 (19.2) 11.5 1,578 (14.2) 1,433 (8.2) −6.0 409 (3.7) 1,344 (7.7) 4.0 698 (6.3) 1,763 (10.1) 3.8 11,103 (100) 17,413 (100) 0.0 Days worked, mean (SD) 219.8 (60.0) 195.7 (60.4) −24.1 152.9 (63.1) 155.9 (64.3) 3.0 15.7 (12.5) 19.7 (13.1) 4.0 175.6 (76.7) 162.3 (70.3) −13.3 0 (0) 0 (0) 0.0 170.2 (99.5) 151.1 (89.5) −19.1 Age, No. (%), y <40 3,255 (43.0) 2,899 (30.4) −12.6 390 (45.6) 1,427 (42.6) −3.0 1,156 (73.3) 488 (34.1) −39.2 132 (32.3) 435 (32.4) 0.1 312 (44.7) 390 (22.1) −22.6 5,245 (47.2) 5,639 (32.4) −14.9 40-54 2,978 (39.4) 3,235 (34.0) −5.4 273 (31.9) 1,187 (35.4) 3.5 231 (14.6) 322 (22.5) 7.8 138 (33.7) 364 (27.1) −6.7 188 (26.9) 348 (19.7) −7.2 3,808 (34.3) 5,456 (31.3) −3.0 55-64 838 (11.1) 2,117 (22.2) 11.2 119 (13.9) 519 (15.5) 1.6 83 (5.3) 264 (18.4) 13.2 66 (16.1) 293 (21.8) 5.7 73 (10.5) 373 (21.2) 10.7 1,179 (10.6) 3,566 (20.5) 9.9 65-74 439 (5.8) 1,064 (11.2) 5.4 67 (7.8) 181 (5.4) −2.4 77 (4.9) 274 (19.1) 14.2 54 (13.2) 184 (13.7) 0.5 99 (14.2) 468 (26.5) 12.4 736 (6.6) 2,171 (12.5) 5.8 ≥75 52 (0.7) 207 (2.2) 1.5 7 (0.8) 37 (1.1) 0.3 31 (2.0) 85 (5.9) 4.0 19 (4.6) 68 (5.1) 0.4 26 (3.7) 184 (10.4) 6.7 135 (1.2) 581 (3.3) 2.1 Mean age, mean (SD), y 43.4 (11.6) 48.7 (13.1) 5.3 43.7 (12.9) 44.2 (11.9) 0.6 36.9 (13.6) 50.4 (15.9) 13.5 48.7 (14.3) 49.9 (14.6) 1.3 45.8 (15.4) 56.1 (15.7) 42.9 (12.6) 48.8 (13.9) 5.9 Sex, No. (%) Female 2,135 (28.2) 4,866 (51.1) 22.9 187 (21.8) 1,337 (39.9) 18.1 493 (31.2) 773 (53.9) 22.7 81 (19.8) 653 (48.6) 28.8 228 (32.7) 861 (48.8) 16.2 3,124 (28.1) 8,490 (48.8) 20.6 Male 5,427 (71.8) 4,656 (48.9) −22.9 669 (78.2) 2,014 (60.1) −18.1 1,085 (68.8) 660 (46.1) −22.7 328 (80.2) 691 (51.4) −28.8 470 (67.3) 902 (51.2) −16.2 7,979 (71.9) 8,923 (51.2) −20.6 Rurality, No. (%)a 0 3,895 (51.5) 4,760 (50.0) −1.5 485 (56.7) 1,416 (42.3) −14.4 1,181 (74.8) 755 (52.7) −22.2 257 (62.8) 661 (49.2) −13.7 491 (70.3) 944 (53.5) −16.8 6,309 (56.8) 8,536 (49.0) −7.8 1-9 1,647 (21.8) 2,811 (29.5) 7.7 155 (18.1) 879 (26.2) 8.1 177 (11.2) 308 (21.5) 10.3 72 (17.6) 247 (18.4) 0.8 74 (10.6) 346 (19.6) 9.0 2,125 (19.1) 4,591 (26.4) 7.2 10-39 1,342 (17.7) 1,509 (15.8) −1.9 162 (18.9) 705 (21.0) 2.1 127 (8.0) 205 (14.3) 6.3 59 (14.4) 221 (16.4) 2.0 84 (12.0) 266 (15.1) 3.1 1,774 (16.0) 2,906 (16.7) 0.7 ≥40 644 (8.5) 424 (4.5) −4.1 49 (5.7) 337 (10.1) 4.3 66 (4.2) 152 (10.6) 6.4 19 (4.6) 204 (15.2) 10.5 38 (5.4) 186 (10.6) 5.1 816 (7.3) 1,303 (7.5) 0.1 Missing 34 (0.4) 18 (0.2) −0.3 5 (0.6) 14 (0.4) −0.2 27 (1.7) 13 (0.9) −0.8 2 (0.5) 11 (0.8) 0.3 11 (1.6) 21 (1.2) −0.4 79 (0.7) 77 (0.4) −0.3 Years since graduation, No. (%) 0-5 1,171 (15.5) 933 (9.8) −5.7 187 (21.8) 518 (15.5) −6.4 951 (60.3) 230 (16.1) −44.2 50 (12.2) 152 (11.3) −0.9 197 (28.2) 113 (6.4) −21.8 2,556 (23.0) 1,946 (11.2) −11.8 6-10 1,311 (17.3) 1,530 (16.1) −1.3 139 (16.2) 732 (21.8) 5.6 164 (10.4) 222 (15.5) 5.1 58 (14.2) 226 (16.8) 2.6 86 (12.3) 203 (11.5) −0.8 1,758 (15.8) 2,913 (16.7) 0.9 11-20 2,353 (31.1) 1,968 (20.7) −10.4 201 (23.5) 910 (27.2) 3.7 191 (12.1) 238 (16.6) 4.5 97 (23.7) 234 (17.4) −6.3 139 (19.9) 274 (15.5) −4.4 2,981 (26.8) 3,624 (20.8) −6.0 21-30 1,600 (21.2) 2,099 (22) 0.9 162 (18.9) 624 (18.6) −0.3 101 (6.4) 178 (12.4) 6.0 84 (20.5) 257 (19.1) −1.4 97 (13.9) 225 (12.8) −1.1 2,044 (18.4) 3,383 (19.4) 1.0 31-40 771 (10.2) 1,954 (20.5) 10.3 111 (13.0) 393 (11.7) −1.2 94 (6.0) 275 (19.2) 13.2 65 (15.9) 272 (20.2) 4.3 78 (11.2) 396 (22.5) 11.3 1,119 (10.1) 3,290 (18.9) 8.8 >40 356 (4.7) 1,038 (10.9) 6.2 56 (6.5) 174 (5.2) −1.3 77 (4.9) 290 (20.2) 15.4 55 (13.4) 203 (15.1) 1.7 101 (14.5) 552 (31.3) 16.8 645 (5.8) 2,257 (13.0) 7.2 Income quintile by practice location, No. (%)b 1 2,765 (36.6) 2,820 (29.6) −6.9 181 (21.1) 993 (29.6) 8.5 395 (25.0) 409 (28.5) 3.5 133 (32.5) 399 (29.7) −2.8 173 (24.8) 526 (29.8) 5.1 3,647 (32.8) 5,147 (29.6) −3.3 2 1,745 (23.1) 2,159 (22.7) −0.4 149 (17.4) 731 (21.8) 4.4 372 (23.6) 303 (21.1) −2.4 102 (24.9) 288 (21.4) −3.5 148 (21.2) 358 (20.3) −0.9 2,516 (22.7) 3,839 (22.0) −0.6 3 969 (12.8) 1,326 (13.9) 1.1 111 (13.0) 401 (12.0) −1.0 248 (15.7) 180 (12.6) −3.2 43 (10.5) 155 (11.5) 1.0 87 (12.5) 204 (11.6) −0.9 1,458 (13.1) 2,266 (13.0) −0.1 4 757 (10.0) 1,341 (14.1) 4.1 127 (14.8) 369 (11.0) −3.8 173 (11.0) 180 (12.6) 1.6 37 (9.0) 149 (11.1) 2.0 88 (12.6) 203 (11.5) −1.1 1,182 (10.6) 2,242 (12.9) 2.2 5 1,093 (14.5) 1,077 (11.3) −3.1 236 (27.6) 585 (17.5) −10.1 357 (22.6) 202 (14.1) −8.5 82 (20.0) 156 (11.6) −8.4 178 (25.5) 213 (12.1) −13.4 1,946 (17.5) 2,233 (12.8) −4.7 Missing 233 (3.1) 799 (8.4) 5.3 52 (6.0) 272 (8.1) 2.1 33 (2.1) 159 (11.1) 9.0 12 (2.9) 197 (14.7) 11.8 24 (3.5) 259 (14.7) 11.2 354 (3.2) 1,686 (9.7) 6.5 Patient visits by setting, mean % (SD) Office/home/telephone 87.7 (15.6) 94.8 (13) 7.2 47.1 (44.2) 34.4 (39.6) −12.8 80.7 (34.2) 73.2 (40.5) −7.5 91 (18.2) 86.2 (22.0) −4.7 85.87 (32.1) – – 83.6 (25.6) 79.4 (34.7) −4.1 Hospital inpatient 5.4 (6.6) 2.2 (7.3) −3.2 9.8 (21.7) 21.7 (33.4) 11.9 5.9 (16.4) 9.4 (25.0) 3.5 3.7 (8.8) 5.4 (11.4) 1.8 4.64 (17.7) – – 5.7 (10.9) 7.2 (19.9) 1.5 Emergency department 3.7 (8.6) 1.3 (7.3) −2.4 37 (42.9) 40.4 (44.6) 3.3 11.8 (28.2) 11.4 (29.6) −0.4 4.4 (11.8) 6.8 (14.7) 2.4 8.45 (26.2) – – 7.7 (20.5) 10.9 (28.1) 3.3 Long-term care 3.2 (9.7) 1.7 (6.9) −1.6 6.1 (22.3) 3.6 (14.5) −2.5 1.6 (10.3) 6 (22.1) 4.4 0.9 (6.1) 1.6 (7.1) 0.6 1.05 (7.8) – – 3.1 (11.2) 2.4 (11.1) −0.6 AD = the absolute difference
Note: The AD is a percent for categorical variables, or a mean for continuous variables, and reflects the change between the first and last fiscal years of the study period.
↵a Rurality was measured using the Rurality Index of Ontario. A higher value reflects a higher degree of rurality.
↵b Income quintile of practice location is based on neighborhood income quintile with 1 as lowest and 5 as highest.
SUPPLEMENTAL MATERIAL IN PDF FILE BELOW
- Ansari_Supp_Apps.pdf -
PDF file
- Ansari_Supp_Apps.pdf -
VISUAL ABSTRACT IN PDF FILE BELOW
- Ansari_VA.pdf -
PDF file
- Ansari_VA.pdf -
PLAIN-LANGUAGE SUMMARY
Original Research
More Ontario Family Physicians Focus on Narrow Specialties, Fewer Provide Comprehensive Care
Background and Goal:Having family physicians who deliver comprehensive care is critical for addressing evolving population health needs. This study examined long‑term shifts toward focused practice among family physicians in Ontario, Canada, as well as changes in the number of comprehensive family physicians relative to population growth.
Study Approach: Researchers linked multiple Ontario health‑administrative data sets to track practice patterns for every general practitioner or family physician from fiscal years 1993/94 through 2021/22. Analyses were stratified by physician sex and years in practice. A physician was classified as providing comprehensive care if, in a given year, they worked at least 44 billed days, devoted more than 50% of billings to core primary care services, and met the threshold for diversity of primary care activity areas. Physicians who did not meet all three criteria were grouped as follows: focused practice (for example, hospitalist work or emergency medicine); low volume, with fewer than 44 billed days; other primary care roles; a fourth group had no billings for the year.
Main Results:
-
The proportion of family physicians working in focused roles rose to 19.2% in 2021/22, up from 7.7% in 1993/94.
-
Emergency medicine accounted for 37% of focused doctors in 2021/22, followed by hospitalist care at 26.5% and addiction medicine at 8.3%.
-
Although the overall supply of family physicians climbed from 104 to 118 per 100,000 residents during the study period, the supply offering comprehensive care fell from 71 to 64 per 100,000.
-
Of the additional 6,310 family physicians who entered the workforce during the study period, 39.5% were in focused practice.
-
In 2021/22, 60% of focused practice physicians were male and 40% were female. The focused practice group had fewer average days worked at 156 days compared with 196 days for the comprehensive practice group.
Why it Matters:Amid ongoing efforts to address current and impending challenges in access to primary care, findings from this study underscore the limitations of using family physician head counts in workforce planning. Knowing how many family physicians move into focused roles and how the proportion providing comprehensive care has declined can guide policy and practice changes, including better payments aligned with system goals, practice support, job flexibility, team-based care and cross-sectoral workforce planning to make comprehensive family practice the most attractive option to family physicians.
Family Physicians in Focused Practice in Ontario, Canada: A Population-Level Study of Trends From 1993/1994 Through 2021/2022
Hina Ansari, PhD, MSc, et al
MAP Centre for Urban Health Solutions, Li Ka Shing Knowledge Institute, St Michael’s Hospital, Toronto, Ontario, Canada
Visual Abstract
-

In this issue


Jump to section
Related Articles
Cited By...
- No citing articles found.