
Article Figures & Data
Figures
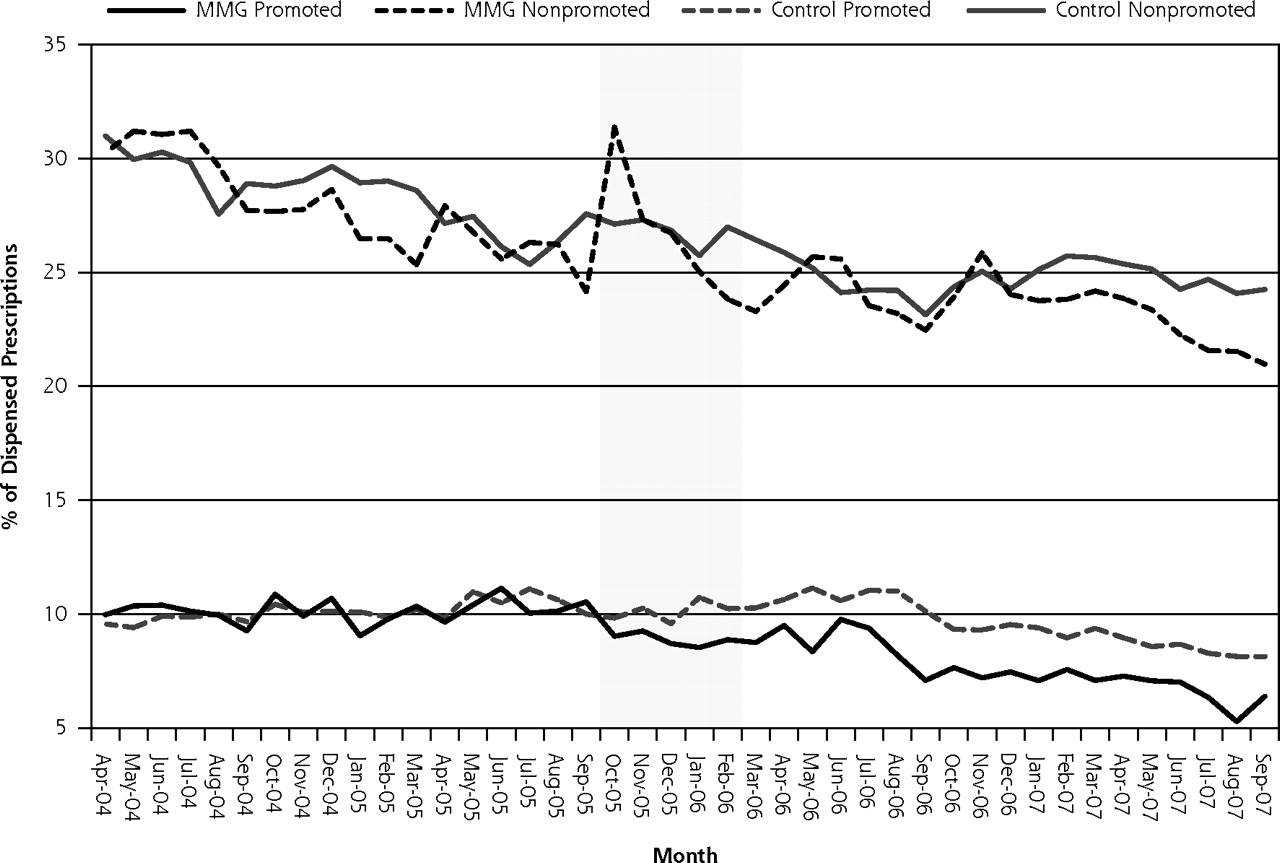
- Figure 1.
Trends in promoted and nonpromoted use among Madras Medical Group (MMG) and control groups (shaded area indicates excluded transition data).
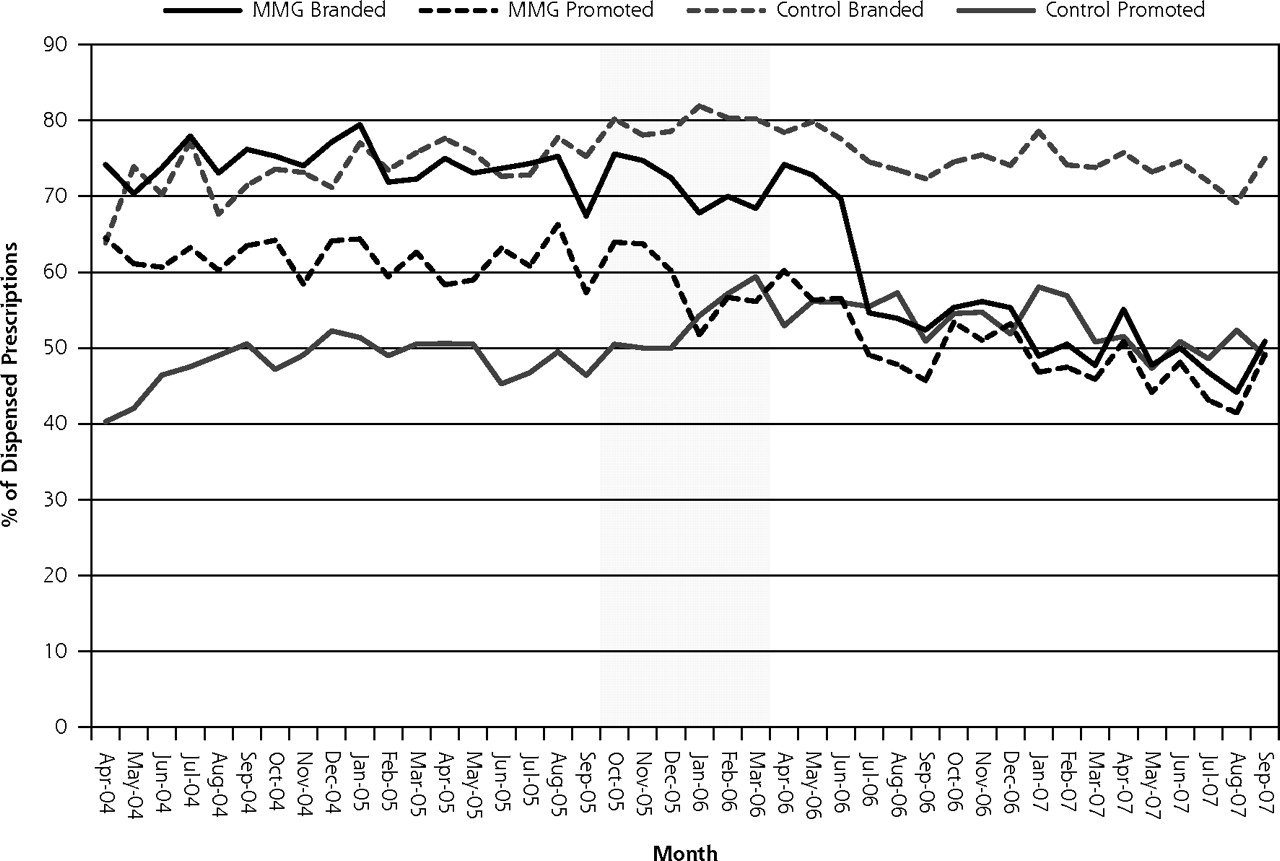
- Figure 2.
Trends in branded and promoted lipid-lowering drug use among Madras Medical Group (MMG) and control groups (shaded area indicates excluded transition data).


Tables
- Table 1.
Trends in Branded Drug Prescribing Before and After Policy Implementation at Madras Medical Group (MMG) Alone and Relative to Control
MMG Trend MMG Relative to Control Prescribing Estimate % 95% CI P Value Estimate % 95% CI P Value a Changes after policy implementation. Note: Baseline level = prescribing rate at month 1 (April 2004); pre trend = monthly change in prescribing rate in period before policy implementation; level change = change in prescribing rate immediately before policy implementation (September 2005) to immediately after policy implementation (April 2006); post trend = monthly change in prescribing rate in period after policy implementation. MMG relative to control estimates are interpreted similarly, but adjusted for concurrent prescribing trends in the control group. Aggregate Baseline level 41.12 39.56 to 42.68 <.001 Pre trend −0.34 −0.48 to −0.19 <.001 −0.14 −0.31 to 0.02 .087 Level changea 1.74 −0.73 to 4.21 .177 1.59 −1.31 to 4.49 .286 Post trenda −0.38 −0.73 to −0.03 .688 −0.20 −0.59 to 0.20 .676 Antidepressants Baseline level 45.24 41.10 to 49.38 <.001 Pre trend −0.37 −0.74 to 0.01 .068 −0.23 −0.84 to 0.38 .459 Level changea −1.44 −8.26 to 5.38 .683 −7.79 −18.16 to 2.58 .146 Post trenda −0.85 −1.78 to 0.08 .094 0.45 −1.04 to 1.95 .135 Antihypertensives Baseline level 30.77 29.09 to 32.45 <.001 Pre trend 0.08 −0.07 to 0.24 .308 0.10 −0.18 to 0.37 .499 Level changea 0.36 −2.48 to 3.20 .804 −4.29 −9.29 to 0.71 .098 Post trenda −0.54 −0.92 to −0.16 <.001 0.20 −0.48 to 0.88 .612 Lipid-lowering drugs Baseline level 75.64 70.64 to 80.64 <.001 Pre trend −0.19 −0.64 to 0.27 .432 −0.51 −0.98 to −0.04 .036 Level changea 0.35 −7.86 to 8.57 .933 −1.91 −10.59 to 6.77 .667 Post trenda −1.36 −2.48 to −0.24 .002 −1.03 −2.17 to 0.10 .132 Respiratory drugs Baseline level 85.45 80.67 to 90.23 <.001 Pre trend −0.36 −0.81 to 0.08 .116 −0.13 −0.64 to 0.38 .620 Level changea −11.93 −20.08 to −3.78 .007 −11.34 −20.75 to −1.93 .021 Post trenda 0.44 −0.63 to 1.51 .017 0.57 −0.67 to 1.80 .065 - Table 2.
Trends in Promoted Drug Prescribing Before and After Policy Implementation at Madras Medical Group (MMG) Alone and Relative to Control
MMG Trend MMG Relative to Control Prescribing Estimate % 95% CI P Value Estimate % 95% CI P Value a Changes after policy implementation. Note: Baseline level = prescribing rate at month 1 (April 2004); pre trend = monthly change in prescribing rate in period before policy implementation; level change = change in prescribing rate immediately before policy implementation (September 2005) to immediately after policy implementation (April 2006); post trend = monthly change in prescribing rate in period after policy implementation. MMG relative to control estimates are interpreted similarly, but adjusted for concurrent prescribing trends in the control group. Aggregate promoted Baseline level 10.00 9.46 to 10.54 <.001 Pre trend 0.02 −0.03 to 0.06 .550 −0.04 −0.10 to 0.02 .163 Level changea −0.46 −1.38 to 0.46 .339 −1.43 −2.53 to −0.33 .013 Post trenda −0.19 −0.31 to −0.07 <.001 −0.01 −0.15 to 0.14 .389 Aggregate nonpromoted Baseline level 31.12 29.83 to 32.41 <.001 Pre trend −0.35 −0.47 to −0.23 <.001 −0.10 −0.25 to 0.06 .219 Level changea 2.19 0.15 to 4.23 .044 3.04 0.39 to 5.69 .028 Post trenda −0.19 −0.48 to 0.10 .086 −0.20 −0.57 to 0.18 .378 Antidepressants Baseline level 25.83 22.40 to 29.26 <.001 Pre trend 0.04 −0.27 to 0.35 .803 −0.33 −0.88 to 0.23 .258 Level changea −5.05 −10.64 to 0.54 .086 −11.34 −20.67 to −2.01 .020 Post trenda −0.61 −1.38 to 0.16 .009 0.71 −0.67 to 2.10 .016 Antihypertensives Baseline level 11.58 10.29 to 12.87 <.001 Pre trend 0.11 0.00 to 0.23 .066 −0.02 −0.33 to 0.28 .889 Level changea 1.60 −0.46 to 3.66 .138 −2.11 −7.03 to 2.81 .404 Post trenda −0.36 −0.65 to −0.07 <.001 0.21 −0.55 to 0.97 .325 Lipid–lowering drugs Baseline level 62.45 59.88 to 65.02 <.001 Pre trend −0.07 −0.31 to 0.17 .572 −0.32 −0.69 to 0.05 .094 Level changea −3.36 −7.81 to 1.09 .150 −9.98 −16.80 to −3.16 .006 Post trenda −0.66 −1.24 to −0.09 .002 −0.30 −1.18 to 0.59 .932 Respiratory drugs Baseline level 48.51 43.43 to 53.59 <.001 Pre trend −0.48 −0.95 to −0.01 .053 −0.73 −1.27 to −0.18 .012 Level changea 2.11 −6.59 to 10.81 .638 3.88 −6.21 to 13.97 .454 Post trenda −0.10 −1.23 to 1.03 .272 0.03 −1.29 to 1.35 .060 - Table 3.
Trends in Average Cost Per Prescription Before and After Policy Implementation at Madras Medical Group (MMG) Alone and Relative to Control
MMG Trend MMG Relative to Control Prescribing Estimate $ 95% CI P Value Estimate $ 95% CI P Value a Changes after policy implementation. Note: Baseline level = prescribing rate at month 1 (April 2004); pre trend = monthly change in prescribing rate in period before policy implementation; level change = change in prescribing rate immediately before policy implementation (September 2005) to immediately after policy implementation (April 2006); post trend = monthly change in prescribing rate in period after policy implementation. MMG relative to control estimates are interpreted similarly, but adjusted for concurrent prescribing trends in the control group. Aggregate Baseline level 37.94 36.43 to 39.45 <.001 Pre trend −0.30 −0.44 to −0.16 <.001 −0.51 −0.70 to −0.32 <.0001 Level changea 2.84 0.24 to 5.45 .041 5.18 1.71 to 8.65 .005 Trend changea −0.15 −0.49 to 0.18 .159 −0.28 −0.73 to 0.18 .091 Antidepressants Baseline level 37.70 34.56 to 40.84 <.001 Pre trend −0.34 −0.63 to −0.05 .027 −0.46 −0.81 to −0.12 .010 Level changea −1.80 −7.17 to 3.56 .515 −5.96 −12.35 to 0.43 .072 Post trenda −0.16 −0.86 to 0.55 .377 0.22 −0.61 to 1.05 .007 Antihypertensives Baseline level 16.45 15.85 to 17.05 <.001 Pre trend −0.03 −0.09 to 0.02 .285 −0.10 −0.20 to 0.00 .059 Level changea −0.86 −1.90 to 0.19 .118 −1.31 −3.20 to 0.59 .181 Post trenda −0.06 −0.19 to 0.07 .484 0.02 −0.22 to 0.27 .094 Lipid-lowering drugs Baseline level 80.04 76.85 to 83.23 <.001 Pre trend −0.07 −0.37 to 0.22 .632 −0.01 −0.41 to 0.39 .955 Level changea −1.93 −7.41 to 3.56 .497 2.38 −5.04 to 9.79 .532 Post trenda −0.67 −1.38 to 0.04 .009 −0.71 −1.67 to 0.24 .016 Respiratory drugs Baseline level 81.47 76.75 to 86.19 <.001 Pre trend −0.25 −0.69 to 0.18 .267 −0.67 −1.29 to −0.06 .036 Level changea −3.57 −11.70 to 4.56 .396 −0.47 −11.84 to 10.91 .936 Post trenda −0.08 −1.13 to 0.97 .595 −0.28 −1.76 to 1.21 .373
Supplemental Appendixes
Supplemental Appendix 1. Promoted Drug List; Supplemental Appendix 2. Specific Drugs Explored for Prescribing Trends
Files in this Data Supplement:
- Supplemental data: Appendixes - PDF file, 3 pages, 147 KB
The Article in Brief
Effect of Drug Sample Removal on Prescribing in a Family Practice Clinic
Daniel M. Hartung , and colleagues
Background Pharmaceutical marketing practices and potential financial conflicts of interest between doctors and the pharmaceutical industry have raised a number of ethical concerns. This study evaluated the effect of a rural family practice�s policy prohibiting prescription drug samples and visits from pharmaceutical representatives.
What This Study Found There were modest reductions in brand name drug use in several classes of drugs after the prohibition of prescription drug samples and visits by pharmaceutical representatives. Levels of brand name drug use did not change significantly after the policy was implemented, but branded drugs prescribed for respiratory disease declined significantly (by 11.34 percent) compared with those prescribed by a control group. Prescriptions of promoted cholesterol-lowering drugs and antidepressants were reduced by approximately 9.98 percent and 11.34 percent, respectively. The average cost per prescription for lipid-lowering drugs was significantly reduced by $0.70 per prescription per month. Overall, however, average prescription drug costs increased by $5.18 immediately after policy implementation.
Implications
- The authors suggest that clinics considering similar restrictions should evaluate both the positive and negative roles samples and industry representatives play on patient care.


Jump to section
Related Articles
Cited By...
- Perceptions of the provision of drug information, pharmaceutical detailing and engagement with non-personal promotion at a large physicians network: a mixed-methods study
- Drug samples in family medicine teaching units: a cross-sectional descriptive study: Part 1: drug sample management policies and the relationship between the pharmaceutical industry and residents in Quebec
- Legislative, educational, policy and other interventions targeting physicians' interaction with pharmaceutical companies: a systematic review
- Restrictions On Pharmaceutical Detailing Reduced Off-Label Prescribing Of Antidepressants And Antipsychotics In Children
- Transformation and Renewal
- In This Issue: Longitudinal Follow-up Yields New Insights