Article Figures & Data
Tables


Predictor Breast Cancer Screening Bowel Cancer Screening Hip Fracture Prevention CVD Prevention % (95% CI) ORa (95% CI) % (95% CI) ORa (95% CI) % (95% CI) ORa (95% CI) % (95% CI) ORa (95% CI) Age, y 50-54 86 (77-92) 0.6 (0.3-1.0) 89 (81-95) 0.6 (0.3-1.0) 80 (71-88) 1.2 (0.7-2.2) 70 (59-79) 0.7 (0.4-1.3) 55-59 90 (82-95) 0.6 (0.3-1.1) 95 (88-98) 0.5 (0.3-0.8) 83 (73-90) 1.0 (0.6-1.8) 62 (51-72) 0.5 (0.3-1.0) 60-64 98 (93-100) 0.9 (0.5-1.6) 98 (93-100) 0.7 (0.4-1.3) 87 (79-92) 1.3 (0.7-2.2) 75 (66-83) 0.9 (0.5-1.7) 65-70 95 (88-98) 1.0 100 (96-100) 1.0 82 (72-89) 1.0 74 (63-83) 1.0 P value .12 .05 .73 .13 Sex Male 92 (88-95) 1.0 94 (90-97) 1.0 83 (78-88) 1.0 67 (60-73) 1.0 Female 93 (89-97) 1.0 (0.7-1.6) 97 (93-99) 1.5 (1.0-2.2) 84 (77-89) 1.0 (0.7-1.6) 73 (66-80) 1.3 (0.9-2.0) P valueb .81 .058 .84 .18 Educationc Lower 97 (93-99) 1.0 98 (94-100) 1.0 86 (79-92) 1.0 78 (69-85) 1.0 Higher 91 (87-94) 0.6 (0.4-1.0) 94 (91-97) 0.5 (0.3-0.8) 82 (77-87) 0.8 (0.5-1.1) 66 (60-72) 0.6 (0.4-0.9) P valued .03 .002 .19 .026 Past experiencee No – – 96 (93-98) 1.0 (0.6-1.4) 84 (79-98) 0.9 (0.5-1.7) 69 (64-74) 1.0 (0.6-1.8) Yes – – 94 (89-97) 1.0 80 (66-90) 1.0 76 (61-86) 1.0 P valued – .85 .82 .98 -
CVD = cardiovascular disease; OR = odds ratio.
-
↵a OR calculated from multivariable logistic regression with the proportional odds assumption, across all response levels excluding unknown. OR >1.0 indicates higher estimates of effectiveness.
-
↵b df = 3.
-
↵c df = 1.
-
↵d Lower = primary or secondary school only. Higher = post-school qualification.
-
↵e Prior bowel cancer screening, diagnosis of osteoporosis or current medication for osteoporosis, and history of vascular disease. Breast cancer screening—only 5 women had never been screened so not included in the mode.
-

Predictor Breast Cancer Screening Bowel Cancer Screening Hip Fracture Prevention CVD Prevention % (95% CI) ORa (95% CI) % (95% CI) ORa (95% CI) % (95% CI) ORa (95% CI) % (95% CI) ORa (95% CI) Age, y 50-54 58 (46-68) 0.4 (0.2-0.7) 56 (45-66) 0.4 (0.2-0.7) 52 (42-63) 0.7 (0.4-1.2) 28 (19-39) 0.5 (0.3-0.9) 55-59 71 (60-80) 0.8 (0.4-1.3) 70 (59-79) 0.7 (0.4-1.3) 64 (53-74) 1.0 (0.6-1.8) 48 (37-58) 1.0 (0.6-1.8) 60-64 81 (72-88) 1.5 (0.9-2.5) 84 (75-90) 1.2 (0.7-2.0) 71 (62-79) 1.3 (0.7-2.2) 59 (49-69) 1.3 (0.8-2.3) 65-70 78 (68-86) 1.0 79 (69-87) 1.0 71 (61-81) 1.0 51 (40-62) 1.0 P valueb <.0001 .0006 .11 .006 Sex Male 68 (61-74) 1.0 70 (64-76) 1.0 63 (56-69) 1.0 42 (35-49) 1.0 Female 78 (71-84) 1.4 (0.9-2.0) 78 (70-84) 1.4 (1.0-2.1) 68 (61-75) 1.3(0.9-2.0) 54 (46-62) 1.6 (1.1-2.3) P valuec .12 .081 .16 .022 Educationd Lower 84 (76-90) 1.0 86 (79-92) 1.0 82 (74-89) 1.0 67 (58-76) 1.0 Higher 67 (61-73) 0.4 (0.2-0.6) 67 (61-73) 0.4 (0.2-0.5) 54 (48-60) 0.4 (0.3-0.7) 38 (32-45) 0.4 (0.3-0.5) P valuec <.0001 <.0001 .0001 <.0001 Past experiencee No – – 73 (67-78) 0.8 (0.5-1.2) 65 (60-71) 1.0 (0.5-1.8) 48 (42-53) 1.0 (0.6-1.8) Yes – – 73 (64-80) 1.0 62 (47-75) 1.0 47 (33-61) 1.0 P valuec – .3 .93 .95 -
VD = cardiovascular disease; OR = odds ratio.
-
↵a OR calculated from multivariable logistic regression with the proportional odds assumption, across all response levels excluding unknown. OR >1.0 indicates higher estimates of benefit.
-
↵b df = 3.
-
↵c df = 1.
-
↵d Lower = primary or secondary school only. Higher = post-school qualification.
-
↵e Prior bowel cancer screening, diagnosis of osteoporosis or current medication for osteoporosis, and history of vascular disease. Breast cancer screening—only 5 women had never been screened so not included in the mode.
-
Additional Files
Supplemental Appendix
Supplemental Appendix 1.Questionnaire: Intervention Questions
Files in this Data Supplement:
- Supplemental data: Appendix - PDF file, 2 pages, 188 KB
The Article in Brief
Ben Hudson , and colleagues
Background An informed decision about whether to accept screening and preventive care requires balancing the potential benefits and harms of the intervention. This study assesses participants' estimates of the benefit, as well as the minimum acceptable benefit, of screening for breast and bowel cancer and of medication to prevent hip fracture and cardiovascular disease.
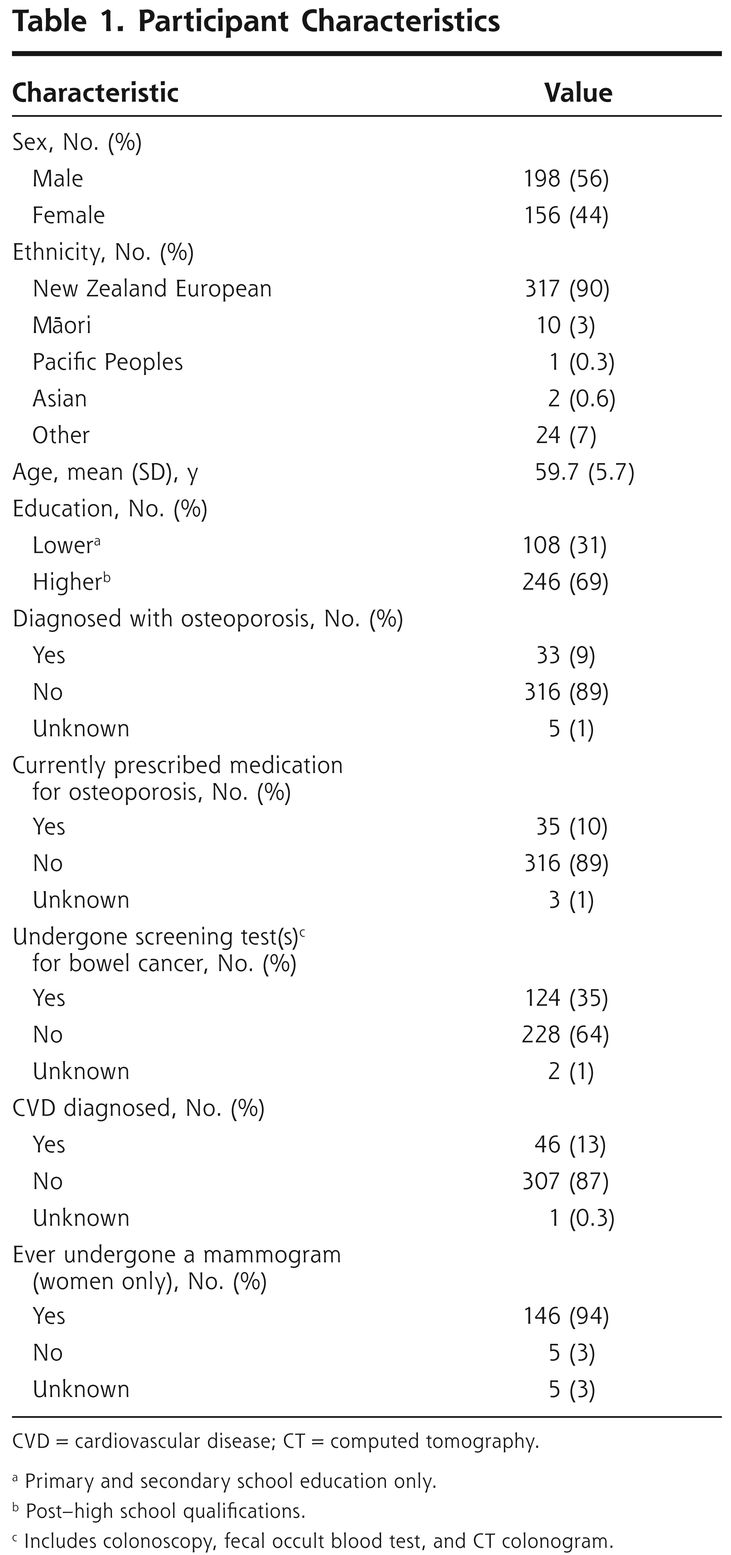
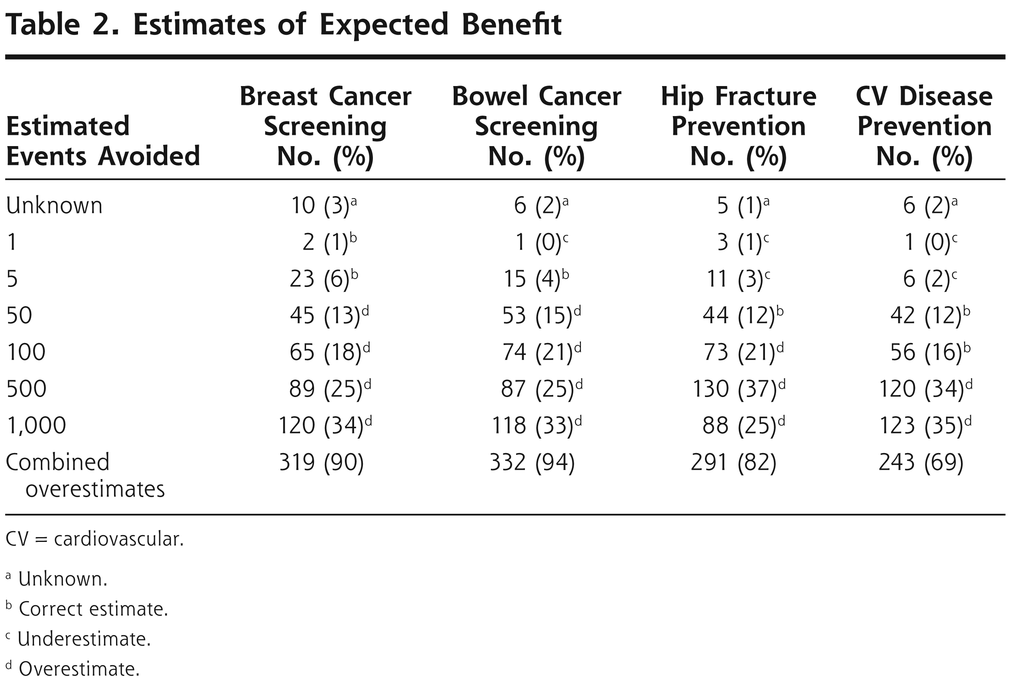
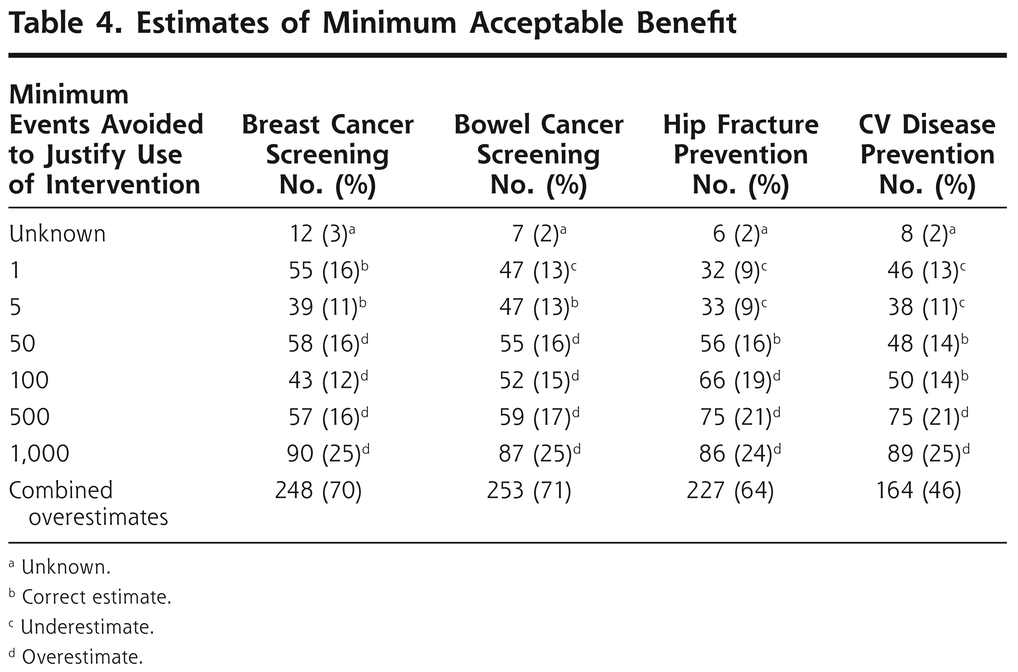
What This Study Found Many patients appear willing to undergo preventive care on the basis of overly optimistic expectations of the benefits of preventive interventions and screening. Data from 354 patient questionnaires found that participants overestimated the degree of benefit of all interventions. A lower level of education was associated with higher estimates of minimum acceptable benefit for all interventions. Increasing age was associated with higher levels of minimum acceptable benefit for all interventions other than hip fracture prevention.
Implications
- The authors conclude that, when counseling patients, physicians should consider these misperceptions, which may impair informed decision making about the use of such interventions.
- Clinicians should also consider using decision aids when discussing preventive care, especially with older patients and those with a lower level of education, as the aids may reduce patients' tendency to overestimate intervention benefits.


