
Abstract
PURPOSE There is limited trial evidence concerning the long-term effects of screening for type 2 diabetes on population morbidity. We examined the effect of a population-based diabetes screening program on cardiovascular morbidity, self-rated health, and health-related behaviors.
METHODS We conducted a pragmatic, parallel-group, cluster-randomized controlled trial of diabetes screening (the ADDITION-Cambridge study) including 18,875 individuals aged 40 to 69 years at high risk of diabetes in 32 general practices in eastern England (27 practices randomly allocated to screening, 5 to no-screening for control). Of those eligible for screening, 466 (2.9%) were diagnosed with diabetes. Seven years after randomization, a random sample of patients was sent a postal questionnaire: 15% from the screening group (including diabetes screening visit attenders and non-attenders) and 40% from the no-screening control group. Self-reported cardiovascular morbidity, self-rated health (using the SF-8 Health Survey and EQ-5D instrument), and health behaviors were compared between trial groups using an intention-to-screen analysis.
RESULTS Of the 3,286 questionnaires mailed out, 1,995 (61%) were returned, with 1,945 included in the analysis (screening: 1,373; control: 572). At 7 years, there were no significant differences between the screening and control groups in the proportion of participants reporting heart attack or stroke (OR = 0.90, 95% CI, 0.71–1.15); SF-8 physical health summary score as an indicator of self-rated health status (β −0.33, 95% CI, −1.80 to 1.14); EQ-5D visual analogue score (β: 0.80, 95% CI, −1.28 to 2.87); total physical activity (β 0.50, 95% CI, −4.08 to 5.07); current smoking (OR 0.97, 95% CI, 0.72 to 1.32); and alcohol consumption (β 0.14, 95% CI, −1.07 to 1.35).
CONCLUSIONS Invitation to screening for type 2 diabetes appears to have limited impact on population levels of cardiovascular morbidity, self-rated health status, and health behavior after 7 years.
INTRODUCTION
Population screening has been recommended by many national organizations.1,2 Whether the overall benefits of screening for diabetes outweigh any associated harms is uncertain, however.3–5 It is important to quantify the population impact of screening. Even relatively modest adverse effects for the majority of participants who screen negative may offset a large benefit to the few who screen positive.
Screening for diabetes may affect physical and psychological morbidity and behavioral outcomes at the population level.5 Some studies have suggested that diabetes screening is associated with a reduction in risk of cardiovascular disease (CVD), but most research is restricted to the small subgroup of screened people found to have diabetes.6–10 A modeling study11 showed that, compared with no screening, population-based diabetes screening strategies might reduce the overall incidence of myocardial infarction. Such modeling studies, however, are only as robust as their underlying assumptions and highlight the need for data from randomized trials. It is also important to measure self-rated health, which predicts mortality and morbidity independent of chronic disease,12,13 and which is often overlooked in screening programs.14 To date, diabetes screening studies including self-rated health and functional assessments have focused on screen-detected individuals in the short- or medium-term,15–17 or on those with negative screening tests.18 Most studies have been small and observational, and few have included formal comparison with an unscreened (control) group.19
Participation in a screening program can encourage behavior change through provision of information about disease risk.5,20–22 Conversely, screening might falsely reassure some people and contribute to adoption of unhealthy behaviors, especially among those who screen negative.23 Evidence about the effects of diabetes screening on health-related behaviors is scarce, although we have previously shown no adverse effects up to 15 months after a negative screening test.18 Previous studies, however, were not randomized trials and/or relied on measures of behavioral intentions rather than actual behavior.18,24
To examine the effect of a diabetes screening program on cardiovascular morbidity, self-rated health, and health-related behavior, we conducted a survey at 7 years follow-up within a cluster-randomized controlled trial of screening for type 2 diabetes in primary care, the ADDITION-Cambridge study.25
METHODS
ADDITION-Cambridge is a pragmatic, primary care-based, cluster-randomized study consisting of 2 phases: (1) a trial of screening for type 2 diabetes, and (2) a treatment trial in individuals with screen-detected diabetes. The design and rationale have previously been reported.25 This paper outlines results from a survey embedded in the screening phase of the trial. Ethical approval was granted by Cambridgeshire Research Ethics Committee (ref 02/5/54); all participants gave written informed consent.
A total of 138 general practices in Eastern England were approached, and 63 agreed to participate. Practices were independently randomized to screening or control. This analysis includes 27 screening practices and 5 control practices (Figure 1). Since 99% of the English population is registered with general practitioners, the sampling frame is population-based.
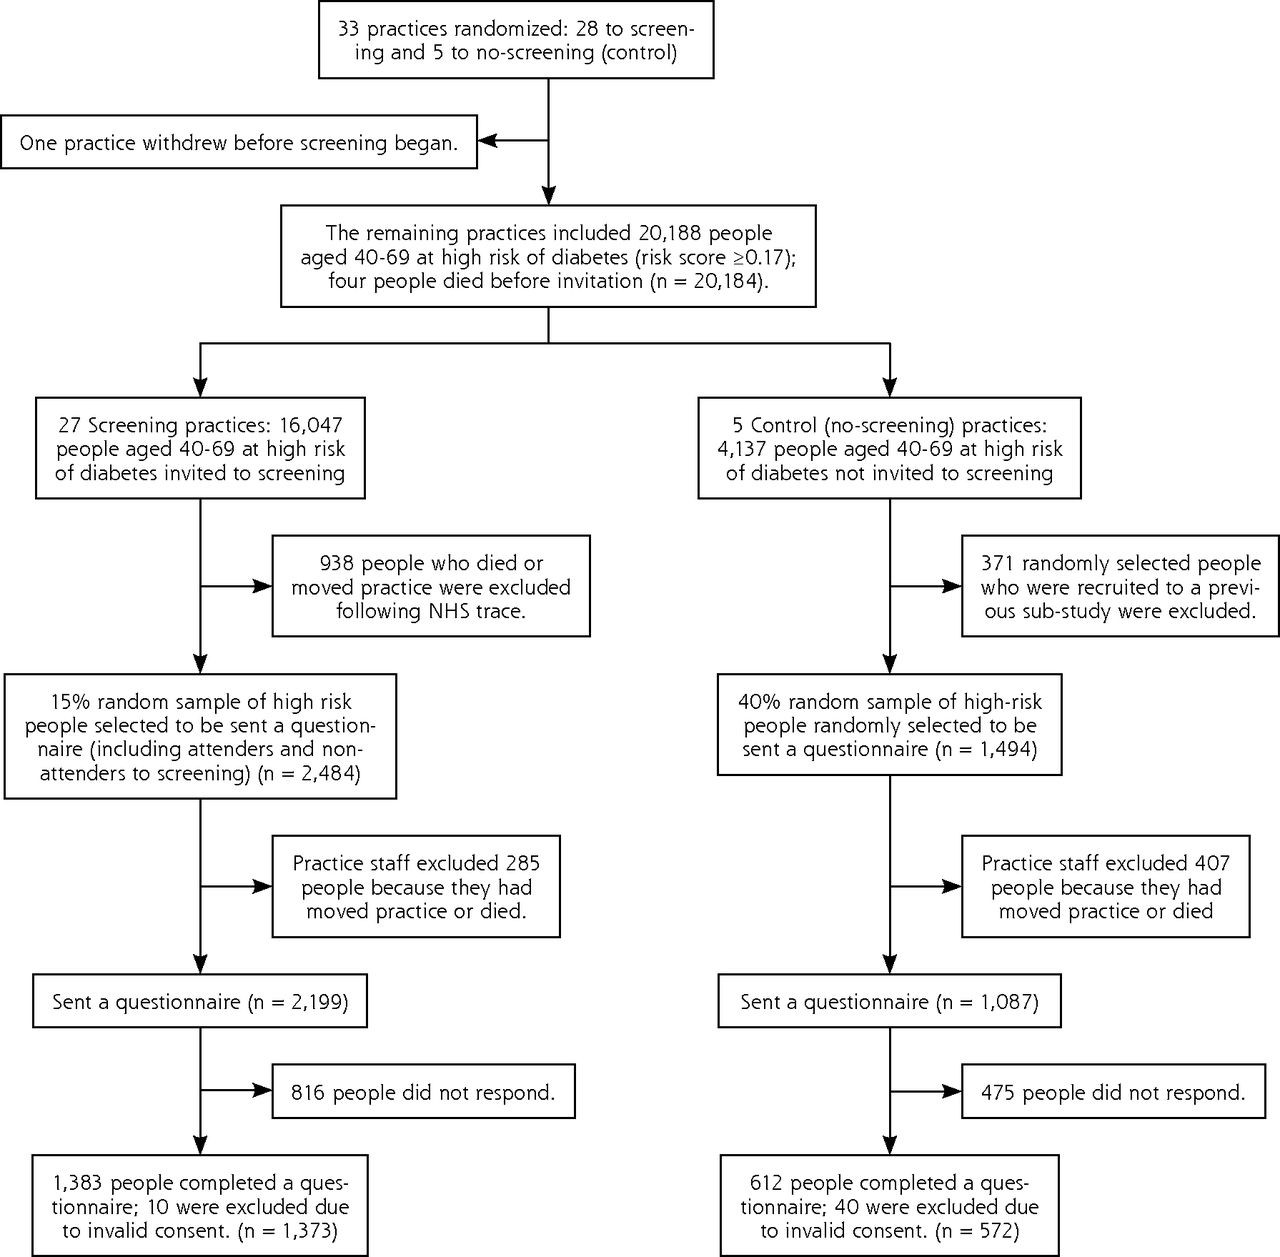
Practice and participant flow in the ADDITION-Cambridge diabetes screening trial.
In the screening practices, people aged 40 to 69 years without known diabetes but at high risk of having undiagnosed type 2 diabetes were identified from the practice registers using a previously validated risk score26 and invited to attend a stepwise screening program between January 2002 and March 2006. The screening program27 included random capillary blood glucose and glycated hemoglobin (HbA1c) testing at an initial practice visit, fasting capillary blood glucose testing at a subsequent visit, and finally a standard 75g oral glucose tolerance test to confirm the diagnosis (WHO 1999 criteria).28 Exclusion criteria included pregnancy, lactation, an illness with a likely prognosis of less than 1 year, and a psychiatric illness likely to limit study involvement or invalidate informed consent. Practice teams were notified of the test results with a clear statement of whether the individual met diagnostic criteria for type 2 diabetes. Participants identified as having diabetes were subsequently managed intensively or routinely according to the treatment regimen to which their practice was allocated. Family physicians, practice nurses, and participants in the intensive treatment group were educated in target-driven management (using medication and promotion of healthy lifestyles) of hyperglycemia, blood pressure, and cholesterol.25,29,30 Individuals in the routine care group received the standard pattern of diabetes care according to current recommendations.31 Practice staff were requested to inform individuals who did not have diabetes, “This test is normal, you do not have diabetes.”
In the no-screening control practices, people at high risk of having diabetes were identified using the same validated risk score, but were not invited for screening. Practice staff were not given the risk score information.
Questionnaire Survey
A postal questionnaire survey was conducted between May and October 2009, 7 years after practice randomization. The 32 participating practices included 20,184 potential participants (Figure 1). Of these, patients no longer registered with the practice, deceased patients, and patients from the no-screening control practices who had been randomly selected to participate in a previously reported sub-study of the ADDITION-Cambridge trial19 were removed from the study population to avoid overburdening research participants. A computer-generated random sample was drawn from this sampling frame and a list sent to each general practice. Practice staff then excluded individuals who were unable to complete the questionnaire because of a terminal illness, a major psychiatric disorder, or any other condition that might invalidate their consent or ability to fill in the questionnaire. Practice staff sent a cover letter, an information sheet, a consent form, a questionnaire, and a freepost envelope to each individual. A reminder was sent to nonresponders after 4 weeks.
The questionnaire elicited patients’ experience of cardiovascular disease events, prescription of cardioprotective medications, self-rated health status, health-related behaviors, and health service usage over the preceding 3 months.32 Functional status and health utility were measured using the UK versions of the SF-833 and the EQ-5D, respectively.34 Physical activity levels were measured using the short-form International Physical Activity Questionnaire.35 Dietary behavior was assessed using simple questions about consumption of green leafy vegetables (cabbage, broccoli, etc), “other” vegetables (peas, carrots, beans, etc), fresh fruit, whole meal or brown bread, oily fish, and meat products derived from a validated food frequency questionnaire.36
Outcomes
We tracked 9 outcomes:
-
self-reported prevalence of cardiovascular events, hypertension, and dyslipidemia
-
proportion of patients prescribed cardioprotective medication (glucose-lowering drugs, antihypertensives, lipid-lowering drugs, and antiplatelet medication)
-
functional status (SF-8 physical and mental health summary scores)
-
health utility (EQ-5D and visual analog scores)
-
energy expenditure related to physical activity in metabolic equivalent of task (MET) hours per week for total, vigorous, moderate, and walking activities, and sedentary time measured in hours sitting per day
-
proportion of people consuming 1 or more portions per day of particular groups of foods
-
proportion of people currently smoking
-
number of units of alcohol consumed per week
-
health service use within the previous 3 months
Statistical Analysis
We analyzed the data primarily by intention-to-screen for all outcomes. End points were compared between trial arms at 7 years after screening using logistic regression for categorical outcomes and linear regression for continuous outcomes, with robust standard errors to account for clustering by practice. Where non-normality for continuous outcomes could not be resolved by log-transformation, 95% CIs were estimated using semi-parametric bias-corrected and accelerated bootstrap regression with 1,000 resamples. Negative binomial regression (appropriate for overdispersed count data) was used to compare the number of hospital admissions, family physician consultations, and nurse consultations. The primary comparison was between the screening group (intensive treatment and routine care arms) and the no-screening (control) group. Subgroup comparisons were also conducted between the screening attenders and nonattenders, and between nonattenders and controls. Analyses were conducted to examine baseline differences in risk score variables between responders and non-responders to the questionnaire, both overall and by trial group. Analyses were completed using Stata v13 (Stata Corp).
Sample Size
Given the uneven (1:6) randomization ratio of control and screening practices, a higher proportion of participants were sampled in the control group. Assuming a 95% confidence level and 80% power, we calculated detectable differences for the SF-36 and the EQ-5D index.37 Assuming a 50% response rate19 and 33 patients per cluster, a 30% sample from the control practices and a 15% sample from the intervention practices corresponded to an effective sample of 560 controls and 1,200 intervention participants returning questionnaires, with a design effect ranging from 1 to 3. This would allow the detection of at least a 4-point difference between groups in any mean SF-36 domain score and a 0.022-point difference in mean EQ-5D index. Given the high correlation between the much briefer SF-8 and the SF-36,33 similar effect sizes could be detected using the SF-8. Based on the same assumptions, detectable differences in the proportion with stroke and/or heart attack ranged from 0.99 to 2.78%. Estimates of heart attack and stroke frequencies (1%–5%) and intraclass correlation coefficients at the postcode level were derived from the Health Survey for England 2008.38 We further inflated the number of control participants sent a questionnaire from 30% to 40%, since we did not know how many had died or moved away from their practice.
RESULTS
In the whole screening program, 466 participants (2.9% of those eligible for screening) were diagnosed with diabetes.39 Of the 3,286 questionnaires sent out, 1,995 (61%) were returned by eligible participants; 50 questionnaires had invalid consent. The response rate was 62% in the screening group and 53% in the control group. The analysis includes 1,945 individuals: 1,221 screening-attenders (47 with screen-detected diabetes), 152 screening non-attenders, and 572 no-screening control participants. Responders to the questionnaire were more likely to be older, to be female, to have been prescribed antihypertensive medication, to have a low body mass index (BMI), and to have exhibited a higher risk of undiagnosed diabetes at baseline than non-responders (all P values <0.05, data not shown). Patterns of response were similar between screening and control groups.
Screening and control groups were well balanced for practice and patient characteristics (Table 1). Participants had a median age of 60 years at entry into the study. The majority of respondents were male; the majority were overweight; 49% of individuals were prescribed antihypertensive medication. Most responders to the survey were of Caucasian ethnicity (99%), were retired or in part-time employment, and had an intermediate or high socioeconomic level (data not shown).
Baseline Practice and Patient Characteristics in the ADDITION-Cambridge Screening Trial; Data are Median (Inter-quartile Range) Unless Otherwise Indicated
There were no significant differences between groups in the proportion of participants reporting cardiovascular disease, hypertension, and prescription of antihypertensives or glucose-lowering medication at 7 years (Table 2). Higher numbers of participants in the control group reported dyslipidemia and prescription of lipid-lowering and antiplatelet medication than in the screening group.
Impact of Screening on Cardiovascular Morbidity and the Prescription of Cardioprotective Drugs in the ADDITION-Cambridge Trial at 7-year Follow-up
There was no difference in functional status (SF-8 physical and mental health summary scores), health utility (EQ-5D results), smoking status, and alcohol consumption levels between the screening and control groups (Table 3). Participants from both groups reported similar dietary patterns and similar levels of physical activity and time spent sitting.
Impact of Screening on Self-rated Health Status and Self-reported Health Behaviors in the ADDITION-Cambridge Trial at 7-year Follow-up
There was no difference in total number of reported hospital and primary care (family physician or primary care nurse) consultations between the screening and the control groups (Table 3).
Adoption of Unhealthy Behaviors (Investigation of a False Reassurance Effect)
The 794 respondents who screened negative at their initial screening test (random blood glucose and HbA1c) were similar to the no-screening control group in age, sex, BMI, and prescribed steroids; but they had a slightly lower diabetes risk score and were less likely to have been prescribed antihypertensive medication. Comparisons between respondents who screened negative and those in the no-screening control group showed no evidence of less healthy behaviors among those who might have been reassured by their test result, with no significant differences for any self-reported health behaviors.
Effect of Screening Attendance
We found no significant differences between screening attenders and non-attenders in self-reported prevalence of CVD, self-rated health status, or self-reported health behaviors. Similarly, non-attenders were similar to control participants for all outcome measures.
DISCUSSION
After 7 years of follow-up, a single round of stepwise screening for type 2 diabetes among high-risk people aged 40 to 69 years was not associated with a significant reduction in self-reported CVD morbidity or positive changes in self-reported health behaviors. Diabetes screening did not adversely affect self-rated functional status or health utility. Our findings also suggest that attendance at a primary care-based diabetes screening program does not lead to the adoption of unhealthy behaviors through false reassurance or to an increase in subsequent health service use.
Our evaluation of CVD morbidity differs from that conducted in previous diabetes screening studies, which have exclusively examined people with screen-detected disease, rather than all those invited for screening as we have done in this trial.6–10,40 There are several possible explanations why our screening program may not have contributed to a reduction in population-level CVD morbidity.
Ad hoc, opportunistic screening for diabetes at the primary care level is ongoing in the United Kingdom, following recommendations from organizations such as Diabetes UK41 and more recently the English Department of Health.1 The extent of such opportunistic diabetes screening, however, may have been limited.42
UK primary care has continually improved in the detection and management of CVD risk factors,43 partly because of the pay-for-performance scheme of remuneration for family physicians.44
A moderate proportion of questionnaire recipients did not respond. Those that did respond were more likely to be older, to be female, to have been prescribed antihypertensive medication, to have a low BMI, and to have a lower risk of undiagnosed diabetes. No clear direction of effect for this possible response bias can be identified.
Screening was not repeated, potentially limiting the additional benefits that could have been derived in those who might have developed diabetes after the first round of screening.
A survivor effect may also have played a role. Comparing survivors at this stage may show no difference because preventable deaths may have occurred in the control group between randomization and the time of the survey. All-cause mortality rates, however, were very similar in the screening and control groups after 10 years of follow-up (HR 1.06, 95% CI, 0.90–1.25).39
It is possible that population-based screening for type 2 diabetes is associated with limited benefits at the population level. While earlier detection may have benefitted the minority diagnosed with diabetes, the proportion (2.9%) may have been too small to influence population mortality or morbidity in the ADDITION-Cambridge trial.39
Furthermore, no systematic advice was given to individuals who screened negative in the ADDITION-Cambridge trial; patients were simply told that they did not have diabetes. Our results suggest that screening alone is unlikely to have a major impact on participant’s health behavior (either positive or negative). Whether education at the point of screening might influence motivation to change behaviors is uncertain; further research is needed to address this question.
We found that a higher proportion of people were prescribed lipid-lowering and anti-platelet medication in the control compared with the screening group, though this may have been a chance finding given the large number of statistical tests conducted in this analysis. Our findings for self-rated health status are consistent with those of 2 previous diabetes screening studies, which reported no difference between the screening and control groups at 12 to 15 months19 or between those who screened negative and unscreened individuals at 3 to 6 months or 12 to 15 months after screening.18
Our findings concerning the effect of diabetes screening on health-related behaviors are consistent with observational data.18,24 Similarly, our results on health service use are consistent with studies of screening, which have generally not found screening to affect the long-term population use of primary care services.5,45–47
This is the first trial to comprehensively assess the long-term population-level effects of screening for diabetes. The cluster randomized design and the intention-to-screen approach allowed an estimation of the overall impact of screening by ensuring that a major harm or benefit was not missed.48 Screening and control groups were well balanced for practice and patient characteristics, suggesting that we present unbiased estimates of the intervention effect. We included a large number of high-risk individuals, with power to detect small but relevant differences in long-term outcomes using reliable and validated tools. The post-test survey included random sampling, and the 61% response rate compares favorably with most health-related population surveys.49 Response rates were similar in the screened and unscreened populations. The nested post-test design50,51 is a pragmatic approach that can provide a valid answer to questions about the impact of screening.
Our large sample was fairly representative of the Eastern England population, given that up to 99% of people in this region are registered with general practices. The study population, however, was almost entirely Caucasian, and ADDITION-Cambridge practices are less deprived than the average English practice. This population may have a higher self-rated health status than other English populations, as well as exhibiting a different underlying pattern of health-related behaviors. The screening procedure used in ADDITION-Cambridge differs from procedures recommended in policies of other countries, which may limit generalizability of our findings. Still, the major uncertainties surrounding screening concern not how to screen but whom to invite and whether screening and subsequent treatment result in health gains.52
We did not have ethical or research governance permission to extract information from National Health Service records of individuals diagnosed with diabetes in the no-screening control group or from individuals who were clinically diagnosed with diabetes in the screening group following a negative screening test. The percentages of reported glucose lowering drugs after follow-up, however, were similar in the screening and control groups, suggesting comparable prevalence rates of type 2 diabetes in both groups.
The loss to follow-up due to death or change of practice among high-risk individuals after the screening program may have been a source of bias. Such a possibility is limited, however, because we found no difference between baseline characteristics of patients still registered at their practice and those who had moved away. Further, there were no between-group differences in all-cause mortality over the same follow-up period. Measuring cardiovascular morbidity, self-rated health, and health behavior at baseline was not undertaken because the receipt of a questionnaire might have influenced attendance to screening. Given the apparent success of randomization, however, it is unlikely that differences between groups in outcome measures existed before screening.
Although we used previously validated instruments, there is potential for recall bias in self-reported outcomes. Generic instruments (SF-8 or EQ-5D) may not be sensitive to specific condition-related concerns raised by diabetes screening and may have low content validity in this particular context. There is, however, no screening-specific health status instrument independent of the condition of interest.
This study showed no long-term beneficial effect of screening for type 2 diabetes on self-reported cardiovascular morbidity and health-related behaviors at the population level. Negative screening tests were not associated with adoption of unhealthy behaviors (false reassurance). The results confirm the emerging position that screening for diabetes is not associated with long-term direct or indirect harms. A single round of screening may be associated with benefits among the minority whose previously undiagnosed diabetes is detected, but it appears unlikely to affect health of the population as a whole. Further research is required to evaluate the cost-effectiveness of such endeavors for population health gain.
Acknowledgments
We gratefully acknowledge the contribution of all participants, practice nurses and general practitioners in the ADDITION-Cambridge study39; a full list of participating practices is given below. We also acknowledge the contribution of the trial steering committee —Professors Nigel Stott (Chair), John Weinman, Richard Himsworth, and Paul Little. The Primary Care Unit at the University of Cambridge and the Medical Research Council Epidemiology Unit in Cambridge jointly coordinated the study. Aside from the authors, the ADDITION study team has included Amanda Adler, Rebecca Bale, Sue Boase, Ros Barling, Clare Boothby, Ryan Butler, Sean Dinneen, Pesheya Doubleday, Mark Evans, Tom Fanshawe, Francis Finucane, Julie Grant, Wendy Hardeman, Robert Henderson, Garry King, Richard Parker, Nicola Popplewell, Lincoln Sargeant, Jenny Smith, Stephen Sutton, and Fiona Whittle. We thank the following groups within the MRC Epidemiology Unit: data management (Adam Dickinson), IT (Iain Morrison), technical (Matt Simms) and field epidemiology (Paul Roberts and Kim Mwanza). We thank Stephen Sharp (MRC Epidemiology Unit) for his statistical advice. ADDITION-Cambridge practices: Acorn Community Health Centre, Arbury Road Surgery, Bridge Street Medical Centre, Buckden Surgery, Cedar House Surgery, Clarkson Surgery, Cornerstone Practice, Cornford House Surgery, Cromwell Place Surgery, Dr Smith and Partners, Eaton Socon Health Centre, George Clare Surgery, Great Staughton Surgery, Harston Surgery, Lensfield Medical Practice, Mercheford House, Milton Surgery, Northcote House Surgery, Nuffield Medical Centre, Papworth Surgery, Petersfield Medical Practice, Priors Field Surgery, Queen Edith Medical Practice, Ramsey Surgery, Riverside Practice, Roman Gate Surgery, Rosalind Franklin House, The Burwell Surgery, The Surgery Manea, The Old Exchange, The Surgery Haddenham, Trumpington Street Medical Practice, Upwell Health Centre, York Street Medical Practice.
The National Primary Care Database is a product of the National Primary Care Research and Development Centre at the University of Manchester. It was devised by Professor Deborah Baker. The database was constructed by Justin Hayes at the Regional Research Laboratory, School of Geography, University of Manchester (Director: Dr Robert Barr); SEE IT consultancy designed and built the map interface. We are grateful to Andrew Wagner, Mark Hann and David Reeves (NPCRDC) for cleaning and validating the data sets. Andrew Wagner is the database manager (a.wagner{at}man.ac.uk).
Footnotes
-
Conflicts of interest: authors report none.
-
ISRCTN86769081 (http://www.isrctn.com).
-
Funding support: ADDITION-Cambridge was supported by the Well-come Trust (grant reference no: G061895), the Medical Research Council (grant reference no: G0001164), National Health Service R&D support funding, the National Institute for Health Research (NIHR) and the MRC Epidemiology Unit. We received an unrestricted grant from University of Aarhus, Denmark, to support the ADDITION-Cambridge trial. Bio-Rad provided equipment to undertake capillary glucose screening by HbA1c in general practice. A-L.K. was an NIHR Senior Investigator. The Primary Care Unit was supported by NIHR Research funds. S.J.G. received support from the Department of Health NIHR Program Grant funding scheme [RP-PG-0606-1259]. A.T.P. was supported by the NIHR Biomedical Research Centre based at Guy’s and St Thomas’ NHS Foundation Trust and King’s College London. The views expressed in this publication are those of the authors and not necessarily those of the NHS, the NIHR, or the Department of Health.
-
Prior presentation: Part of the work described in this paper was presented at the Royal College of General Practitioners Annual Meeting in Harrogate, UK in 2010.
Abbreviations
- ADDITION
- Anglo-Danish-Dutch Study of Intensive Treatment in People With Screen Detected Diabetes in Primary Care
- Received for publication April 3, 2014.
- Revision received September 13, 2014.
- Accepted for publication October 10, 2014.
- © 2015 Annals of Family Medicine, Inc.
REFERENCES
In this issue


Jump to section
Related Articles
Cited By...
- Development and validation of a diabetes mellitus and prediabetes risk prediction function for case finding in primary care in Hong Kong: a cross-sectional study and a prospective study protocol paper
- An Interrupted Time Series Analysis to Determine the Effect of an Electronic Health Record-Based Intervention on Appropriate Screening for Type 2 Diabetes in Urban Primary Care Clinics in New York City
- Long term impact of screening for type 2 diabetes mellitus - a commentary on new evidence
- In This Issue: Developing and Amplifying the Effectiveness of the Primary Care Workforce