
Article Figures & Data
Figures
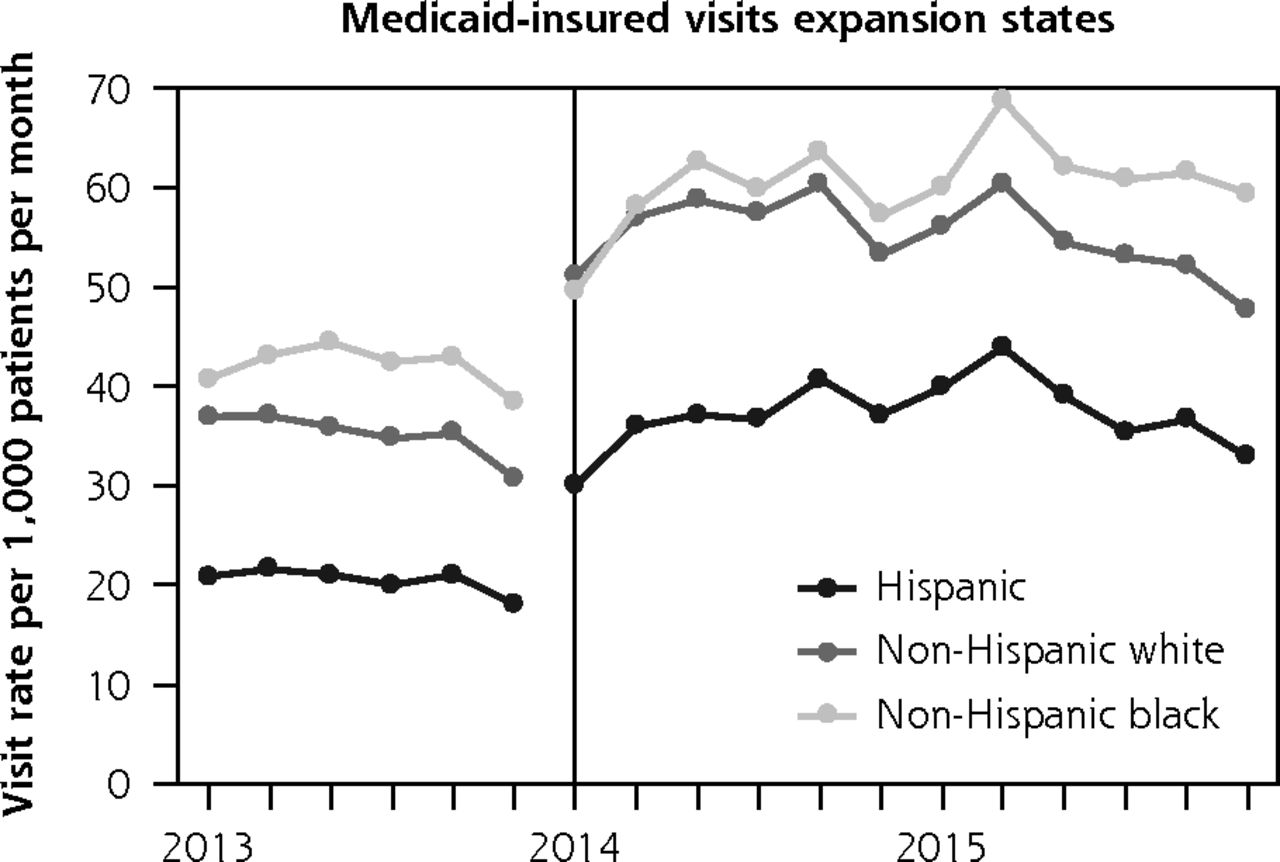
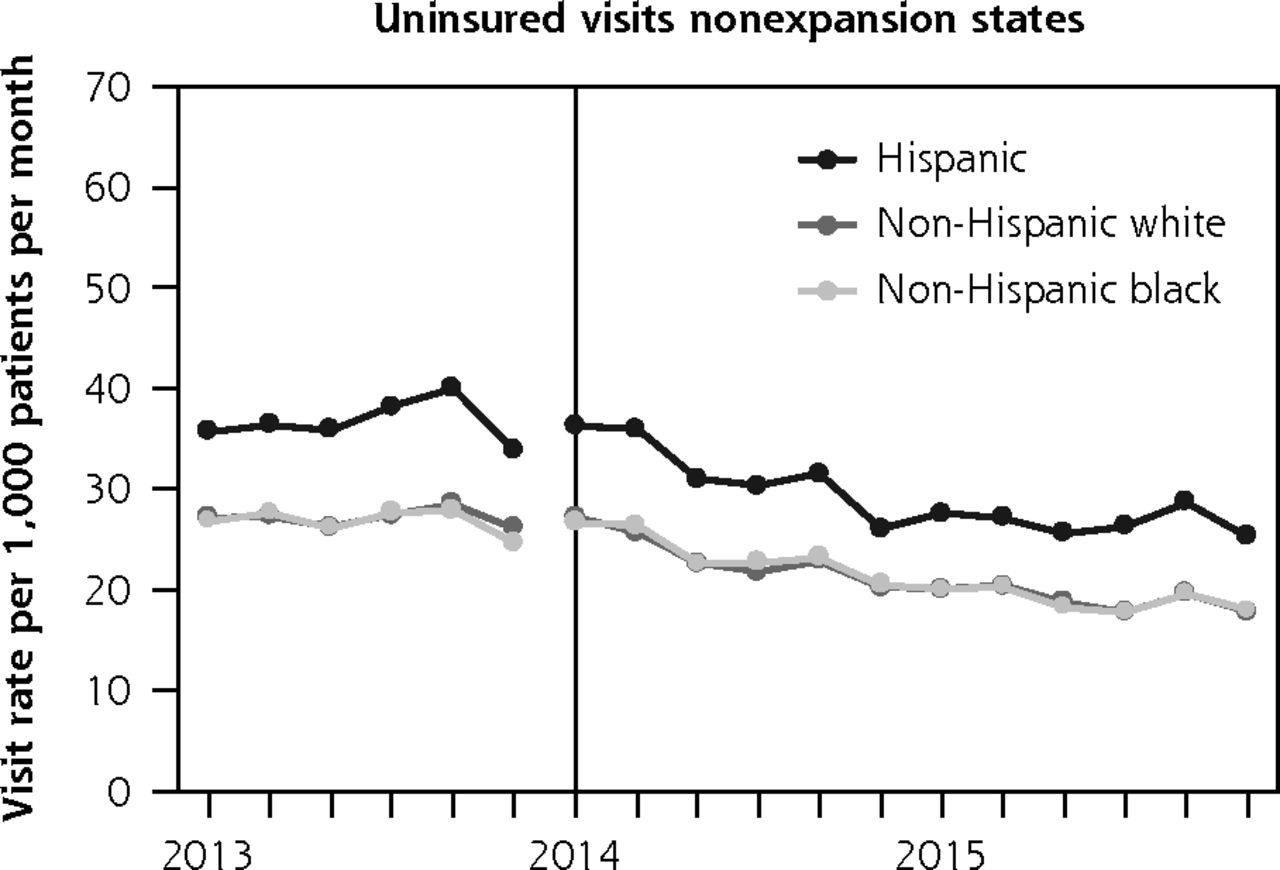
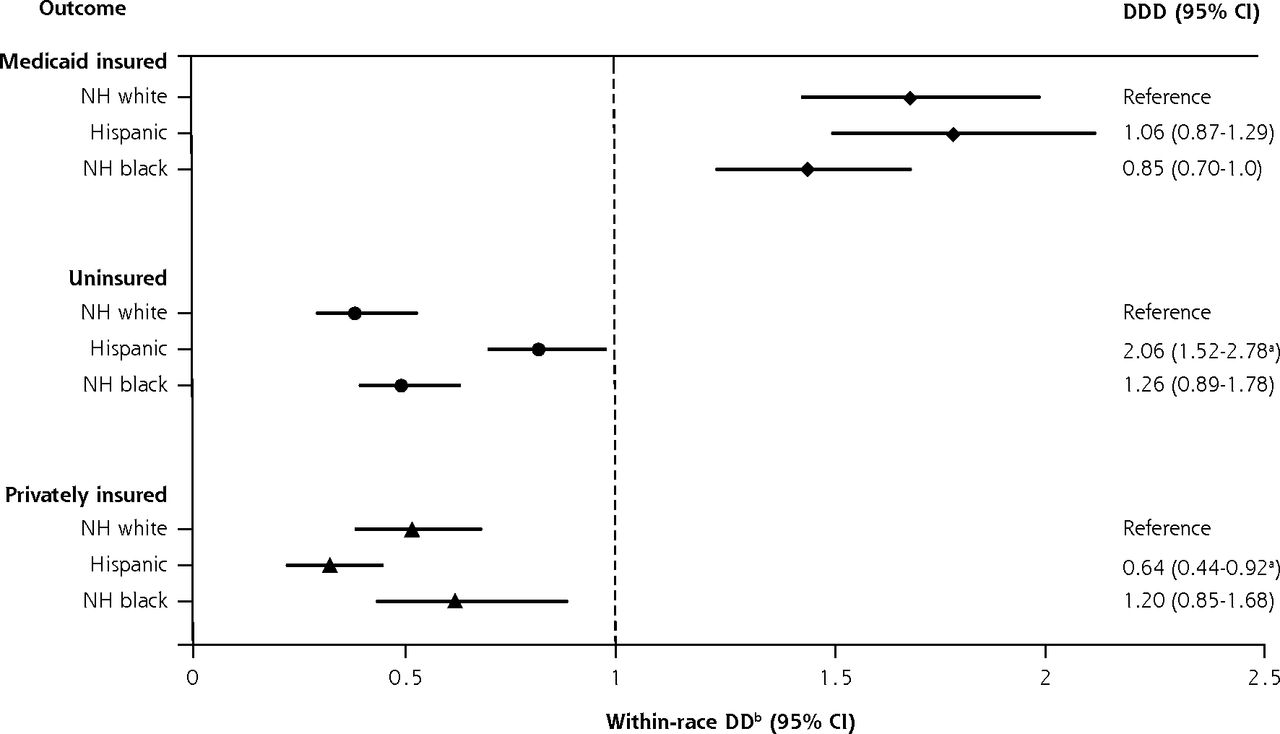
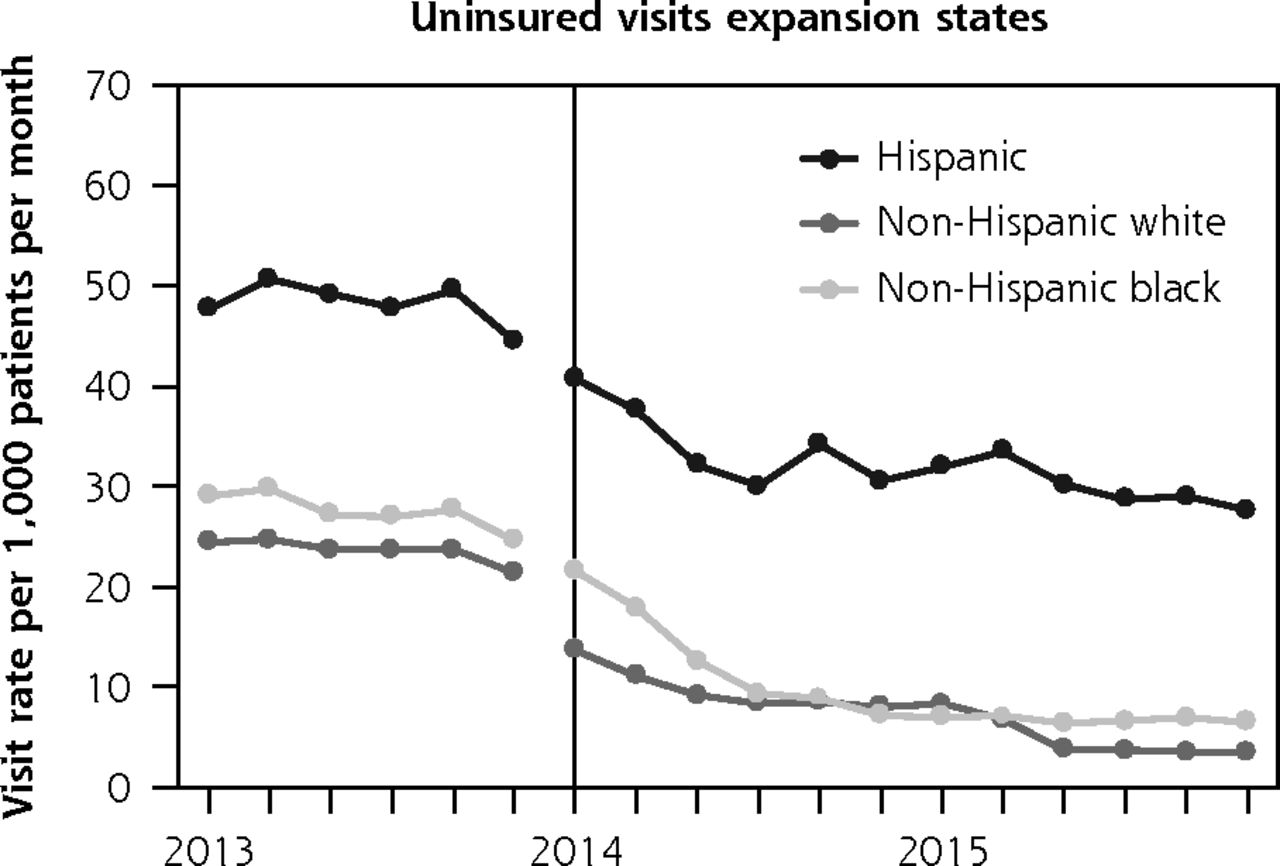
- Figure 1
Rates of payment type for primary care visits by race and and ethnicity.
- Figure 2
Payment visit type after ACA implementation by race and ethnicity.
ACA = Patient Protection and Affordable Care Act; DD = difference-in-difference; DDD = difference-in-difference-in-difference. NH = non-Hispanic.
a Statistically significant DDD estimates, minority vs NH white between expansion status (reference: pre-ACA, NH white, nonexpansion states), P <0.05.
b All DD estimates between expansion status within racial/ethnic group (reference: pre-ACA, nonexpansion states) were significant, P <0.05.


Tables
- Table 1
Demographic Characteristics in 6 Nonexpansion and 10 Expansion States by Racial and Ethnic Group (2013–2015)
Nonexpansion Statesa Expansion Statesb Characteristic NH White Hispanic NH Black NH White Hispanic NH Black Primary care visits per year, No. 2013 157,315 176,816 141,747 430,373 252,809 95,034 2014 153,551 179,038 137,438 460,003 272,464 95,155 2015 140,857 182,242 129,934 434,072 281,938 94,030 Patients, No. (%) 113,119 (30.5) 142,546 (38.5) 92,626 (25.0) 247,546 (49.5) 153,453 (30.7) 54,348 (10.9) Sex, No. (%) Female 68,408 (60.5) 90,759 (63.7) 57,868 (62.5) 137,750 (55.6) 90,291 (58.8) 29,035 (53.4) Male 44,705 (39.5) 51,783 (36.3) 34,756 (37.5) 109,537 (44.2) 63,113 (41.1) 25,274 (46.5) Other/unknown 6 (<0.1) 4 (<0.1) 2 (<0.1) 259 (0.1) 49 (<0.1) 39 (0.1) Age-group as of January 1, 2014, No. (%) 19–26 y 16,884 (14.9) 20,329 (14.3) 16,710 (18.0) 38,727 (15.6) 26,493 (17.3) 9,309 (17.1) 27–39 y 31,881 (28.2) 44,079 (30.9) 26,320 (28.4) 74,722 (30.2) 52,973 (34.5) 15,933 (29.3) 40–64 y 64,354 (56.9) 78,138 (54.8) 49,596 (53.5) 134,097 (54.2) 73,987 (48.2) 29,106 (53.6) Primary language, No. (%) English 112,056 (99.1) 53,878 (37.8) 89,794 (96.9) 239,022 (96.6) 62,034 (40.4) 47,212 (86.9) Spanish 0 (0) 87,959 (61.7) 0 (0) 0 (0) 90,684 (59.1) 0 (0) Other/unknown 1,063 (0.9) 709 (0.5) 2,832 (3.1) 8,524 (3.4) 735 (0.5) 7,136 (13.1) FPL (last recorded), No. (%) ≥138% 80,786 (71.4) 115,994 (81.4) 72,067 (77.8) 144,784 (58.5) 106,914 (69.7) 42,088 (77.4) >138% 15,061 (13.3) 17,061 (12.0) 11,154 (12.0) 43,110 (17.4) 18,045 (11.8) 3,750 (6.9) Unknown 17,272 (15.3) 9,491 (6.7) 9,405 (10.2) 59,652 (24.1) 28,494 (18.6) 8,510 (15.7) CHC=community health center; FPL=federal poverty level; NH=non-Hispanic.
Note: Wisconsin included as an expansion state because, although they did not expand Medicaid to 138% FPL, they opened enrollment to adults with eligibility criteria of 100% FPL and therefore behaved more like an expansion state than a nonexpansion state. Montana included as a nonexpansion state because they did not expand Medicaid until after our study period (expanded January 1, 2016).
↵a Florida, Kansas, Missouri, North Carolina, Montana, and Texas.
↵b California, Hawaii, Maryland, Minnesota, New Mexico, Ohio, Oregon, Rhode Island, Washington, and Wisconsin.
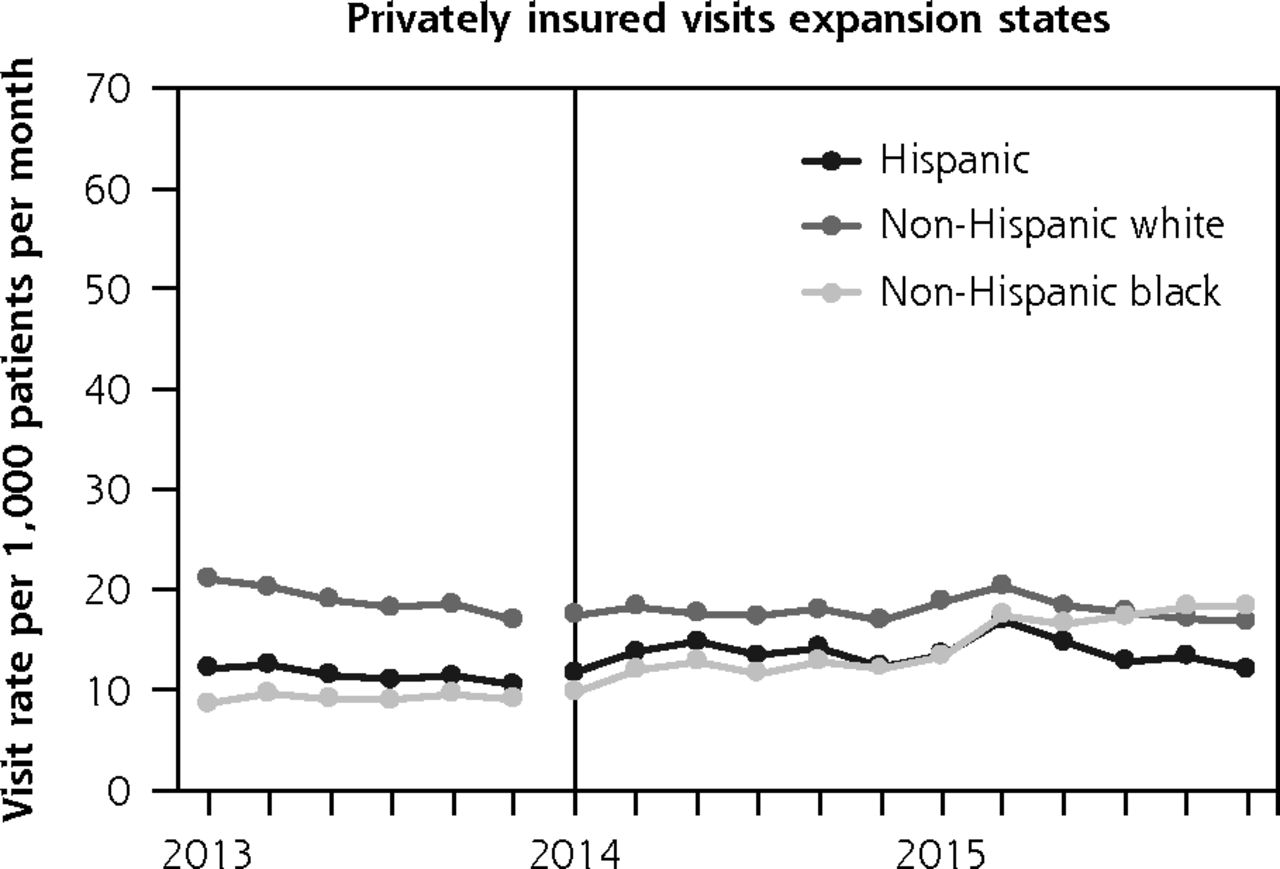
Payment Type Pre-ACA Rate Post-ACA Rate Post- vs Pre-ACA Within-Race RR (95% CI) Post- vs Pre-ACA Between Race DD (95% CI) Medicaid-insured NH white 34.25 54.76 1.60 (1.44–1.78)a 1 [Reference] Hispanic 21.96 38.91 1.77 (1.56–2.02)a 1.11 (0.96–1.28) NH black 42.95 60.26 1.40 (1.23–1.61)a 0.88 (0.75–1.03) Uninsured NH white 23.95 7.73 0.32 (0.25–0.42)a 1 [Reference] Hispanic 46.61 30.54 0.66 (0.58–0.74)a 2.03 (1.53–2.70)b NH black 28.12 11.46 0.41 (0.35–0.48)a 1.26 (0.92–1.73) Privately insured NH white 19.53 18.94 0.97 (0.84–1.12) 1 [Reference] Hispanic 12.33 14.99 1.22 (1.05–1.41)a 1.25 (1.04–1.51)b NH black 10.31 11.70 1.14 (0.91–1.42) 1.17 (0.91–1.51) ACA = Patient Protection and Affordable Care Act; DD = difference-in-difference; NH = non-Hispanic; RR = rate ratio.
Note: Generalized estimating equation models were adjusted for facility-level demographic distributions (sex, age, and federal poverty level) and state-level factors (marketplace type, 2014 minimum wage and unemployment rates, and 2013 uninsured rate), clustered by facility to account for within-facility correlation. Visit rates presented per 1,000 patients per month. DD estimates compare change between racial and ethnic groups (reference = NH white) within expansion states before and after ACA Medicaid expansion.
↵a Statistically significant change post- vs pre-ACA RR, P <.05.
↵b Statistically significant DD estimates (reference: pre-ACA, NH white), P <.05.
- Table 3
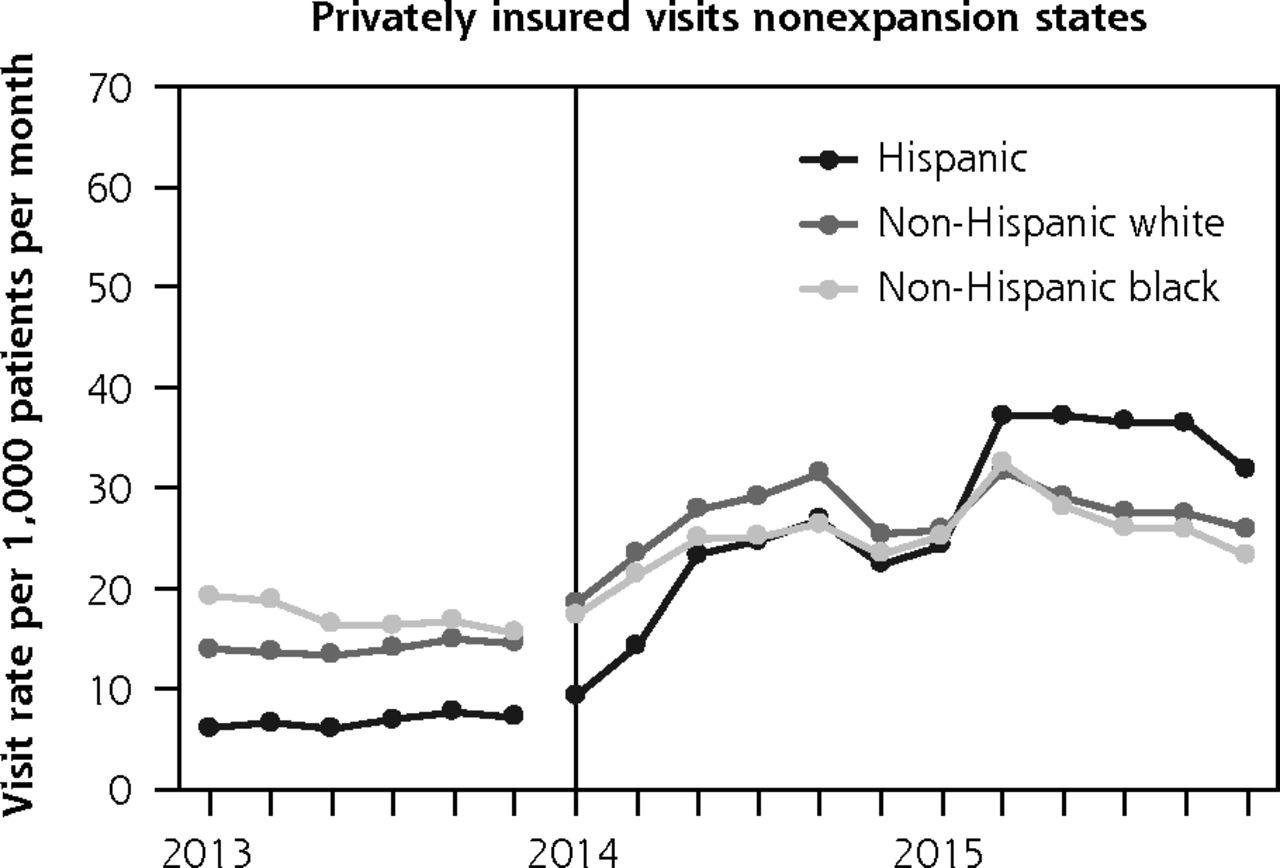
Primary Care Visit Rates by Payment Type and Race and Ethnicity: Nonexpansion States
Payment Type Pre-ACA Rate Post-ACA Rate Post- vs Pre-ACA Within Race RR (95% CI) Post- vs Pre-ACA Between Race DD (95% CI) Medicaid-insured NH white 35.61 33.64 0.95 (0.84–1.07) 1 [Reference] Hispanic 20.19 20.00 0.99 (0.89–1.10) 1.05 (0.92–1.20) NH black 38.70 37.59 0.97 (0.90–1.05) 1.03 (0.91–1.17) Uninsured NH white 31.75 25.36 0.80 (0.73–0.87)a 1 [Reference] Hispanic 43.14 34.05 0.79 (0.71–0.87)a 0.99 (0.89–1.10) NH black 31.57 25.36 0.80 (0.69–0.94)a 1.01 (0.87–1.17) Privately insured NH white 12.70 23.35 1.84 (1.46–2.32)a 1 [Reference] Hispanic 5.52 20.05 3.63 (2.73–4.83)a 1.97 (1.43–2.72)b NH black 11.43 20.57 1.80 (1.40–2.32)a 0.98 (0.78–1.23) ACA = Patient Protection and Affordable Care Act; DD = difference-in-difference; NH = non-Hispanic; RR = rate ratio.
Note: Generalized estimating equation models were adjusted for facility-level demographic distributions (sex, age, and federal poverty level) and state-level factors (marketplace type, 2014 minimum wage and unemployment rates, and 2013 uninsured rate), clustered by facility to account for within-facility correlation. Visit rates presented per 1,000 patients per month. DD estimates compare change between racial and ethnic groups (reference = NH white) within nonexpansion states before and after ACA Medicaid expansion.
↵a Statistically significant change post- vs pre-ACA RR, P <.05.
↵b Statistically significant DD estimates (reference: pre-ACA, NH white), P <.05.
The Article in Brief
Uninsured Primary Care Visit Disparities Under the Affordable Care Act
Heather Holderness , and colleagues
Background Historically, racial and ethnic minorities in the United States have been significantly less likely to have insurance coverage than non-Hispanic whites. The Affordable Care Act was designed, in part, to reduce health disparities. This study aimed to assess changes in insurance coverage at community health center visits by race and ethnicity after Affordable Care Act Medicaid expansion.
What This Study Found Expansion of Medicaid coverage under the Affordable Care Act has contributed to sizeable decreases in medical visits in which people were uninsured. This is true across all racial and ethnic groups, although disparities remain. Using electronic health record data from 10 states that expanded Medicaid and six states that did not, the study examined 359 community health centers and 870,319 patients with more than four million visits. Rates of Medicaid-insured visits increased in expansion states for all racial/ethnic groups immediately following ACA Medicaid expansion, whereas no significant change was observed for Medicaid-insured visits for any racial/ethnic group in non-expansion states. Rates of uninsured visits decreased for all racial/ethnic groups in both expansion and non-expansion states, but the declines were more immediate and pronounced in expansion states. Specifically, rates of Medicaid-insured visits in expansion states increased 60 percent from before the Affordable Care Act to after its implementation among non-Hispanic whites, 77 percent for Hispanics, and 40 percent for non-Hispanic blacks. The most notable changes in non-expansion states were in private insurance visit rates: all racial/ethnic groups increased significantly in the post-implementation period, with Hispanics utilizing community health centers with private coverage at 3.6 times their rate prior to the ACA. This suggests that fewer Hispanic patients were eligible for Medicaid and therefore sought private coverage to comply with the Affordable Care Act's individual mandate. In spite of these improvements, disparities remain. For example, Hispanic patients had the highest uninsured visit rates before Medicaid expansion and, after Medicaid expansion, a significantly smaller decline in rates of uninsured visits than non-Hispanic whites and non-Hispanic blacks. Thus, gaps in Medicaid coverage appear to have continued for Hispanic patients while disparities have been reduced for non-Hispanic blacks.
Implications
- These findings suggest the need for continued and more equitable insurance expansion efforts to eliminate health insurance disparities.
In this issue


Jump to section
Related Articles
Cited By...
- The Affordable Care Act: Effects of Insurance on Diabetes Biomarkers
- Health Care Expenditures Among Adults With Diabetes After Oregons Medicaid Expansion
- Prevalence of Pre-existing Conditions Among Community Health Center Patients Before and After the Affordable Care Act
- The Impact of the Affordable Care Act (ACA) Medicaid Expansion on Visit Rates for Diabetes in Safety Net Health Centers
- In This Issue: Tools to Help Focus on What is Valuable