
Abstract
PURPOSE Primary care is the foundation of any health care system. Primary care improves the health of communities and decreases health inequities. Yet, workforce shortages have worsened in the United States. Understanding characteristics of where workforce gaps are greatest is key to developing effective workforce solutions.
METHODS We used the 2019 Virginia All-Payers Claims Database to identify primary care physicians (PCPs) and the number of distinct patients seen by each physician. These data were used to identify PCP access by census tract measured using an enhanced 2-stage floating catchment method. Guided by the Andersen model of health care utilization, we identified predisposing, enabling, need, and structural community characteristics from public data sources. We assessed associations between PCP access and these characteristics using spatial autoregressive models with lagged independent variables. Analyses were performed from 2023 to 2024.
RESULTS In Virginia, 56.0% of census tracts had adequate PCP access. No association was found between PCP access and predisposing factors. Multiple enabling factors (ie, marital status, education, English language proficiency) were significantly associated with PCP access. Among need measures, PCP access was only positively associated with diagnosis of depression per 1,000 residents (0.01; P <.001). Structural factors had the greatest association with access. Neighborhoods with disproportionately greater numbers of Black residents had significantly greater PCP access compared with neighborhoods with disproportionately greater numbers of White residents (−0.35; P <.05). Rural communities had less PCP access than suburban neighborhoods (−0.53; P <.001).
CONCLUSIONS There is an inadequate primary care workforce in Virginia. Structural factors, rather than predisposing, enabling, or need factors, contribute most to PCP access. Whereas Black segregated communities might have greater PCP access, rural communities are significantly disadvantaged.
INTRODUCTION
Primary care is essential to ensuring health for communities.1 Unfortunately, the United States is experiencing a primary care shortage that is expected to grow by 17,800 to 48,000 physicians by 2034.2 This is a serious public health concern because inadequate access to primary care results in increased numbers of hospitalizations and emergency department visits,3 decreased life expectancies,4 and greater health inequities for communities.5-7
Geographic access to primary care, which considers the potential for patients to use care given the physical supply of clinicians, is critical to health.8 However, primary care physicians (PCPs) are geographically maldistributed, meaning that the number of physicians does not match the demand for an area, leading to disparities.6 For example, a study published in 2021 reported that individuals in counties with a shortage of PCPs had a life expectancy that was 310.9 days shorter than individuals living in counties without a shortage.4 The US Department of Health and Human Services is taking action to strengthen primary care, in part by investing in Federally Qualified Health Centers (FQHCs) and rural clinics.9 To most effectively address inadequate geographic access to primary care, we must first understand what types of communities have limited access and then plan targeted workforce interventions.
Prior work suggests that structural determinants, including economic segregation, racial segregation, and rurality are associated with inequities in PCP access.10-13 Residential segregation, the historical physical separation of races by enforced residence in certain areas, perpetuated disinvestments in community infrastructure including deficits in primary care.14,15 Similarly, residents in rural areas have increased travel distance to health care and decreased utilization of primary care compared with their urban counterparts.12,13 The effects of travel distance are compounded in communities with lower economic resources.14
One challenge to understanding geographic disparities in primary care is accurately measuring the capacity of PCPs to care for a given population. Currently, when making federal designations, a population-to-provider ratio of 3,500:1 is used.16 Although this designation is intended to identify communities with the greatest shortages, it has been used to calculate primary care workforce shortages, which likely underestimates the shortage. This underestimation might contribute to decreasing life expectancy in the United States.1
We aimed to identify geographic disparities of the primary care workforce in Virginia, and based on the Andersen model of health care utilization, identify community-level predisposing, enabling, need, and structural factors associated with PCP access.17,18 Findings could be used to help identify what types of communities should be targeted for workforce interventions.
METHODS
With data from the 2019 Virginia All-Payers Claims Database (APCD), we used an enhanced 2-stage floating catchment method to estimate PCP access by census tract in Virginia.19,20 We then used multivariable analysis at the census tract level to understand the association between PCP access and community characteristics from public data sources. The Virginia Commonwealth University Institutional Review Board determined that this was not human subjects research. All analyses were conducted during the period 2023-2024. We used census tract as the unit of measure for all variables because it is small, local, more accurately represents a community, and is commonly used in the literature to explore geographic access.11,21 In addition, the use of census tracts could avoid underestimating the relation between health outcomes and segregation compared with larger, less local geographic units.22
Study Sample
Historically, primary care has been identified by specialty or services billed. We identified the primary care workforce by both specialty and services billed. We linked the 2019 Virginia APCD with the National Plan and Provider Enumeration System. In line with prior studies, we included the following as PCPs: (1) doctor of medicine/osteopathic medicine (MD/DO) with a family medicine taxonomy code or (2) MD/DO with a taxonomy code for internal medicine, pediatrics, or obstetrics and gynecology with ≥10 wellness visits.23 Clinicians who saw <100 unique patients or >7,500 patients over the course of a year (408/5,258, or 7.8% of the PCPs identified) were excluded, assuming the former had little clinical time whereas the latter indicated that multiple physicians were billing under the same identification number. Nurse practitioners (NPs) and physician assistants/associates (PAs) were not included in the original data set; however, additional analyses including NPs/PAs in the primary care workforce are included in the Supplemental Appendix.
The number of unique patients seen by the PCP and the practice location were determined from the APCD. The APCD contains all Medicare claims, all Medicaid claims, 44% to 47% of commercial claims, and no claims from uninsured individuals (8% of Virginians in 2019).24 To adjust for the missing aspects of the APCD, the capacity of each PCP was the number of unique patients seen by each PCP multiplied by 2.3, a correction formulated by the state stewards of the APCD and based on the KFF total commercial covered lives.24 If a PCP had multiple practice locations, extra practice locations were excluded after a manual internet search, and the capacity of that physician was divided equally across correct locations (65 physicians with multiple locations as determined by manual search). Practice addresses were geolocated using the Census Bureau batch geocoder or the Google application programming interface if not identified with the Census Bureau tool. We used data from the Census Bureau American Community Survey, HealthLandscape Virginia, and the Virginia Open Data Portal.
Measures
The dependent variable was PCP access at the census tract level as calculated using the enhanced 2-stage floating catchment area method, assuming a 30-minute drive time.25,26 We considered PCP access to represent the ratio of total PCP capacity to residents in each census tract. The range of values of PCP access was 0 to 2.7, with values >1 indicating that the total PCP capacity within 30 minutes of the census tract was greater than the number of individuals within the census tract. For binary analysis, census tracts had inadequate PCP access if the PCP access score was <0.8, meaning that PCP capacity covered 80% of the total residents in the census tract.
The independent variables were the community predisposing, enabling, need, and structural characteristics that influence health care use. We used the racialized Index of Concentration at the Extremes (ICERace) to assess racial segregation by subtracting the number of Black households from the number of White households and dividing by the total number of households for each census tract.27 The economic Index of Concentration at the Extremes (ICEIncome) measured economic segregation and was calculated by subtracting the number of low-income households (incomes <20th income percentile) from the number of high-income households (incomes >80th income percentile) and dividing by the total number of households in each census tract.27,28 Both measures can range from −1 to 1. Census tracts with an ICERace value of −1 have 100% Black households and 0% White households. Conversely, census tracts with an ICERace value of 1 have 100% White households and 0% Black households. Detailed information regarding these variables is provided in the Supplemental Table 1.
Statistical Analysis
We examined bivariate associations between PCP access and each independent variable using χ2 tests for categorical variables and Wilcoxon rank sum tests for continuous variables. We then assessed collinearity by examining the correlation matrix between all variables and variance inflation factors (VIF) (from nonspatial linear regression models). We included all variables with VIF values <5 in our final model. For pairs of highly correlated variables with higher VIF values, we kept the variable with a known association with health care utilization. Once covariates were finalized, we examined spatial autocorrelation using the Moran I test. Because the Moran I test was significant (data not shown), we then used spatial autoregressive models with lagged independent variables to assess the relation between the continuous measure of spatial PCP accessibly and the independent variables.29 We report total effects (direct + indirect effects) with bootstrapped 95% CIs using 10,000 simulations.30 For these models, we used a queen contiguity. We conducted sensitivity analysis using the median values from 2016-2019 data as well as alternative model specifications using the 2019 data (Supplemental Tables 2-6). We also conducted a sensitivity analysis including NPs/PAs and FQHCs in the workforce (Supplemental Table 7). Lastly, we provided the following analyses regarding panel size: (1) no panel size adjustment, (2) self-reported panel size in prior work (2,018 patients).31 All analyses were conducted with RStudio version 4.3.1 (Posit PBC).
RESULTS
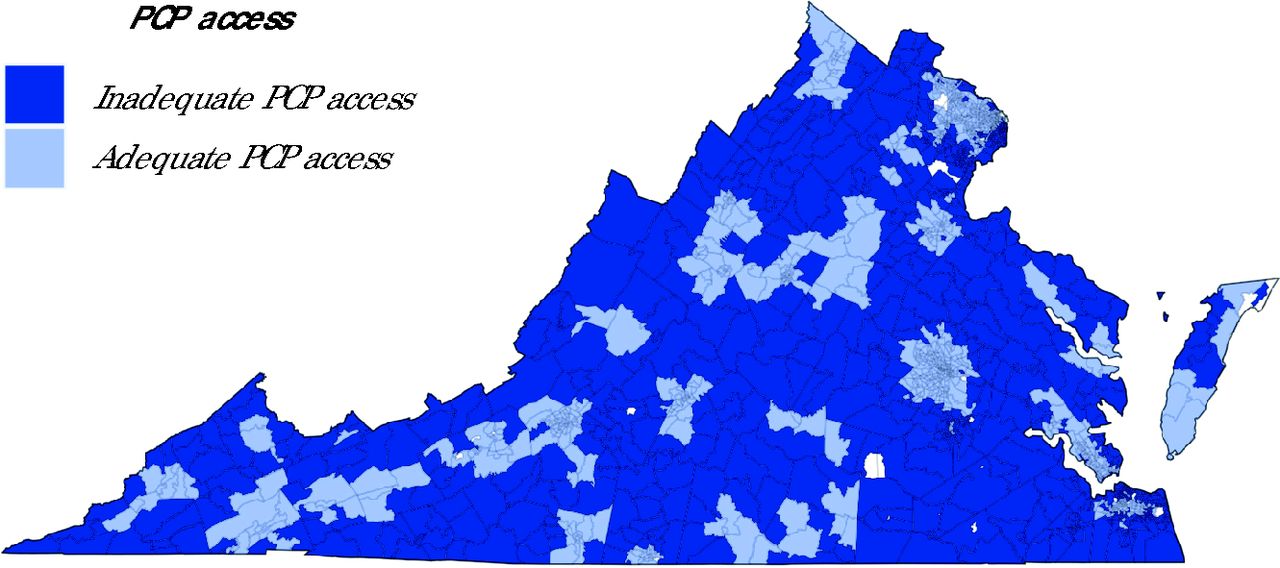
We identified 5,258 total PCPs in 2019, of whom 408 were excluded (having <100 or >7,500 unique patients); 4,850 were included. The median number of unique patients each PCP saw was 1,368 (range, 101-7,327). Of the 1,907 census tracts in Virginia, 1,837 had ≥100 residents and complete population data, meaning that they were included in the final analysis. Of those 1,837 census tracts, 56.0% had adequate PCP access (Figure 1). These census tracts included 4,657,337 of Virginia’s 8,421,509 residents in 2019 (55.3%).

Virginia Census Tracts With Inadequate Primary Care Physician Access
PCP = primary care physician.
Note: Census tracts in light gray denote excluded tracts (due to <100 residents or incomplete data). Using an enhanced 2-stage floating catchment method and data from the 2019 all-payer claims database, 56.0% of Virginia’s census tracts had adequate access to primary care.
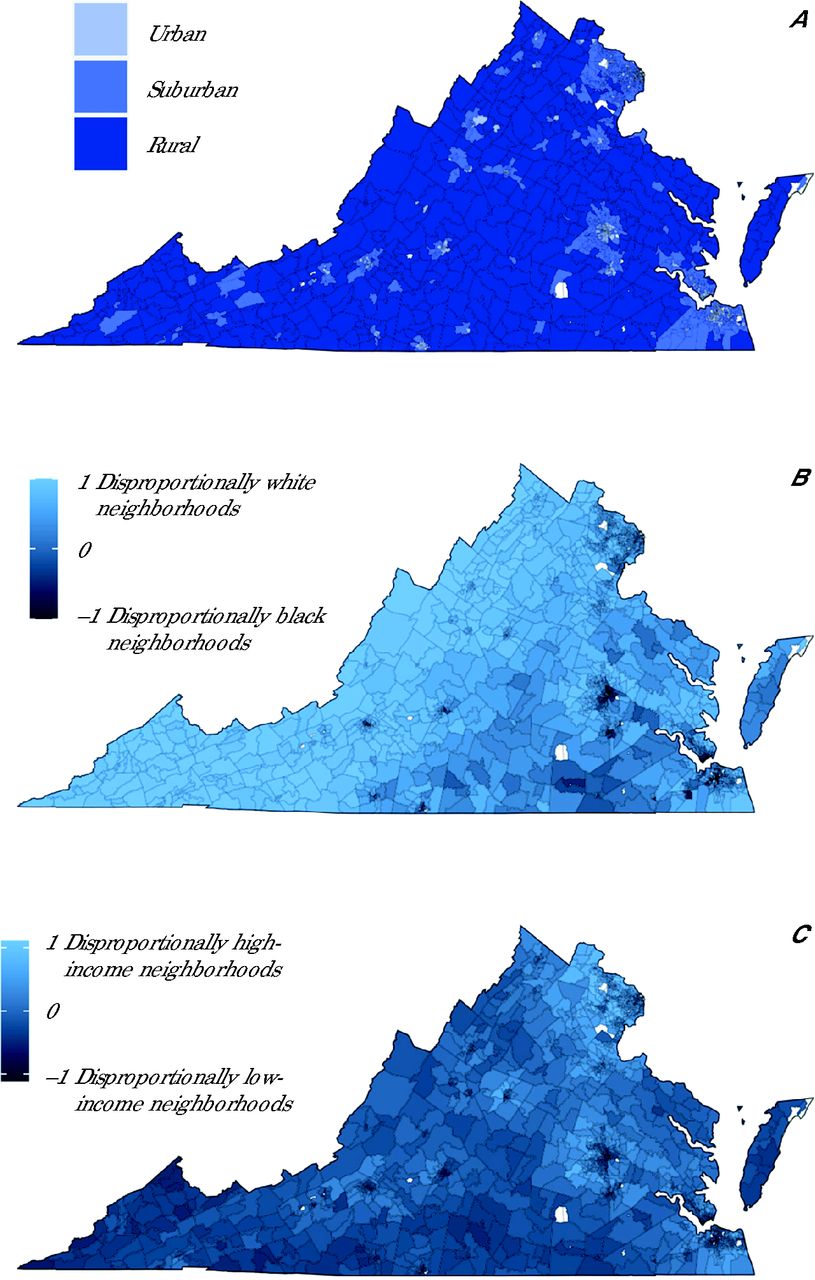
Census tracts with adequate PCP access were broadly located in larger cities as well as scattered throughout the northwestern and southwestern part of the state. Figure 2 shows rurality, racial, and economic segregation in Virginia. The western part of the state consisted of census tracts with ICERace scores closer to 1 (neighborhoods with disproportionately greater numbers of White residents), whereas the eastern part of the state consisted of census tracts with ICERace scores closer to −1 (neighborhoods with disproportionately greater numbers of Black residents). When examining economic segregation, the western and southern part of the state had census tracts with ICEIncome scores closer to −1 (disproportionately low-income neighborhoods).

Rurality, Racial Segregation, and Economic Segregation in Virginia
ICE = Index of Concentration at the Extremes.
Census tracts in light gray denote excluded tracts (due to <100 residents or incomplete data). 2A. Urban, suburban, and rural designations were from the Urbanization Perceptions Small Area Index. 2B. ICERace score ranges from −1 to 1 for census tracts in Virginia, with −1 meaning that 100% of the households are Black (neighborhood with disproportionately greater numbers of Black residents) and 1 meaning that 100% of households are White (neighborhood with disproportionately greater numbers of White residents). 2C. ICEIncome score ranges from −0.89 to 0.89 in Virginia census tracts.
Comparing the characteristics of census tracts with adequate vs inadequate primary care access in bivariate analysis, communities with adequate PCP access had significantly more female residents (P <.001) and residents aged <5 years (P = .001) but significantly fewer residents aged ≥65 years (P <.001) (Table 1). Among the enabling factors, community-level percentage of residents with a high school diploma or less (P <.001), who were married (P <.001), who had public insurance (P <.001), or had a motor vehicle (P <.001) had a significant negative association with PCP access, whereas the percentage of residents with broadband access (P <.001) or with limited English proficiency (P <.001) had a significant positive association with PCP access. Interestingly, the community-level need-based characteristics, including the percentage of residents with a disability (P <.001) or prevalence of individuals with a diagnosis of diabetes (P <.001), had a significant negative association with PCP access.
Bivariate Analysis of Primary Care Access in 2019 and Community Characteristics, by Virginia Census Tract
Table 2 summarizes the results of the full regression models assessing the relation between PCP access and the independent variables. Whereas we presented 4 models, we focused on the model that includes both ICERace and ICEIncome without interaction because we found that the interaction was not significant; however, we recognize the importance of looking at ICERace and ICEIncome simultaneously. Examining structural factors of interest, we found that ICERace was significantly negatively associated with PCP access (−0.35; P <.05). Given a median panel size of 1,368, census tracts with an ICERace score of 0 (neighborhoods with neither disproportionately greater numbers of Black or White residents) had a PCP capacity to care for 479 fewer residents than census tracts with an ICERace score of −1 (neighborhoods with disproportionately greater numbers of Black residents), holding all other variables constant. Conversely, ICEIncome was not significantly associated with PCP access (−0.02; P = .96). In addition, rural communities had significantly less PCP access than suburban areas (−0.53; P <.001), meaning that rural census tracts had PCP capacity to care for approximately 725 fewer residents compared with suburban census tracts. Furthermore, compared with the central Virginia region, both the eastern and northern regions had significantly decreased PCP access (−0.23; P <.01 and −0.37; P <.01, respectively), whereas the northwestern region had significantly greater access (0.19; P <.05).
Multivariable Analysis of PCP Access in 2019 and Community Characteristics, by Virginia Census Tract
Although all predisposing factors were significantly associated with PCP access when testing bivariate associations, there was only a significant relation between percentage of residents ≥65 and access (0.2; P <.05) in our preferred model. Examining enabling factors, we found that the percentage of residents with a high school diploma or less and the percentage of married residents were significantly negatively associated with PCP access (−0.02; P <.001 and −0.02; P <.01, respectively). This means, for example, that a 1% increase in married residents was associated with a PCP capacity of a census tract to care for 27 fewer residents in the census tract. The percentage of residents with limited English proficiency was significantly positively associated with PCP access (0.04; P <.01). For need-based factors, the prevalence of depression per 1,000 residents was positively associated with PCP access (0.01; P <.001), whereas the prevalence of diabetes per 1,000 residents, percentage of residents with disability, and hospital access were not significantly associated with PCP access.
Sensitivity analysis showed broadly similar results in terms of the direction between PCP access and predisposing, enabling, or need factors. However, the relation between ICERace and PCP access adequacy was not significant for some of the alternative models. Importantly, our results were similar when including NPs/PAs and FQHCs in the workforce (Supplemental Table 7) as well as with no panel size adjustment or when using a self-reported panel size cited in the literature (Supplemental Table 8).31
DISCUSSION
We found that that nearly one-half of Virginia’s census tracts had inadequate access to primary care. Structural factors had the greatest association with primary care access, as opposed to community-level need, predisposing, or enabling factors. Specifically, neighborhoods with disproportionately greater numbers of Black residents had significantly more PCP access, whereas rural communities and certain regions had significantly less PCP access.
Demand for primary care, which might drive physicians’ choice regarding practice location, is a complex interaction between predisposing, enabling, need, and structural factors. For example, low educational attainment is associated with increased disease burden, which in turn could increase the demand for care, but also with decreased insurance coverage, which could decrease the demand for care.32,33 We found that few predisposing and enabling factors were associated with PCP access, and when there was an association, it was small. This suggests that primary care access adequacy is less sensitive to these factors. Given nonsignificant associations between most need factors and PCP access, it is unlikely that primary care access adequacy is responsive to the need for care among individuals with conditions managed by primary care.
Structural factors showed the greatest associations with PCP access. The current and historical system of structural racism in the United States includes residential segregation that has historically resulted in neighborhoods with predominantly Black residents having fewer resources, including fewer physicians, than other communities.8,12 Conversely, we found that neighborhoods with a lower ICERace score, or a neighborhood with disproportionately greater numbers of Black residents, had greater access to PCPs in Virginia. National policy levers, such as FQHCs, might have led to more community centers in predominantly Black neighborhoods, suggesting that primary care can use policy levers to improve health equity.34 In addition, loan repayment programs and the National Health Service Corps might have successfully increased geographic access in disproportionately Black neighborhoods.35,36 Furthermore, Black physicians are more likely to practice in disproportionately Black neighborhoods, and the total number of Black physicians has increased, potentially increasing access in these neighborhoods.37,38 Our results were sensitive to model specification; therefore, further research is needed to understand the connection between PCP access and segregation.
We found no relation between economic segregation and PCP access. Disproportionately low-income neighborhoods have greater rates of chronic disease, which could indicate a greater need for primary care but might also be accompanied by community disinvestments.39 In contrast to residential segregation, programs to incentivize clinicians to locate in underserved areas might not have led to a greater number of clinicians in disproportionately low-income neighborhoods.40 In addition, having equal access to clinicians in low-income or high-income neighborhoods might not be sufficient to adequately treat individuals in low-income neighborhoods, given that these individuals might have a greater disease burden and need more care.41 Further defining ideal patient panel sizes and resources needed by PCPs based on community-level disease burden and complexity might be necessary to achieve this goal and ensure comprehensive care for all communities.
Rural communities continue to experience significant inequities in PCP access. This might be because physicians are more likely to practice where they train, and the majority of residencies are located in suburban or urban areas.42 Second, limited pay or feelings of isolation in rural communities might make incentive programs meant to encourage physicians to practice in rural communities ineffective.43 Third, patients in rural communities tend to have a greater disease burden and are older than their urban counterparts, which might dissuade physicians from choosing to practice in these areas and also points to the need for establishing realistic patient panel sizes and resources for primary care practices.44
This study has several limitations. First, the APCD does not include all claims from commercial insurers and does not include uninsured individuals. Importantly, our work is robust to using self-reported panel sizes cited in the literature31 and unadjusted panel sizes (Supplemental Table 8). We did not directly account for NPs, PAs, or FQHCs. However, when using state licensure data to identify primary care NPs/PAs and federal data to identify FQHCs, we found similar associations between community characteristics and primary care workforce regardless of who is included in the workforce (Supplemental Table 7 and Supplemental Figure 1).45 Second, we did not address access to care delivered via virtual modalities; however, prior work found that areas of inadequate access were similar for both virtual and physical measures of access.14 Third, approximately 900 of the MD/DO providers were listed at >1 address, and a manual internet search was used to best approximate a singular location for each physician. Of those, 65 had >1 location after the manual search. However, this might inaccurately locate an individual to 1 practice, whereas in actuality they see patients at multiple locations, underestimating geographic access. Fourth, we only used ICE scores, which do not capture spatial segregation but rather reflect statistical segregation alone. Fifth, the enhanced 2-stage floating catchment area method does not account for other modes of transportation, traffic, or that individuals might travel from work to primary care.46 Sixth, compensation for PCPs might be linked to supply, but those data were not available to include in our models. Seventh, we captured 1 aspect of access but did not address others such as affordability, appropriateness, approachability, or acceptability.
CONCLUSIONS
This study’s methodology included several strengths. First, we used a novel way to identify PCPs by using claims data and taxonomy codes instead of only limiting provider type to specialty. Second, we used the actual capacity of a physician instead of having to estimate the probable number of patients a physician sees and estimate their full-time equivalent hours. Ultimately, our evidence suggests that Virginia has many neighborhoods without adequate PCP access and that structural factors such as racial segregation, rurality, and regions have a greater association with PCP access compared with predisposing, enabling, or need factors. Primary care continues to be a critical element for ensuring community health and health equity in Virginia, and this work illuminates the characteristics most associated with inadequate workforce.
Footnotes
Conflicts of interest: authors report none.
Disclaimer: The research presented in this article is that of the authors and does not reflect the official policy of the National Institutes of Health or the Virginia Department of Medical Assistance Services.
Funding support: Hannah Shadowen was supported by funding from the National Institute for Minority Health and Health Disparities (grant No. F30MD018324). This work was also supported by funding from the Virginia Department of Medical Assistance Services and the Wright Regional Center for Clinical and Translational Science (award No. UM1TR004360).
Previous presentation: Findings from this article were presented at the North American Primary Care Research Group (NAPCRG) 51st Annual Meeting; October 31-November 3, 2023; San Francisco, California.
- Received for publication July 12, 2024.
- Revision received December 17, 2024.
- Accepted for publication February 4, 2025.
- © 2025 Annals of Family Medicine, Inc.
References
In this issue


Jump to section
Related Articles
Cited By...
- No citing articles found.