
Abstract
PURPOSE Hearing loss is a common deficit that remains underdiagnosed. To address this issue, automatic self-hearing tests have been developed. These tools are based on pure-tone detection and speech-in-noise evaluation. The present study evaluated the acceptability and the feasibility of hearing screening for patients consulting in private family practice medicine.
METHODS Data were collected in 3 French medical care centers from May through November 2022. Fast pure-tone (SoTone) and speech-in-noise (SoNoise) tests were available on the SONUP application. Three parameters were measured: (1) duration of the protocol; (2) pertinence of performing both pure-tone and speech-in-noise tests; and (3) number of hearing-impaired patients detected and their follow-up (ie, consultation with an ear, nose, and throat [ENT] specialist, and hearing aid fitting).
RESULTS Of the 516 eligible patients, 219 (42%) were able to perform both tests. Among the screened patients, 161 (74%) had negative test results, while 59 (27%) had positive results indicating hearing loss. Although patients were encouraged to consult an ENT specialist, only 14 did so, and 8 agreed to be fitted with hearing aids. The average duration of the tests, including the explanation (1 minute 43 seconds), was 6 minutes 8 seconds. Interestingly, the SoTone (1 minute 10 seconds), appears to be sufficient for detecting hearing loss.
CONCLUSIONS This study supports integration of app-based hearing screenings into family medical care, as it is compatible with routine consultations. The use of tablet-based applications may assist general practitioners by enhancing the diagnosis of hearing disorders.
INTRODUCTION
The World Health Organization estimates that 1.57 billion people worldwide suffer from hearing loss, with over 400 million requiring hearing rehabilitation with conventional hearing aids.1,2 In France, hearing loss affects approximately 25% of the population (roughly 17 million people), with disabling hearing loss impacting 4.3% (approximately 3 million people).3 Despite this substantial prevalence, only 36.8% of individuals with disabling hearing loss use hearing aids (around 1.2 million people). This underutilization of hearing aids may be attributed to limited patient awareness and a lack of routine hearing screenings, particularly in primary care settings.4,5
The hearing care pathway varies substantially from one country to another. In France, there are no audiologists as there are in North America. The care pathway begins with a general practitioner (GP) visit, then referral to an otorhinolaryngologist (ie, an ear, nose, and throat [ENT] specialist) for a thorough hearing evaluation. If necessary, the ENT specialist prescribes hearing aids. The gold standard for assessing hearing impairment is pure-tone audiometry, which involves determining auditory thresholds at octave frequencies ranging from 0.25 to 8 kHz. Hearing loss is defined by the pure-tone average (PTA) of thresholds at 0.5, 1, 2, and 4 kHz.
Research has demonstrated the effectiveness of hearing screenings in general practice, utilizing diverse approaches (eg, hearing tests, questionnaires), however, incorporating screening presents several hurdles. The necessary equipment—specific, calibrated devices—can be relatively expensive, and use of classic pure-tone audiometry requires specialized training for GPs. Possibly most important for private practitioners, is that the screenings require additional consultation time, which is often a limiting factor.4,6-8
The emergence of smartphone and tablet apps offers a potential solution by providing audiometric self-tests with minimal hardware. Tone-based apps attempt to provide an optimized version of pure-tone audiometry to predict PTA. However, the difficulty of calibrating headphones and the sensitivity to environmental noise limit their accuracy.9 Speech-in-noise-based apps determine the speech reception threshold (signal-to-noise ratio for 50% word recognition) to predict PTA-based hearing loss.10 They are less sensitive to calibration and environmental noise while addressing the hearing difficulties patients often complain about.11-13 Due to the different nature of the test, however, they may not be as efficient as tone-based apps in predicting PTA-based hearing loss.
This study investigates the possibility of hearing screening in the routine practice of private family medicine using 2 self-tests. The first, called SoTone, is a fast pure-tone test designed to detect hearing losses greater than 20 dB hearing level (HL) which is disabling hearing loss as defined by the World Health Organization. The second, called SoNoise, is a speech-in-noise test designed to automatically determine the speech reception threshold (signal-to-noise ratio for 50% word recognition), which is also a good predictor of PTA. Both have been normalized to predict hearing losses according to various PTA.9,10
Our primary objective was to quantitatively assess the acceptability and the feasibility of hearing screening during routine consultations with a GP. The secondary objectives were: (1) to compare the characteristics of the 2 tests used; and (2) to evaluate patient follow-up in hearing care.
METHODS
Informed consent was obtained from all participants, and the study was approved by the local ethics committee (n°UM 2022-003).
Population
A total of 516 patients aged over 10 years, consulting with the GP, Maria El Mouahidine, from May through November 2022 at 3 French medical care centers, were offered a hearing screening. The decision not to specify an age range or limit hearing screenings to annual checkups or special appointments was made to include the largest population possible, and to explore interest in and acceptability of hearing screening in the general population. Furthermore, screening all patients, not only those at highest risk for hearing loss, may improve the overall quality of life for individuals by addressing hearing issues before they substantially impact daily activities and communication.
There were 302 patients seen in downtown Nîmes and 214 in the surrounding villages (147 in Saint-Laurent d’Aigouze, 67 in Saizerais). The exclusion criteria included otologic problems such as cerumen in the external ear canal, malformations incompatible with the use of headphones, and difficulties understanding the test procedure due to language barriers (non-French speakers), age (children aged under 10 years), cognitive deficits (dementia), or self-reported attentional impairment.
Hearing Screening Tests
The hearing screening protocol utilized 2 self-administered tests, a pure-tone test (SoTone) and a speech-in-noise test (SoNoise), installed in 1 app (SONUP, France) on Android OS tablets (Samsung Galaxy Tab A7, Samsung Electronics Co. Ltd.). Calibrated circumaural headphones (Orosound Tilde Pro C, Orosound) were connected to the tablets via Bluetooth to ensure audio quality. The same equipment was used at all 3 locations. The detailed protocols of both tests have been described elsewhere.9,10 Both tests have been tuned to predict a PTA exceeding 30 dB HL that is the defined threshold of disabling hearing loss in France. Briefly, the SoTone test uses only 2 presentation levels (ie, 25 dB HL and 45 dB HL) at 4 frequencies (ie, 0.5, 1, 2, and 4 kHz) for both ears to predict PTA more than 30 dB HL. If 2 or more tones are not perceived at 25 dB HL, hearing loss is predicted with a sensitivity of 96% and a specificity of 84%.9 The SoNoise test has been designed to automatically determine the speech reception threshold. The speech material relies on triplets of words (digit-common noun-color) presented at different signal-to-noise ratios. Speech reception threshold assessment is based on a forced-choice method where the signal-to-noise ratio is adjusted using an adaptive procedure. The SoNoise test predicts a PTA more than 30 dB HL with a sensitivity of 90% and a specificity of 89%.10 The application automatically recorded the duration of each test.
Protocol
For each of the 516 patients, the GP recorded whether the screening was conducted during the consultation and, if not, the reasons. Ultimately, 219 patients completed the hearing screening. After obtaining informed consent, the GP provided a brief explanation of the 2 hearing screening tests used. The GP, working alone as is often the case in France, welcomed the patients, obtained approval, and collected the data. Patients independently conducted the screening with the tablet-based apps in the exam room under GP supervision.
Once the test was complete, the GP communicated the results to the patient. If one of the tests was positive, the GP encouraged the patient to consult an ENT specialist, who would confirm the diagnosis and propose appropriate treatment. The acceptance or refusal to consult an ENT specialist was systematically documented. Whether the patient consulted an ENT specialist and proceeded to hearing rehabilitation was determined by telephone 1 to 3 months later.
Data Storage and Analysis
The data collected from patients with normal hearing, those who refused the ENT doctor’s proposal, and those who did not finish the tests were directly stored in a computer in anonymized form. Data from patients screened and detected as normal or hearing-impaired were pseudo-anonymized. The pseudo-anonymized data were stored during the study and then anonymized later. Data that identified individuals (ie, surnames, first names, telephone numbers, or e-mail addresses) were deleted. Statistical analyses and figure creation was done using Matlab (MathWorks).
RESULTS
Acceptability of Hearing Screening
All patients consulting in the practice were considered eligible for hearing screening using tablet apps. Of the 516 patients who consulted the GP, 297 (58%) did not undergo testing for various reasons (Table 1). The first group was unable to complete the tests (26%) for personal reasons which included categorical refusal, a language barrier, or behavioral difficulties such as agitation or conflicts, all of which definitively compromised screening. The second group (55%) did not complete all the tests due to time constraints, either because of the GP’s or the patient’s busy schedule. The third group (10%) faced difficulties related to receiving a tough diagnosis, being in a noisy environment, and having otalgia or COVID-19. Finally, the GP did not propose screening to patients who had already received an audiogram in ENT care within the past 3 months due to otologic concerns (10%).
Reasons for Patients Not Undergoing Screening Tests (N = 297)
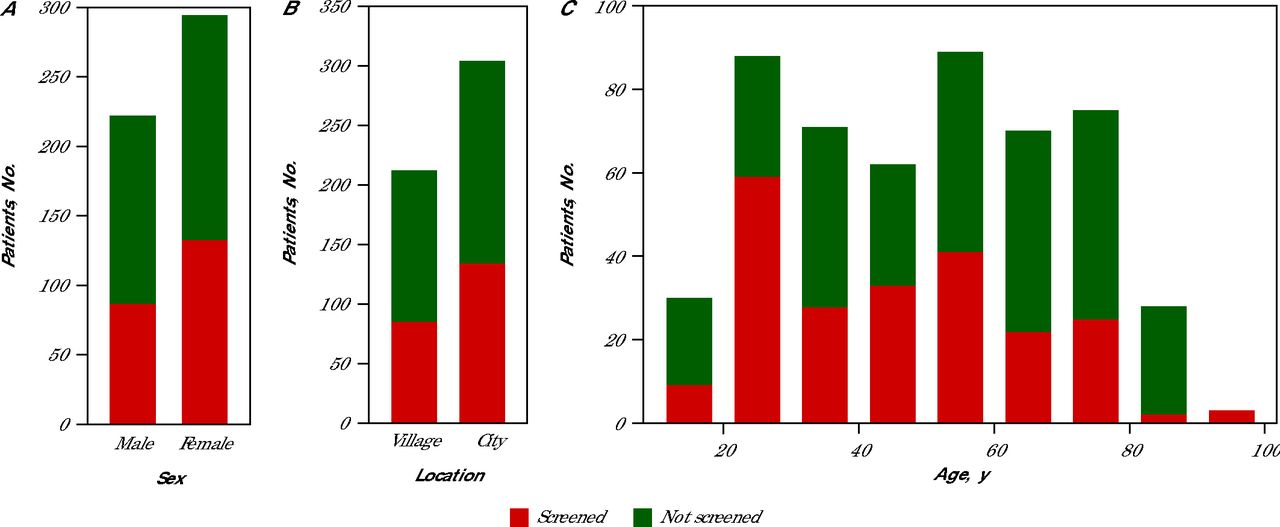
Consequently, only 219 patients (42%) performed the screening, with 60% being female and 40% male (Figure 1A). In terms of location, 41% of the screenings were conducted in village practices, while 59% took place in city practices (Figure 1B). There is an association between age and undergoing hearing screening tests (Figure 1C). Overall, younger participants (aged under 50 years) were more inclined to participate, as 61% performed the tests. Conversely, patients aged over 50 years (39%) were less likely to take the tests, with only 2 individuals exceeding 80 years willing to test. It’s worth noting that 55% of people consulting in the villages are aged over 50 years, compared with 41% in town.

Population Characteristics (N = 516)
Population distribution by sex (A), type of location (B), and age grouped into 10 year blocks (C) are shown. Of the 516 patients with consultations, 219 performed the hearing screening tests.
Feasibility of the Hearing Screening
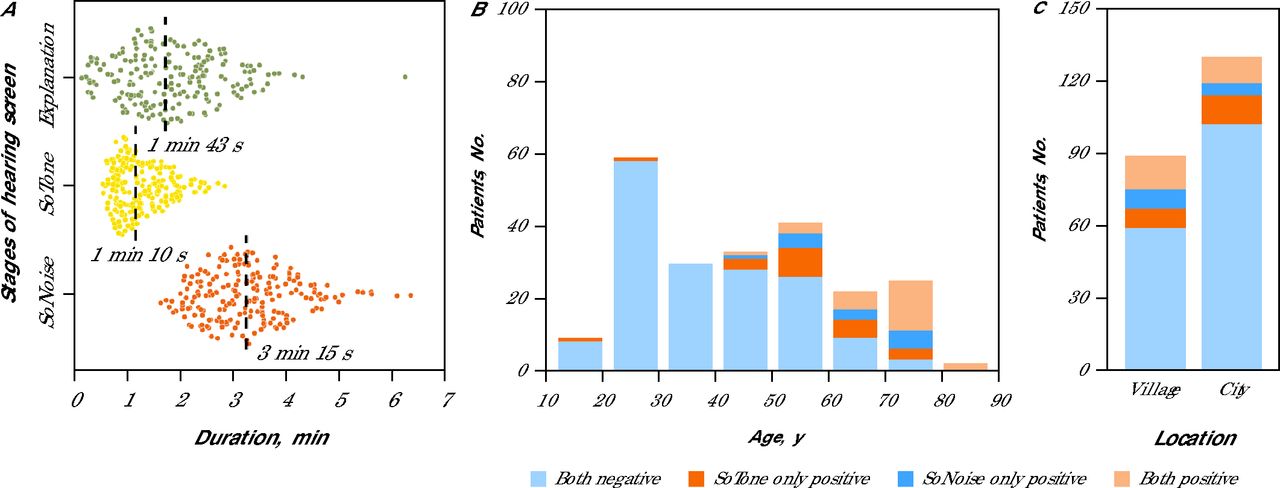
The feasibility of the hearing screening relies on the time required to complete the tests, including the GP’s explanation and performance of both hearing tests. The average time for the entire protocol was 6 minutes 8 seconds, with a standard deviation of 95 seconds (Figure 2A). The average time for each component was: explanation 1 minute 43 seconds (SD 64 seconds); SoTone (pure tone) 1 minute 10 seconds (SD 33 seconds); and (3) SoNoise (speech-in-noise) 3 minutes 15 seconds (SD 60 seconds).

Duration and Results of Audiometry Screening By Age Group and Location (N = 219)
Duration of stages of the screening tests (A) are shown with each dot representing a patient and the median duration of each stage provided. Screening test results as a function of age groups of 10 years (B) and location type (C) are further broken down to normal (negative) or hearing loss detected (positive) by which tests.
Another criterion was the need to propose only 1 or 2 tests. Among the 219 screened patients, 59 (27%) had a positive score (indicating hearing loss) with at least 1 test. The proportion of positive results on 1 or both tests increased from 12% to 100% for the those aged 40 to 90 years (46%), while younger patients had much lower positive rates at 2% (Figure 2B). SoTone and SoNoise both show an increase in positive results from 25% to 100% from the ages of 40 to 90 years. The SoTone test had more positive results for the ages of 40 to 70 years, while the SoNoise test shows slightly more positive results for the ages of 70 to 80 years.
Results varied with the location of the medical office (Figure 2C), more positive results were found in villages (34%) than in the city (21%), which is consistent with an older population in villages. SoTone and SoNoise positivity rates were equal in villages (25% each) but differed substantially in the city with 17% positive with SoTone and 12% with SoNoise. Together, these findings suggest that both fast pure-tone audiometry and speech-in-noise tests effectively detect hearing loss in older populations. Compared with SoNoise, however, SoTone appears to be more sensitive in younger patients and more affected by noisy environments in the city.
Follow-up and Outcome
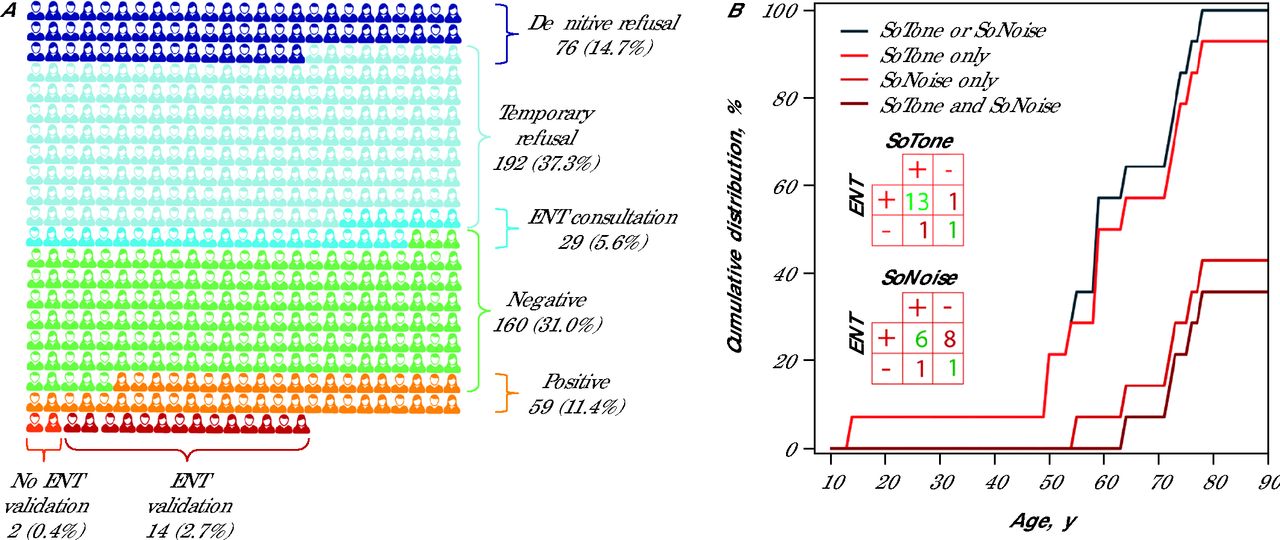
Among the 219 patients (42%) who performed both tests, 160 (31%) had negative test results, and 59 (11%) had positive results on at least 1 test (Figure 3A). The ENT doctor confirmed hearing loss using conventional pure-tone audiometry in 14 patients, and 8 of those received hearing aid prescriptions. Figure 3B shows the cumulative distribution of ENT-confirmed patients as a function of age regarding various combinations of the screening tests used. The confusion matrix (Figure 3B insert) shows better accuracy (good prediction, total number of predictions) of the SoTone test (88%)compared with the SoNoise test (50%) at predicting the ENT diagnoses (Table 2). This suggests that SoTone alone might be a good initial screening tool considering its simplicity and efficiency.

Patient Flowchart and Hearing Screening Outcomes (N = 516)
ENT = ear, nose, and throat; PTA = pure-tone average.
The patient flowchart (A) illustrates the progression of patients from the initial inclusion criteria (total population) to the final stage of confirmed hearing impairment by the ENT doctor. The number and the percentage (according to the whole population) of patients at each stage is indicated. Cumulative ENT-confirmed hearing loss as the function of age in 10 year blocks (B). Note that SoTone alone predict almost all confirmed PTA-based hearing loss. The small inserted tables are the confusion matrix for SoTone and SoNoise, presenting the number of true positives, true negatives, false positives, and false negatives when predicting ENT diagnostics.
Performance of SoTone and SoNoise to Independently Predict ENT Diagnostic Results
DISCUSSION
This study provides the first quantified data supporting the acceptability and the feasibility of using audiometric self-tests in family medical care. Results showed that a fast pure-tone audiometry test might be a good screening tool to predict PTA-based hearing loss.
In 2024, Smith et al14 reported a 25% refusal rate in a primary care setting with stricter criteria and longer consultation times for participants aged 65-75 years.The hearing screening was proposed to occur during annual check-ups, not consultations motivated by pathology. Similarly, Zazove et al15 observed a refusal rate of 22% in primary care. In our study, the rate of unscreened patients was much higher with 297 (58%) of the eligible patient population not being screened. Approximately one-quarter of the patients were unable to complete the tests for personal reasons that definitively compromised screening (Table 1). More than one-half of the patients were not screened due to the GP’s or the patient’s time constraints, making them potential candidates for screening at future consultations. Finally, different workflows in GP practices (eg, assistants in the exam room) may explain some of these discrepancies.
More females (60%) agreed to to have hearing screening than males. This distribution is in accordance with a recent study by Smith et al14 that provided encouragement and hearing screening facilities in a primary care clinic. That population consisted of participants aged 65 to 75 years, of which 64% were female. A higher representation (64% or more) of females in family practice hearing screening has been found in other studies.16-18 According to those studies, the higher proportion of women can be explained by their more frequent use of health care and a greater inclination to participate in medical research studies. Therefore, policy makers and health care professionals might consider developing programs that specifically address the barriers men face in accessing health care and participating in screenings.
For most patients, the explanation and completion of the 2 tests took less than 6 minutes. During the self-administered tests, the physician was able to write consultation notes, prescriptions, and perform administrative tasks. This suggests that app-based hearing screening can be effectively integrated into routine primary care consultations without significantly impacting appointment duration and patient flow, even for a practitioner consulting alone. In clinics where nurses or clinical assistants are available, the testing can be done outside of the exam room, thereby avoiding any consumption of practitioner time. This is a key advantage for busy health care settings.
Sangster et al18 reported a lower positive rate (22%) for combined screening tests using a questionnaire (HHIE-S) and a pure-tone based screening test (Welch-Allyn Audioscope) in participants aged over 65 years,compared with this study’s results for the same age group at 86%. An Austrian program identified hearing loss in 28% of participants aged over 70 years using a combination of a questionnaire (HHIE-S) and a whisper test.17 The higher positivity rate observed herein may be due to the higher sensitivity of SoTone (25 dB HL vs 40 dB HL in the Sangester study) or questionnaire.
Among the 219 patients (42%) who accepted the hearing tests, 59 tested positive on at least 1 of the tests. Nevertheless, only 16 of them followed through with an ENT consultation. The ENT doctor confirmed hearing loss in 14 of these patients, and 8 received a prescription for hearing aids. Compared with our study, Sangster et al18 reported a much higher rate (74%) of hearing-impaired participants completing audiologic assessments after initial screening. Similarly, Zazove et al15 reported that 80% of referred patients received diagnoses of hearing loss. In this study, we did not specifically investigate the reasons behind the low follow-up rates, but the short time frame (3 months) to get an appointment may have been a factor. Further investigations, such as patient surveys or interviews, must be conducted to understand reasons for not seeking ENT consultations. Additionally, 29 patients were not tested because they had already consulted an ENT. The 16 screened patients who visited the ENT following the GP’s recommendation, represent a 55% increase in ENT consultations resulting from screening in family practice.
CONCLUSIONS
This study advocates for incorporation of app-based hearing screenings into family medical care and highlights their compatibility with routine consultations. Use of tablet-based applications may help a substantial number of general practitioners improve the diagnosis of hearing disorders. Additionally, improving organizational workflows (eg, by incorporating the help of assistants) could increase acceptability and feasibility of the screening, and provide more patients with the benefit of hearing rehabilitation.
Footnotes
Annals Early Access article
Conflicts of interest: A.G. benefits from a collaborative grant (CIFRE n°2020/1163) between the French government and SONUP company. The other authors report none.
Funding support: This work was funded by Institut National de la Santé et de la Recherche Médicale (Grant U1298-Dot 02 to 2024) and the University of Montpellier (Grant Audiocampus-EP15A900X).
- Received for publication July 22, 2024.
- Revision received January 11, 2025.
- Accepted for publication February 4, 2025.
- © 2025 Annals of Family Medicine, Inc.


