
Article Figures & Data
Figures
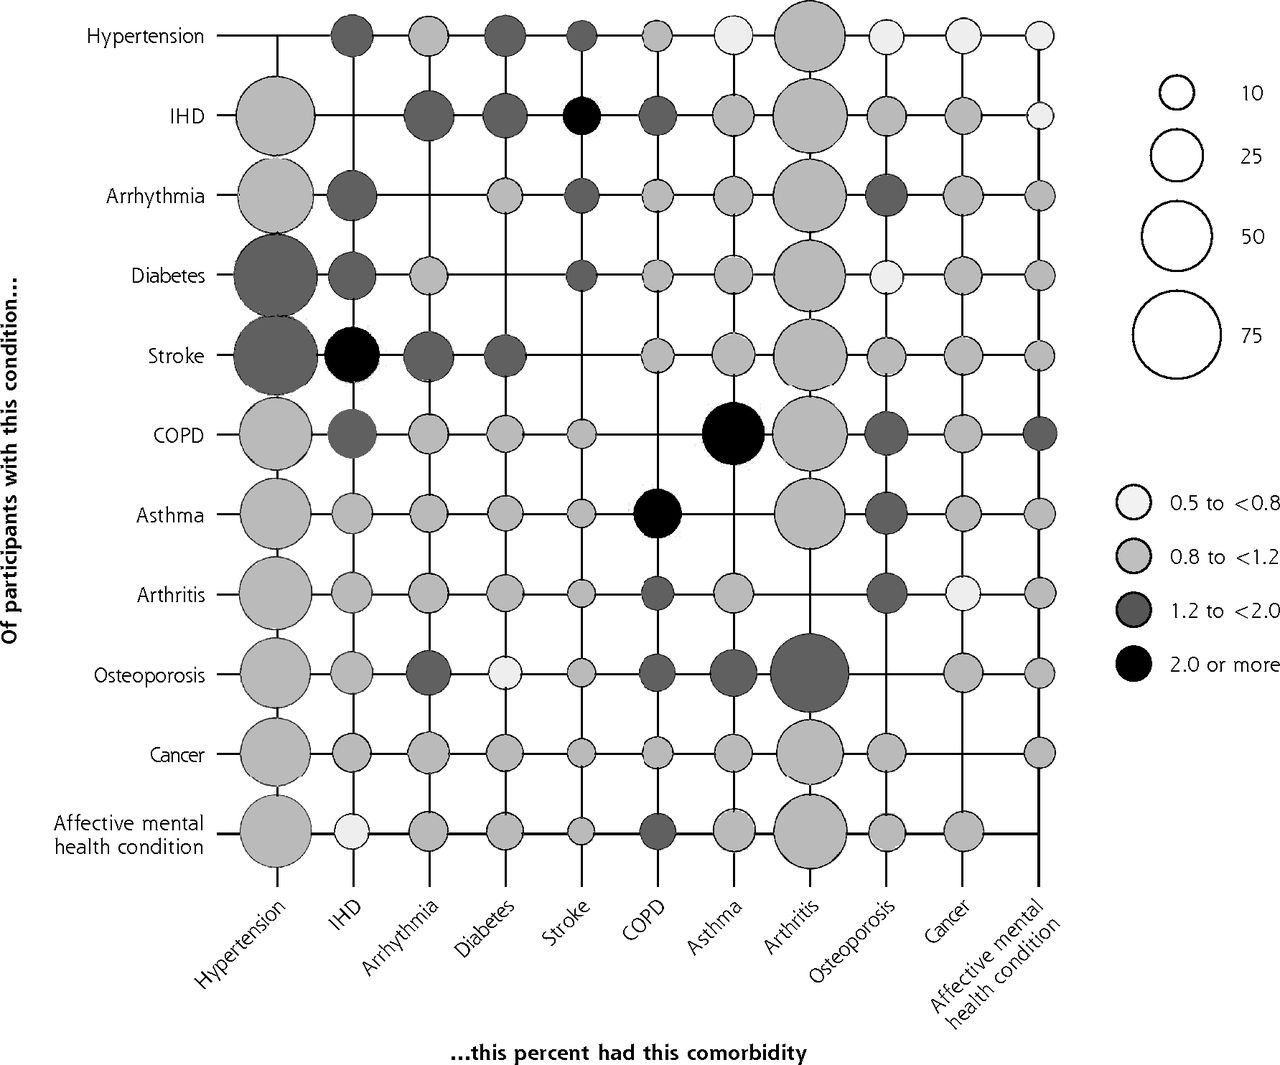
- Figure 1
Prevalence of comorbidities on the x-axis for participants who have the condition on the y-axis, with associated relative risks (data from 2012-2013).
COPD = chronic obstructive pulmonary disease; IHD = ischemic heart disease.
Note: Conditions with a prevalence <5% were excluded (see Table 2). Relative risks are for having the comorbidity on the x-axis given the individual has the condition on the y-axis.

Tables
- Table 1
Participants’ Characteristics at Baseline (2002-2003) and Outcomes at End of Study (2012-2013)
Characteristic Total Sample No Condition at Baseline 1 Condition at Baseline ≥2 Conditions (Multimorbidity) at Baseline All eligible, No. (%) 4,564 (100.0) 1,477 (32.4) 1,534 (33.6) 1,553 (34.0) Multimorbidity by 2012-2013, No. (%) 2,897 (63.5) 377 (25.5) 1,001 (65.3) NA ≥1 Additional condition by 2012-2013, No. (%) 2,845 (62.3) 901 (61.0) 1,001 (65.3) 943 (60.7) Age-group, No. (%) 50-54 y 1011 (22.2) 462 (31.3) 347 (22.6) 202 (13.0) 55-59 y 1093 (24) 392 (26.5) 372 (24.3) 329 (21.2) 60-64 y 792 (17.4) 245 (16.6) 272 (17.7) 275 (17.7) 65-69 y 762 (16.7) 182 (12.3) 266 (17.3) 314 (20.2) 70-74 y 518 (11.4) 130 (8.8) 158 (10.3) 230 (14.8) 75-79 y 267 (5.9) 48 (3.3) 86 (5.6) 133 (8.6) 80-84 y 103 (2.3) 15 (1.0) 27 (1.8) 61 (3.9) ≥85 y 18 (0.4) 3 (0.2) 6 (0.4) 9 (0.6) Female, No. (%) 2,570 (56.3) 737 (49.9) 856 (55.8) 977 (62.9) Total wealth, median (IQR), £ 166,899.7 (82,689-303,170.1) 190,500 (105,039.6-337,505) 181,000 (893,45.5-315,573.5) 134,742.6 (57,158.52-254,200) Wealth quintile, No. (%) 1 Wealthiest 896 (19.6) 354 (24.0) 329 (21.5) 213 (13.7) 2 896 (19.6) 290 (19.6) 325 (21.2) 281 (18.1) 3 896 (19.6) 333 (22.6) 284 (18.5) 279 (18.0) 4 898 (19.7) 258 (17.5) 298 (19.4) 342 (22.0) 5 Least wealthy 897 (19.7) 214 (14.5) 268 (17.5) 415 (26.7) Missing 81 (1.8) 28 (1.9) 30 (2.0) 23 (1.5) Educational attainment, No. (%)a Undergraduate degree or higher 1,342 (29.4) 508 (34.4) 451 (29.4) 383 (24.7) Intermediate 1,801 (39.5) 601 (40.7) 616 (40.2) 584 (37.6) No qualifications 1,421 (31.1) 368 (24.9) 467 (30.4) 586 (37.7) Lives alone, No. (%) 2,823 (61.9) 921 (62.4) 930 (60.3) 972 (62.6) BMI category, No. (%) Underweight 25 (0.6) 10 (0.7) 9 (0.6) 6 (0.4) Normal weight 1,086 (23.8) 428 (29.0) 371 (24.2) 287 (18.5) Overweight 1,835 (40.2) 626 (42.4) 623 (40.6) 586 (37.7) Obese 1,187 (26.0) 293 (19.8) 389 (25.4) 505 (32.5) Missing 431 (9.4) 120 (8.1) 142 (9.3) 169 (10.9) Smoking behavior, No. (%) Never smoked 1,772 (38.8) 604 (40.9) 613 (40.0) 555 (35.7) Smoked in past 2,101 (46.0) 642 (43.5) 696 (45.4) 763 (49.1) Current smoker 691 (15.1) 231 (15.6) 225 (14.7) 235 (15.1) Physical activity, No. (%)b Sedentary 162 (3.6) 31 (2.1) 44 (2.9) 87 (5.6) Low 877 (19.2) 201 (13.6) 267 (17.4) 409 (26.3) Medium 2456 (53.8) 810 (54.8) 849 (55.4) 797 (51.3) High 1067 (23.4) 434 (29.4) 374 (24.4) 259 (16.7) Missing 2 (0.0) 1 (0.1) 0 (0.0) 1 (0.1) Social detachment, No. (%)c 414 (9.1) 113 (7.7) 126 (8.2) 175 (11.3) Missing 395 (8.7) 123 (8.3) 128 (8.3) 144 (9.3) External locus of control, No. (%)d 2979 (65.3) 906 (61.3) 1000 (65.2) 1073 (69.1) Missing 268 (5.9) 78 (5.3) 82 (5.4) 108 (7.0) BMI = body mass index; IQR = interquartile range; NA = not applicable.
Note: Characteristics were assessed in 2002-2003, except for BMI, which was assessed in the 2004-2005 nurse visit. Covariates with no row for missing data had no missing data.
↵a Educational attainment was categorized into higher education/degree, intermediate (secondary education/high school), or no qualifications.
↵b Physical activity was assessed using methodology from the Allied Dunbar fitness survey.
↵c Participants were considered “socially detached” if they were detached from at least 3 out of 4 assessed domains; civic participation, leisure activities, cultural engagement, and social networks (Supplemental Appendix, available at http://www.AnnFamMed.org/content/16/4/322/suppl/DC1/).
↵d External locus of control means believing that life events are outside of one’s control.
- Table 2
Prevalence of Multimorbidity and Individual Conditions From 2002-2003 to 2012-2013 in the Full Sample (N = 4,564)
Condition 2002-2003 2004-2005 2006-2007 2008-2009 2010-2011 2012-2013 Multimorbidity, No. (%) 1,553 (34.0) 1,885 (41.3) 2,166 (47.5) 2,445 (53.6) 2,695 (59.1) 2,897 (63.5) Mean (SD), No. 1.21 (1.16) 1.42 (1.26) 1.62 (1.35) 1.81 (1.41) 2.01 (1.49) 2.17 (1.53) Hypertension, No. (%) 1,564 (34.3) 1,844 (40.4) 2,067 (45.3) 2,230 (48.9) 2,377 (52.1) 2,472 (54.2) Ischemic heart disease, No. (%) 391 (8.6) 454 (10.0) 512 (11.2) 571 (12.5) 627 (13.7) 670 (14.7) Congestive heart failure, No. (%) 16 (0.4) 18 (0.4) 22 (0.5) 23 (0.5) 33 (0.7) 44 (1.0) Arrhythmia, No. (%) 250 (5.5) 350 (7.7) 420 (9.2) 495 (10.9) 581 (12.7) 663 (14.5) Diabetes, No. (%) 241 (5.3) 295 (6.5) 379 (8.3) 456 (10.0) 530 (11.6) 582 (12.8) Stroke, No. (%) 112 (2.5) 149 (3.3) 174 (3.8) 216 (4.7) 258 (5.7) 304 (6.7) COPD, No. (%) 209 (4.6) 257 (5.6) 289 (6.3) 328 (7.2) 381 (8.4) 427 (9.4) Asthma, No. (%) 534 (11.7) 591 (13.0) 621 (13.6) 656 (14.4) 689 (15.1) 707 (15.5) Arthritis, No. (%) 1,364 (29.9) 1,631 (35.7) 1,848 (40.5) 2,023 (44.3) 2,179 (47.7) 2,324 (50.9) Osteoporosis, No. (%) 196 (4.3) 277 (6.1) 346 (7.6) 419 (9.2) 509 (11.2) 582 (12.8) Cancer, No. (%) 231 (5.1) 305 (6.7) 361 (7.9) 415 (9.1) 527 (11.7) 604 (13.2) Parkinson’s disease, No. (%) 5 (0.1) 12 (0.3) 20 (0.4) 24 (0.5) 31 (0.7) 39 (0.9) Affective MHC,a No. (%) 362 (7.9) 270 (5.9) 304 (6.7) 334 (7.3) 364 (8.0) 381 (8.4) Psychotic MHC, No. (%) 24 (0.5) 26 (0.6) 33 (0.7) 37 (0.8) 45 (1.0) 53 (1.2) Dementia, No. (%) 12 (0.3) 15 (0.3) 19 (0.4) 28 (0.6) 41 (0.9) 62 (1.4) COPD = chronic obstructive pulmonary disease; MHC = mental health condition.
↵a We ascertained at each wave whether participants still had their affective mental health condition; hence, rates may fluctuate across time.
- Table 3
Effect of Baseline Characteristics on Time to Developing Incident Multimorbidity Between 2002-2003 and 2012-2013: Complementary Log-Log Models
Characteristic No Condition in 2002-2003 (n = 1,477) and ≥2 Incident Conditions (Multimorbidity) by 2012-2013 Any Number of Conditions in 2002- 2003 (n = 4,564) and ≥1 Incident Conditions by 2012-2013 HR (95% CI) P Value HR (95% CI) P Value Age, y Linear trend <.001 Linear trend <.001 50-54 1.00 [Reference] … 1.00 [Reference] … 55-59 1.44 (1.05-1.99)a .025a 1.29 (1.14-1.45)a <.001a 60-64 1.85 (1.31-2.61)a <.001a 1.42 (1.25-1.62)a <.001a 65-69 2.93 (2.08-4.13)a <.001a 1.49 (1.31-1.70)a <.001a ≥70 2.58 (1.83-3.64)a <.001a 1.49 (1.31-1.70)a <.001a Female (vs male) 1.14 (0.86-1.50) .360 1.10 (0.99-1.21) .072 Wealth quintiles Linear trend .001a Linear trend .002a 1 Wealthiest 1.00 [Reference] … 1.00 [Reference] … 2 1.27 (0.89-1.80) .185 0.97 (0.85-1.10) .620 3 1.41 (1.00-1.97) .049 1.08 (0.95-1.23) .215 4 1.23 (0.85-1.78) .269 1.11 (0.97-1.26) .120 5 Least wealthy 2.19 (1.50-3.19)a <.001a 1.22 (1.06-1.39)a .005a Educational attainment Linear trend .058 Linear trend .923 Degree /higher ed 1.00 [Reference] … 1.00 [Reference] … Intermediate 0.95 (0.73-1.23) .701 1.04 (0.94-1.15) .413 No qualification 0.73 (0.53-1.00) .051 1.00 (0.89-1.12) .993 Lives alone (vs cohabits) 0.93 (0.71-1.21) .580 1.08 (0.98-1.19) .128 BMI category (2004) Linear trend <.001a Linear trend <.001a Underweight or normal weight 1.00 [Reference] … 1.00 [Reference] … Overweight 1.15 (0.87-1.52) .339 1.10 (0.99-1.21) .070 Obese 1.92 (1.43-2.59)a <.001a 1.27 (1.14-1.42)a <.001a Smoking behavior Never smoked 1.00 [Reference] … 1.00 [Reference] … Smoked in past 1.12 (0.88-1.43) .359 1.09 (1.00-1.19) .050 Current smoker 1.22 (0.87-1.70) .248 1.21 (1.07-1.36)a .002a Physical activity Linear trend .031a Linear trend .004a High 1.00 [Reference] … 1.00 [Reference] … Medium 1.3 (1.00-1.70) .051 1.08 (0.97-1.19) .149 Low 1.43 (1.02-2.00)a .039a 1.19 (1.06-1.35)a .004a Social detachment (vs none) 1.16 (0.77-1.72) .480 1.07 (0.93-1.22) .360 External locus of control (vs internal) 1.41 (1.10-1.82)a .007a 1.13 (1.03-1.23)a .010a BMI = body mass index; HR = hazard ratio.
Note: Complementary log-log models are the discrete time equivalent of Cox proportional hazards models for continuous time. The reference category for each covariate is the first category listed. A HR >1.00 indicates increased risk, whereas an HR of <1.00 indicates reduced risk. Models were corrected for differential nonresponse using longitudinal sample weighting.
↵a Significant association.
- Table 4
Relative Association Between the Presence of Individual Conditions on Time to Developing Incident Multimorbidity Between 2002-2003 and 2012-2013: Complementary Log-Log Model
Condition HR (95% CI) P Value Hypertension 1.00 [Reference] … Ischemic heart disease 1.27 (0.91-1.78) .162 Arrhythmia 1.55 (1.06-2.26)a .024a Diabetes mellitus 1.06 (0.63-1.78) .839 COPD 2.32 (1.55-3.46)a <.001a Asthma 1.33 (1.05-1.70)a <.019a Arthritis (any) 0.98 (0.83-1.16) .819 Osteoporosis 1.32 (0.87-2.01) .185 Cancer (any) 1.19 (0.86-1.63) .295 Affective mental health condition (any) 0.97 (0.71-1.31) .831 Otherb 1.21 (0.64-2.30) .552 COPD = chronic obstructive pulmonary disease; HR = hazard ratio.
Note: From a sample of participants having 1 condition in 2002-2003 (n = 1,534), and an outcome of 1 or more incident conditions. Complementary log-log models are discrete time equivalent of Cox proportional hazards models for continuous time. This model adjusted for all baseline patient characteristics, and differential nonresponse using longitudinal sample weighting. HR >1.00 represents increased risk; an HR of <1.00 indicates reduced risk.
↵a Conditions significantly more more likely than hypertension to be associated with incident multimorbidity.
↵b Includes participants with conditions with low prevalence; congestive heart failure, stroke, psychotic mental health condition, and dementia/Alzheimer’s (Table 2). Combined, these individuals in the “other” category accounted for <1% of the sample.
Supplemental Appendix
Supplemental Appendix
Files in this Data Supplement:
- Supplemental data: Appendix - PDF file
The Article in Brief
Predicting Incident Multimorbidity
Jose M. Valderas , and colleagues
Background If multimorbidity (multiple medical conditions in an individual) is to be prevented, it is important to identify the characteristics that contribute to it.
What This Study Found Results of a 10-year study find that, for adults age 50 and older, risks of developing multimorbidity are positively associated with age and are higher for those with low socioeconomic status, obesity, low level of physical activity, or an external locus of control (believing that life events are outside of their control). No significant associations were observed for sex, educational attainment, or social detachment.
Implications
- The authors suggest that future work to reduce the incidence of multimorbidity should promote healthy lifestyles while targeting an internal locus of control in order to empower patients to achieve and maintain behavior change with the potential for synergistic effects.
In this issue


Jump to section
Related Articles
Cited By...
- Analytical approaches to evaluate risk factors of multimorbidity: a systematic scoping review protocol
- Association of polydoctoring and mortality among persons over 85 years with multimorbidity: a prospective cohort study in Japan
- Work-Family conflict among hotel housekeepers in the Balearic Islands (Spain)
- Effects of individual and parental educational levels on multimorbidity classes: a register-based longitudinal study in a Danish population
- Magnitude, pattern and correlates of multimorbidity among patients attending chronic outpatient medical care in Bahir Dar, northwest Ethiopia: the application of latent class analysis model
- Multimorbidity of chronic non-communicable diseases: burden, care provision and outcomes over time among patients attending chronic outpatient medical care in Bahir Dar, Ethiopia--a mixed methods study protocol
- Household and area-level social determinants of multimorbidity: a systematic review
- Biomarkers in the prediction of multimorbidity: scoping review
- Sociodemographic and lifestyle predictors of incident hospital admissions with multimorbidity in a general population, 1999-2019: the EPIC-Norfolk cohort
- Multimorbidity of chronic non-communicable diseases and its models of care in low- and middle-income countries: a scoping review protocol
- Prevalence, characteristics, and patterns of patients with multimorbidity in primary care: a retrospective cohort analysis in Canada
- In This Issue: Teachable Moments for Patients, Practices, and Systems