
Article Figures & Data
Figures
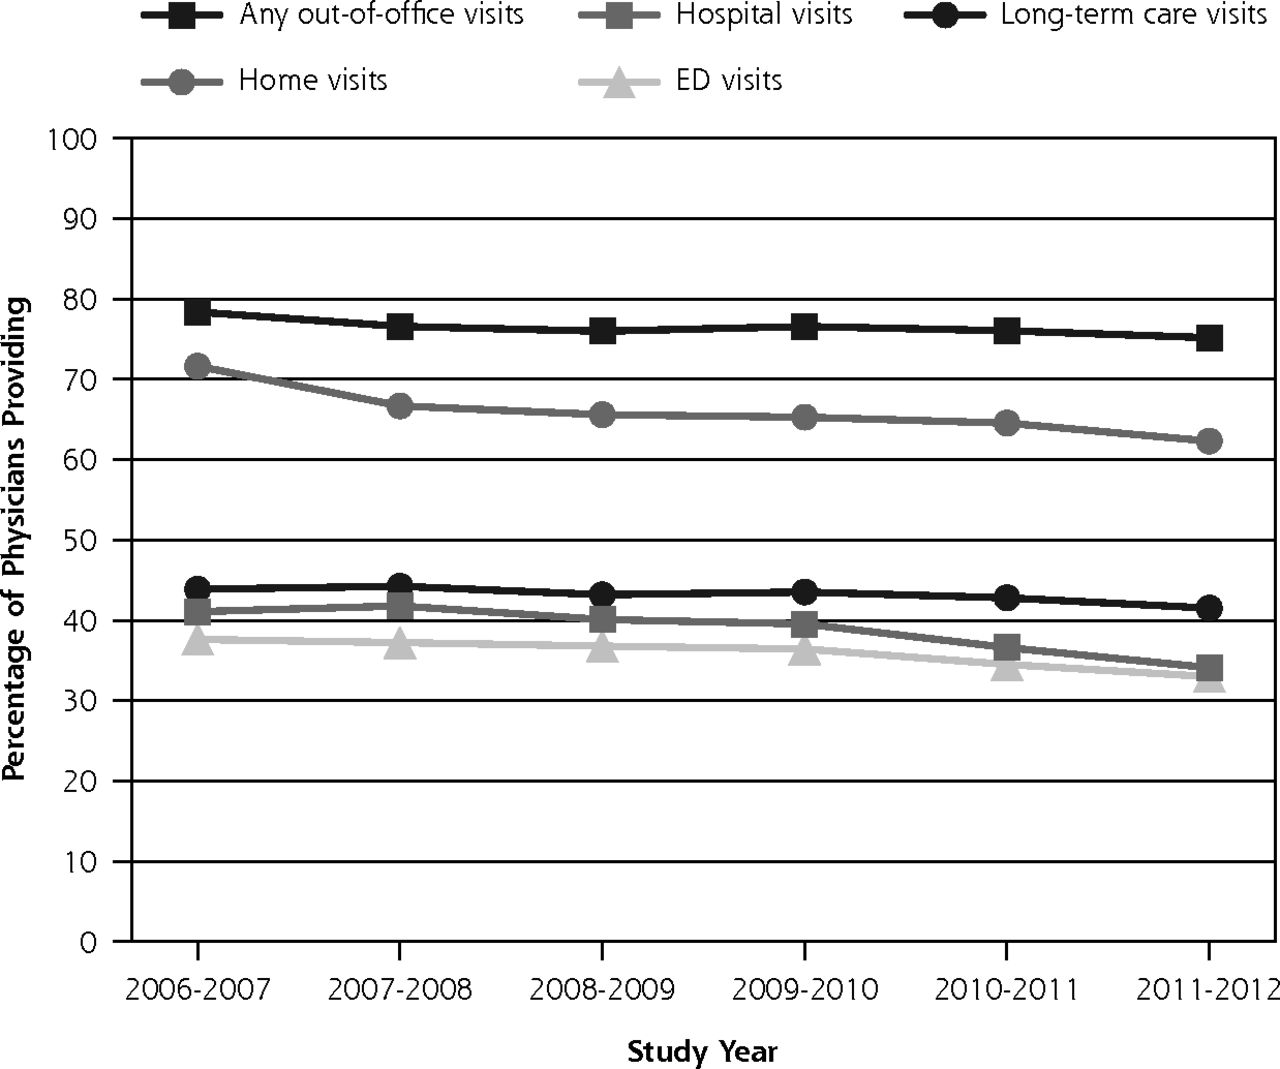
- Figure 1
Percentage of cohort providing home, long-term care, hospital, or emergency department visits by study year.
ED = emergency department.
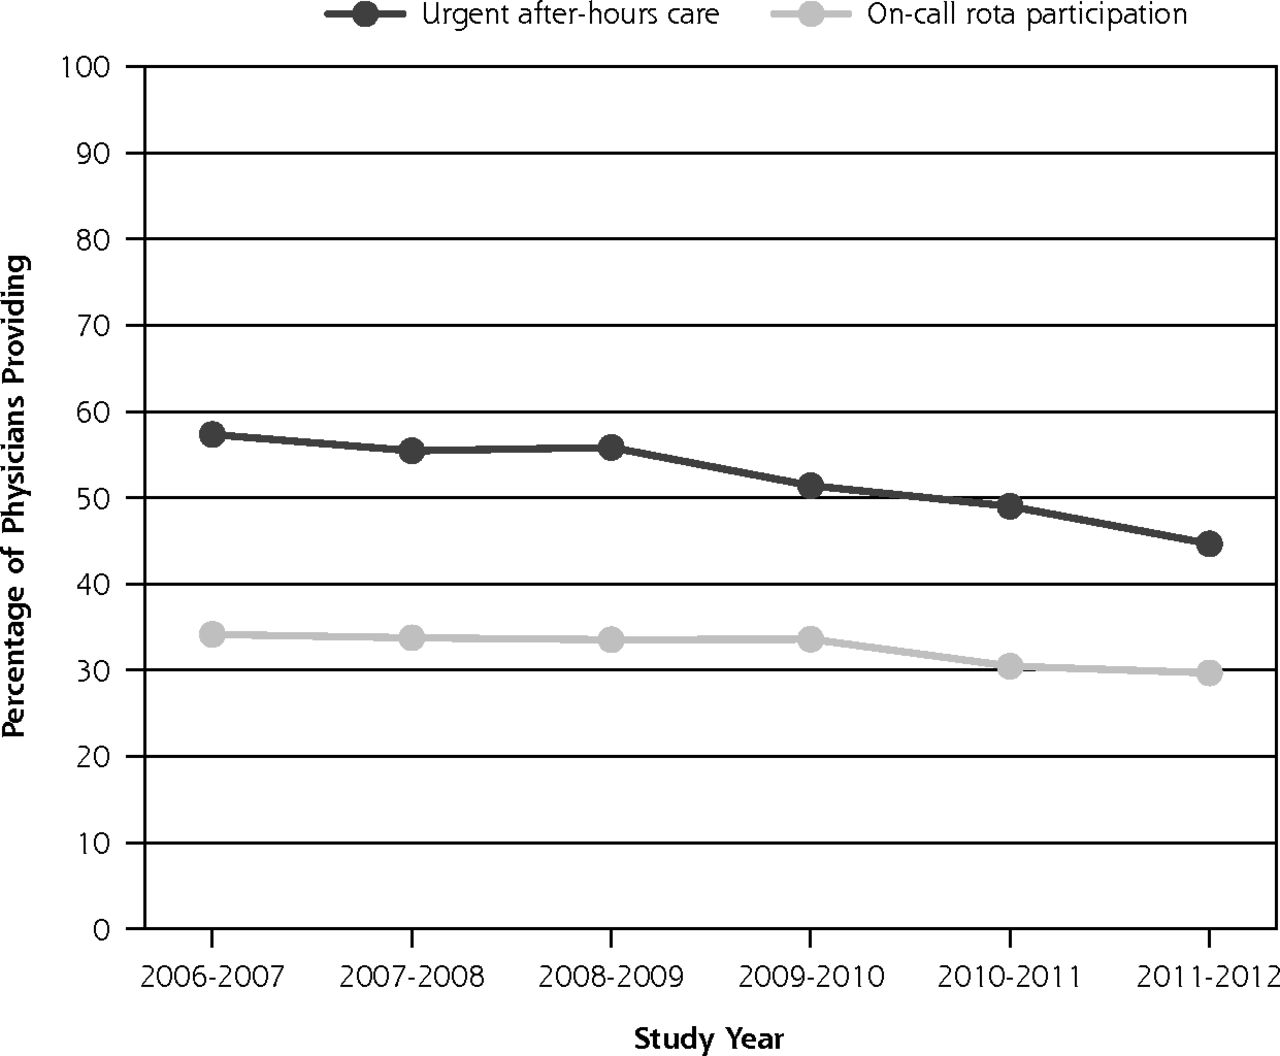
- Figure 2
Percentage of cohort providing after-hours care and on-call support by year.
Note: Locations included patients’ homes, long-term care facilities, emergency departments and acute-care hospitals, diagnostic facilities, mental health centers, community location (eg, school), or other.


Tables
Characteristic All Study Years
(n = 6,531)2011-2012 by Area (n = 5,436) Rural
(n = 871)Urban
(n = 1,386)Metropolitan
(n = 3,179)Total
(n = 5,436)Sex, No. (%)a Female 2,449 (37.5) 312 (35.8) 499 (36.0) 1,249 (40.2) 2,090 (38.4) Male 4,082 (62.5) 559 (64.8) 887 (64.0) 1,900 (59.8) 3,346 (61.6) Age, mean (SD), yb … 47.8 (11.2) 50.9 (11.3) 51.0 (11.6) 50.6 (11.5) Age-group, No. (%), yc <35 … 115 (13.2) 119 (8.6) 310 (9.8) 544 (10.0) 35-<45 … 250 (28.7) 289 (20.9) 619 (19.5) 1,158 (21.3) 45-<55 … 248 (28.5) 449 (32.4) 1012 (31.8) 1,709 (31.4) 55-<65 … 196 (22.5) 369 (26.6) 827 (26.0) 1,392 (25.6) ≥65 … 62 (7.1) 160 (11.5) 411 (12.9) 633 (11.6) Trained internationally, No. (%)d 1,913 (29.9) 305 (35.7) 427 (31.9) 808 (26.1) 1,550 (29.1) Average compensation, mean (SD), Can$ Fee-for-service paymentse 170,569 (140,779) 197,595 (138,096) 195,828 (128,348) 190,046 (145,446) 192,730 (138,096) APP paymentsf 31,538 (57,049) 44,942 (57,637) 34,280 (60,347) 31,647 (59,966) 34,449 (59,872) Location of OOO visits provided, No. (%) Homeg 3,627 (55.5) 382 (43.9) 580 (41.9) 904 (28.4) 1,866 (34.3) Long-term care facilityh 3,629 (55.6) 489 (56.1) 791 (57.1) 991 (31.2) 2,271 (41.8) Emergency departmenti 3,330 (51.0) 594 (68.2) 618 (44.6) 574 (18.1) 1,786 (32.9) Hospital (non-emergency)j 5,123 (78.4) 734 (84.3) 1,022 (73.7) 1,640 (51.6) 3,396 (62.5) Provided OOO visits at any location, No. (%)k 5,555 (85.1) 802 (92.1) 1,195 (86.2) 2,100 (66.1) 4,097 (75.4) After-hours contacts, No. (%)l 4,190 (64.2) 637 (74.7) 716 (52.8) 990 (32.7) 2,343 (44.7) On-call participation, No. (%)m 2,731 (41.8) 568 (65.2) 501 (36.2) 540 (17.0) 1,609 (29.6) APP = alternative payment plan; OOO = out-of-office.
Note: Statistical tests for differences in outcome by type of area of practice location, 2011-2012 only (P <.05).
↵a χ2 = 10.4, P = .006
↵b F = 29.0, P <.0001
↵c χ2 = 66.3, P <.0001 χ2
↵d Frequency missing: 133; χ2 = 36.85, P <.0001
↵e F = 17.0, P <.0001
↵f F = 1.45, P = .2353
↵g χ2 = 118.9, P <.0001
↵h χ2 = 354.1, P <.0001
↵i χ2 = 895.2, P <.0001
↵j χ2 = 412.2, P <.0001
↵k χ2 = 367.3, P <.0001
↵l χ2 = 523.4, P <.0001
↵m χ2 = 801.3, P <.0001
Characteristic Model 1: Rural
OR (95% CI)Model 2: Urban
OR (95% CI)Model 3: Metropolitan
OR (95% CI)Panel A: Any out–of-office care Sex (female) 0.29 (0.21-0.40)a 0.53 (0.43-0.66)a 0.65 (0.59-0.72)a Year 0.95 (0.88-1.03) 0.92 (0.87-0.96)b 0.94 (0.92-0.96)a Age, y 35-<45 0.58 (0.33-1.03) 0.92 (0.66-1.28) 0.95 (0.83-1.09) 45-<55 0.30 (0.17-0.52)a 0.72 (0.52-1.00)c 1.04 (0.91-1.19) 55-<65 0.22 (0.13-0.40)a 0.56 (0.40-0.79)b 0.78 (0.68-0.90)b ≥65 0.08 (0.04-0.16)a 0.24 (0.16-0.34)a 0.39 (0.33-0.46)a Training (international) 1.64 (1.20-2.24)c 0.84 (0.70-1.00) 0.98 (0.90-1.07) Proportion APP 1.20 (0.71-2.03) 7.22 (4.49-11.60)a 1.47 (1.24-1.74)a Proportion female 47.47 (15.68-143.70)a 27.42 (11.77-63.87)a 5.46 (3.89-7.65)a Proportion aged ≥65 y 79.89 (24.36-261.94)a 114.13 (54.11-240.69)a 168.95 (121.50-234.93)a Proportion >1 Chronic ADGs 72.68 (23.17-227.99)a 56.99 (24.53-132.44)a 14.46 (10.73-19.50)a Proportion low SES 0.01 (0.01-0.03)a 1.84 (0.79-4.29) 0.22 (0.16-0.32)a Panel B: Home visits Sex (female) 0.66 (0.53-0.82)b 0.66 (0.55-0.79)a 0.66 (0.58-0.75)a Year (continuous) 0.93 (0.89-0.97)b 0.91 (0.88-0.94)a 0.92 (0.90-0.94)a Age, y 35-<45 1.27 (0.99-1.61) 1.03 (0.83-1.29) 1.30 (1.09-1.55)c 45-<55 1.50 (1.16-1.94)c 1.23 (0.98-1.54) 1.87 (1.57-2.23)a 55-<65 1.64 (1.24-2.17)b 1.27 (1.00-1.62) 2.01 (1.68-2.41)a ≥65 0.68 (0.46-1.01) 0.67 (0.50-0.90)c 1.39 (1.12-1.72)c Training (international) 0.97 (0.81-1.16) 0.95 (0.82-1.10) 0.94 (0.84-1.05) Proportion APP 0.13 (0.08-0.19)a 0.24 (0.18-0.33)a 0.24 (0.20-0.29)a Proportion female 2.46 (1.11-5.48)c 3.54 (1.74-7.21)b 1.90 (1.26-2.86)b Proportion aged ≥65 y 18.52 (9.41-36.46)a 43.81 (25.57-75.06)a 12.34 (9.03-16.87)a Proportion >1 chronic ADGs 2.15 (0.99-4.65) 0.20 (0.10-0.39)a 0.66 (0.46-0.94)c Proportion low SES 0.26 (0.13-0.51)a 0.92 (0.47-1.83) 0.33 (0.21-0.51)a Panel C: Long-term care visits Sex (female) 0.58 (0.46-0.75)a 0.69 (0.57-0.84)b 0.58 (0.46-0.75)a Year (continuous) 0.98 (0.94-1.03) 0.96 (0.93-1.00)c 0.98 (0.94-1.03) Age, y 35-<45 1.16 (0.90-1.50) 0.77 (0.62-0.96)c 1.16 (0.90-1.50) 45-<55 1.03 (0.78-1.36) 0.82 (0.65-1.03) 1.03 (0.78-1.36) 55-<65 0.80 (0.59-1.09) 0.74 (0.57-0.95)c 0.80 (0.59-1.09) ≥65 0.47 (0.31-0.73)b 0.42 (0.31-0.57)a 0.47 (0.31-0.73)b Training (international) 1.18 (0.95-1.45) 1.16 (0.98-1.38) 1.18 (0.95-1.45) Proportion APP 0.13 (0.08-0.19)a 0.27 (0.20-0.36)a 0.13 (0.08-0.19)a Proportion female 7.96 (3.34-18.94)a 4.65 (2.36-9.14)a 7.96 (3.34-18.94)a Proportion aged ≥65 y 100.32 (45.47-221.36)a 90.86 (51.98-158.82)a 100.32 (45.47-221.36)a Proportion >1 chronic ADGs 1.84 (0.80-4.22) 0.53 (0.29-0.98)c 1.84 (0.80-4.22) Proportion low SES 0.19 (0.09-0.40)a 7.46 (3.78-14.74)a 0.19 (0.09-0.40)a Panel D: Emergency department visits Sex (female) 0.49 (0.38-0.62)a 0.53 (0.44-0.64)a 0.59 (0.51-0.67)a Year 0.95 (0.91-0.99)c 0.96 (0.93-0.99)c 0.93 (0.91-0.95)a Age, y 35-<45 0.70 (0.53-0.93)c 0.60 (0.48-0.75)a 0.67 (0.58-0.78)a 45-<55 0.56 (0.41-0.76)b 0.44 (0.35-0.55)a 0.58 (0.49-0.68)a 55-<65 0.36 (0.26-0.50)a 0.35 (0.27-0.44)a 0.45 (0.38-0.54)a ≥65 0.18 (0.12-0.28)a 0.20 (0.14-0.27)a 0.30 (0.24-0.38)a Training (international) 1.35 (1.08-1.68)c 0.86 (0.73-1.01) 0.89 (0.77-1.02) Proportion APP 1.58 (1.10-2.29)c 4.36 (3.30-5.77)a 1.33 (1.14-1.57)b Proportion female 1.98 (1.01-3.89)c 0.89 (0.48-1.65) 1.20 (0.85-1.69) Proportion aged ≥65 y 0.42 (0.22-0.81)c 0.59 (0.36-0.96)c 0.61 (0.46-0.81)b Proportion >1 chronic ADGs 3.79 (1.94-7.39)a 4.05 (2.28-7.20)a 3.93 (2.85-5.41)a Proportion low SES 0.37 (0.20-0.67)c 1.67 (0.87-3.19) 0.53 (0.36-0.79)c Panel E: Hospital visits Sex (female) 0.29 (0.22-0.37) 0.58 (0.49-0.68)a 0.67 (0.61-0.74)a Year (continuous) 0.89 (0.84-0.94)b 0.87 (0.84-0.90)a 0.90 (0.88-0.92)a Age, y 35-<45 0.73 (0.50-1.07) 0.77 (0.60-0.98)c 0.77 (0.67-0.87)a 45-<55 0.47 (0.32-0.68)a 0.56 (0.44-0.71)a 0.90 (0.80-1.03) 55-<65 0.31 (0.21-0.46)a 0.56 (0.44-0.73)a 0.64 (0.56-0.73)a ≥65 0.10 (0.06-0.17)a 0.25 (0.19-0.33)a 0.36 (0.31-0.42)a Training (international) 1.05 (0.84-1.31) 0.94 (0.82-1.07) 1.04 (0.96-1.12) Proportion APP 0.10 (0.07-0.15)a 0.62 (0.47-0.81)b 0.81 (0.69-0.95)c Proportion female 106.55 (39.46-287.72)a 38.00 (19.25-75.02)a 18.77 (13.43-26.23)a Proportion aged ≥65 y 21.90 (8.78-54.66)a 12.11 (7.19-20.41)a 37.81 (29.15-49.04)a Proportion >1 chronic ADGs 260.50 (92.55-733.19)a 49.72 (25.39-97.39)a 14.89 (11.22-19.75)a Proportion low SES 0.05 (0.02-0.10)a 2.71 (1.42-5.17)c 0.21 (0.15-0.30)a - Table 3
Logistic Modeling Results for the Provision of After-hours Care and On-call Participation
Characteristic Model 1: Rural
OR (95% CI)Model 2: Urban
OR (95% CI)Model 3:
Metropolitan OR (95% CI)Panel A: Urgent After-Hours Care Sex (female) 0.46 (0.35-0.59)a 0.54 (0.45-0.65)a 0.66 (0.58-0.75)a Year 0.94 (0.90-0.98)c 0.89 (0.86-0.91)a 0.87 (0.85-0.89)a Age, y 35-<45 0.77 (0.57-1.04) 0.69 (0.55-0.86)c 0.8 (0.69-0.92)c 45-<55 0.75 (0.55-1.04) 0.56 (0.44-0.71)a 1.02 (0.88-1.18) 55-<65 0.42 (0.30-0.59)a 0.47 (0.37-0.61)a 0.94 (0.80-1.10) ≥65 0.23 (0.15-0.36)a 0.3 (0.22-0.41)a 0.71 (0.59-0.86)b Training (international) 1.22 (0.97-1.55) 0.98 (0.83-1.15) 0.86 (0.76-0.97)c Proportion APP 0.41 (0.29-0.58)a 0.89 (0.69-1.16) 0.63 (0.54-0.73)a Proportion female 6.43 (3.15-13.14)a 3.67 (2.02-6.69)a 2.82 (2.03-3.91)a Proportion aged ≥65 y 5.5 (2.69-11.22)a 2.66 (.64-4.30)a 3.27 (2.51-4.27)a Proportion >1 chronic ADGs 4.44 (2.18-9.04)a 2.45 (1.40-4.28)c 1.86 (1.39-2.50)a Proportion low SES 0.24 (0.13-0.46)a 1.71 (0.92-3.21) 0.39 (0.27-0.57)a Panel B: On-call rota participation Sex (female) 0.56 (0.43-0.73)a 0.59 (0.48-0.72)a 0.81 (0.70-0.94)c Year (continuous) 0.93 (0.90-0.97)b 0.96 (0.93-0.98)c 0.93 (0.91-0.95)a Age, y 35-<45 0.84 (0.66-1.07) 0.78 (0.65-0.94)c 0.73 (0.64-0.84)a 45-<55 0.77 (0.58-1.01) 0.63 (0.51-0.78)a 0.67 (0.58-0.79)a 55-<65 0.44 (0.33-0.60)a 0.47 (0.37-0.59)a 0.47 (0.40-0.56)a ≥65 0.16 (0.10-0.24)a 0.3 (0.22-0.40)a 0.32 (0.25-0.40)a Training (international) 1.3 (1.03-1.64)c 1.33 (1.12-1.59)c 1.08 (0.93-1.26) Proportion APP 5.51 (3.76-8.06)a 4.35 (3.46-5.46)a 2.16 (1.89-2.46)a Proportion female 0.75 (0.39-1.44) 1.39 (0.84-2.32) 1.38 (1.04-1.84)c Proportion aged ≥65 y 1.36 (0.71-2.60) 1.29 (0.83-2.02) 1.35 (1.04-1.74)c Proportion >1 chronic ADGs 2.6 (1.41-4.83)c 5.54 (3.45-8.89)a 3.02 (2.29-3.99)a Proportion low SES 0.45 (0.25-0.82)c 3.18 (1.80-5.64)a 0.77 (0.56-1.08)
Supplemental Table
Supplemental Table
Files in this Data Supplement:
- Supplemental data: Table - PDF file
The Article in Brief
Trends in Providing Out-of-Office, Urgent After-Hours, and On-Call Care in British Columbia
Lindsay Hedden , and colleagues
Background Providing care outside of office hours and in alternative (non-office) locations (such as facilities for urgent after-hours care or long-term care), helps increase access and comprehensiveness of primary care. This study examines trends in and determinants of the provision of these services in a cohort of primary care physicians in British Columbia, Canada.
What This Study Found During a six-year period, there was a significant decline in the provision of primary care services outside of regular office hours and at alternative locations. An analysis of physician-level payments for all primary care physicians practicing in British Columbia between 2006 and 2012 (n=6,531 physicians) found that the proportion of physicians providing care in non-office locations and after hours declined significantly in rural, urban, and metropolitan practice locations. Declines ranged from five percent for long-term care visits to 22 percent for after-hours care. Female physicians and those in the oldest age category had lower odds of providing care at alternative locations or in urgent after-hours care. Rural physicians had significantly higher odds of providing care in alternative locations and after hours compared to those practicing in metropolitan areas. The authors note that these declines occurred in the context of significant financial incentives intended to promote full-service family practice.
Implications
- This trend in provision of services points to increasing challenges in primary care accessibility, both within Canada and elsewhere, according to the authors.


Jump to section
Related Articles
Cited By...
- Changes in comprehensiveness of services delivered by Canadian family physicians: Analysis of population-based linked data in 4 provinces
- Characteristics and practice patterns of family physicians who provide home visits in Ontario, Canada: a cross-sectional study
- Declining Comprehensiveness of Services Delivered by Canadian Family Physicians Is Not Driven by Early-Career Physicians
- In This Issue: Minding the Gaps