
Abstract
PURPOSE Persons with disabilities often experience uncoordinated health care, with repeated out-of-pocket copays. One purpose of the Patient Protection and Affordable Care Act (ACA) was to create zero copays for preventive health care including an annual wellness visit (AWV). The purpose of this study was to document the use of AWVs by persons with physical disabilities during the ACA rollout.
METHODS An administrative claims database, including both Medicare Advantage (MA) and commercial (COM) payers from 2008 to 2016, was used to identify unique wellness visits for adults with physical disabilities. We used interrupted time series analysis to compare AWV use by insurance type, sex, disability type, and race over time.
RESULTS The proportion of zero copays provided a timeline of ACA implementation categorized as pre-ACA, ACA-implementation, and post-ACA periods. By 2016, AWV use maximized at 47.6% (95% CI, 44.7%-50.8%) among COM-insured White women with congenital disabilities. By 2016, the lowest AWV use reached one-half the maximum, at 21.6% (95% CI, 18.4%-25.2%) among COM-insured Hispanic men with acquired disabilities. MA-insured Black and Hispanic men with acquired disabilities reached similarly low levels of AWV use.
CONCLUSION The ACA mandated zero copays, thereby allowing persons with physical disabilities the option for preventive health care without cost. Insurance type and sex significantly influenced AWV use, followed by disability type and race. Gaps in AWV use were exposed by insurance type, sex, disability, and race for persons with disabilities. Gaps in AWV use were also exposed between the general population and persons with disabilities.
Annals “Online First” article.
INTRODUCTION
Improving health for persons with disabilities is a relatively recent commitment in the United States. Healthy People 2010 (HP2010) was the first set of health targets to include goals for persons with disabilities,1 occurring in response to the 2005 Surgeon General's call to action.2 The HP2010 final report indicated that 11 of the 81 targets for persons with disabilities had been met.3
In 2010, the Patient Protection and Affordable Care Act of 2010 (ACA) was passed to increase the use of preventive services among all people aged ≥18 years by providing designated preventive services, including annual wellness visits (AWVs), at no cost to the enrollee.4,5 Annual wellness visits include assessment of medical, family, and social history including alcohol, tobacco, and drug use; diet and physical activity; vital signs such as blood pressure, weight, height, and visual acuity; cognitive or functional impairments; risk factors for depression or mood disorders; and personalized health advice to decrease risk factors for chronic diseases. Unlike specific single prevention goals, such as blood pressure check, which are not linked to increased use of other broad preventive services,6 some reports have shown that the use of AWVs increases the likelihood of having more expansive preventive screenings such as immunizations, cancer screenings, depression screening, and cardiovascular screening.7-10
Adults with physical disabilities have more chronic illnesses than the general population,11 have 3 times more unmet health care needs than nondisabled persons,12 and have increased needs for primary and secondary prevention compared with the general population.13 Despite these increased needs, there is a gap in existing knowledge regarding the use of AWVs in this adult population. Increasing AWV use might be one way to increase the overall health of persons with disabilities.
The present study focuses on persons with physical ambulatory disabilities who have either Medicare Advantage (MA) or commercial (COM) insurance and their use of AWVs from 2008 to 2016. Using zero copay as an indicator of ACA implementation timing and the removal of a cost barrier, our aim was to measure changes in AWV use throughout the ACA time-frame for adults with congenital or acquired physical disabilities.
METHODS
Data Source
We obtained administrative claims from the Optum Clinformatics Data Mart (CDM) database (Optum Inc) for the study period January 1, 2008 to December 31, 2016. The CDM, representing deidentified MA and COM enrollees with medical and pharmacy coverage throughout their insurance enrollment, is described elsewhere.14
Patient Population
We selected adults aged ≥18 years who had a diagnosis of cerebral palsy, spina bifida, multiple sclerosis, spinal cord injury, hemiplegia, paraplegia, or quadriplegia during the calendar year of enrollment using International Classification of Diseases, 9th and 10th Revisions,15,16 diagnostic codes (Supplemental Table 1, https://www.AnnFamMed.org/lookup/suppl/doi:10.1370/afm.2712/-/DC1). To be included in the study, we required patients to be continuously enrolled during a given calendar year (Supplemental Figure 1, https://www.AnnFamMed.org/lookup/suppl/doi:10.1370/afm.2712/-/DC1). Cerebral palsy and spina bifida were considered congenital conditions, and the remainder were considered acquired conditions.
This was a quasiexperimental, repeated, cross-sectional study given that each patient-calendar year could reflect a slightly different patient population for which outcomes were measured. For example, for adults with congenital conditions, a patient's first year in the study was defined as the date of diagnosis at any point during that year or before the study period, with the same insurance group and with continuous enrollment. For adults with acquired conditions, a patient's first year in the study was defined as the year after the date of initial diagnosis. We then examined all subsequent years that that patient had a full calendar year of enrollment with the same insurance company for inclusion in the study population. Patients could move in and out of each calendar year. For hierarchical classification, we prioritized congenital disabilities with appropriate clinical consultation and feasibility. Given that this study could reflect underlying changes in patient population over time, key stratifications based on payer, disability, sex, and race were examined.
Outcome Variables
The primary outcome was AWV use during the full calendar year that the patient was enrolled in the plan. Patient copayment for the AWV during the same study period was used to define the 3 time frames of the study: before ACA (pre), during ACA (implementation), and after ACA (post). AWVs were identified from medical claims using Current Procedural Terminology codes for preventive visits for those aged <65 years as new (99385-99387) or established (99395-99397) and AWVs for those aged ≥65 years as first (G0438) and subsequent (G0439) during the calendar year.
Statistical Analysis
Annual wellness visit use was calculated by the number of persons with ≥1 coded AWV in a 12-month time frame divided by the number of persons with specified disabilities enrolled in that year. For the uncommon situation in which a person had >1 AWV coded during a 12-month time frame, we censored subsequent codes. We calculated the proportion of zero copays using the number of persons who had zero copays for the specific service year divided by all users for that calendar year.
To examine the effect of the ACA on AWV use across various strata, we implemented an interrupted time series analysis (ITSA) design with 3 phases. We considered 2008-2010 to be the pre-ACA period (the time frame before its legality was established). The post-ACA period was defined as 2014-2016 given that this was the stable period with zero copayments after the 2011-2013 years of ACA implementation. Because the ACA underwent phased implementation, most notably for the commercially insured population with grandfathered plans that were not subject to ACA requirements, the gradual changes in cost and use during the implementation period took several years.
The ITSA models used an ordinary least-squares approach. As reported,17 underlying assumptions for ITSA require that preintervention trends for each group be linear, which can be confirmed via visual inspection or statistical analysis of linear trend with a sufficient number of time points. Interrupted time series analysis models also assume that the parameter estimates are not controlled for other covariates that would traditionally be considered for risk adjustment. A prevailing assumption is that the characteristics of the population remain unchanged throughout the study period, and any changes in the underlying population characteristics cannot be directly attributable to the outcome. Race, sex, and insurance strata predicated on the aforementioned assumptions were used to conduct comparisons on use and copayments using multiple group ITSA.17
To assess the effect of the ACA, we performed a series of multiple-group ITSAs with a lag using ordinary least-squares estimation while accounting for autocorrelation, as described previously.17-19 The selection of the appropriate lag is critical, based on autocorrelation testing, to examine the adequacy of the time-series model based on whether tests and CIs on the regression coefficients are satisfactorily estimated. We used Cumby-Huizinga general tests for autocorrelation to establish the appropriate lag for the ITSA models to ensure accurate estimation of intervention and trend effects.
The demographic characteristics of the population were compared with t tests for age as a continuous variable and with χ2 testing for all categorical variables. All analyses were conducted using SAS version 9.4 (SAS Institute Inc) and Stata version 15.0 (StataCorp LLC). All statistical testing was 2-tailed with an α ≤.05.
RESULTS
From 2008 to 2016, a total of 317,188 unique individuals were identified, of which 317,134 had complete data for insurance and demographic variables. The COM group was significantly younger and more female, predominantly White, and had different proportions of congenital and acquired disabilities compared to the MA group (Supplemental Table 2, https://www.AnnFamMed.org/lookup/suppl/doi:10.1370/afm.2712/-/DC1).
Patients with spina bifida (3.6%), cerebral palsy (6.1%), and multiple sclerosis (27.1%) were significantly younger than those with the other disabilities (spinal cord injury [14.6%], paraplegia [5.1%], quadriplegia [2.5%], and hemiplegia [41.0%]) (Table 1). Among all patients, multiple sclerosis, spina bifida, spinal cord injury, and hemiplegia occurred significantly more often in females than in males. The most common disability was hemiplegia among Asian patients (3.2%), quadriplegia among Black (15.8%) and Hispanic patients (13.6%), and multiple sclerosis among White patients (80.6%). Those with acquired disabilities had MA insurance significantly more often than those with congenital disabilities.
Population Description by Physical Disability Type
By Insurance
Before the ACA, AWV use among MA members in 2008 was 11.4% (95% CI, 10.7%-12.1%), and that for COM members was 31.3% (95% CI, 30.6%-32.1%). After full ACA implementation in 2016, AWV use among MA members (31.0% [95% CI, 30.7%-31.7%]) increased the most (trend = 4.39; 95% CI, 2.61%-6.17%) but still remained significantly less than that for COM members (38.0% [95% CI, 37.0%-38.5%]) (Figure 1, Supplemental Table 3, https://www.AnnFamMed.org/lookup/suppl/doi:10.1370/afm.2712/-/DC1). In addition, the rate of increase of AWVs over the 3 time frames was dominated by insurance status (Supplemental Table 3).
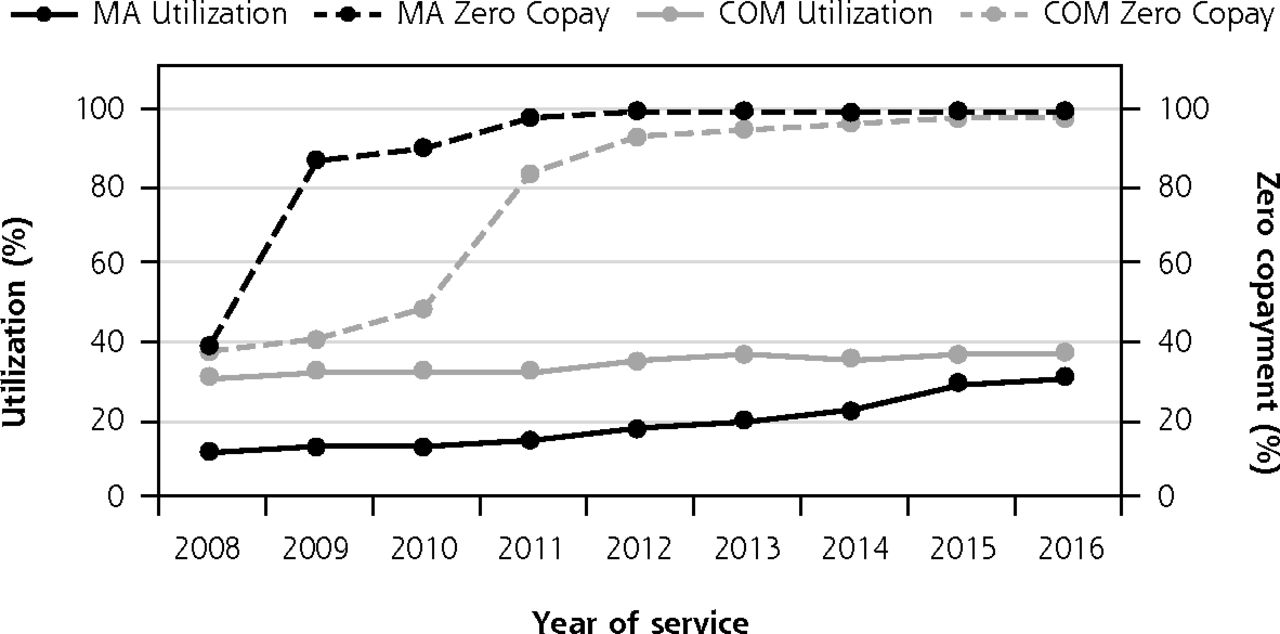
Establishment of ACA intervals by proportion of annual wellness visits with zero copay.
ACA = Affordable Care Act of 2010; COM = commercial; MA = Medicare Advantage.
Note: The Pre-ACA period is from 2008 to 2010. The ACA implementation period is from 2011 to 2013. The Post-ACA period is from 2014 to 2016. The dotted lines represent the proportion of zero copay by insurance type. The solid lines represent the proportion of the population receiving an annual wellness visit. Black lines represent MA claims. Gray lines represent COM claims.
By Disability
Before the ACA, AWV use among those with congenital disabilities (23.1% [95% CI, 21.9%-24.3%]) was significantly less than that among those with acquired disabilities (25.5% [95% CI, 24.9%-26.2%]) (Supplemental Table 3). By 2016, AWV use had increased for both disability types, with post-ACA use trends of 2.95 (95% CI, 1.95-3.95) and 2.48 (95% CI, 0.95-4.02) for congenital and acquired disabled persons, respectively; however, AWV use was no different between congenital and acquired disabilities.
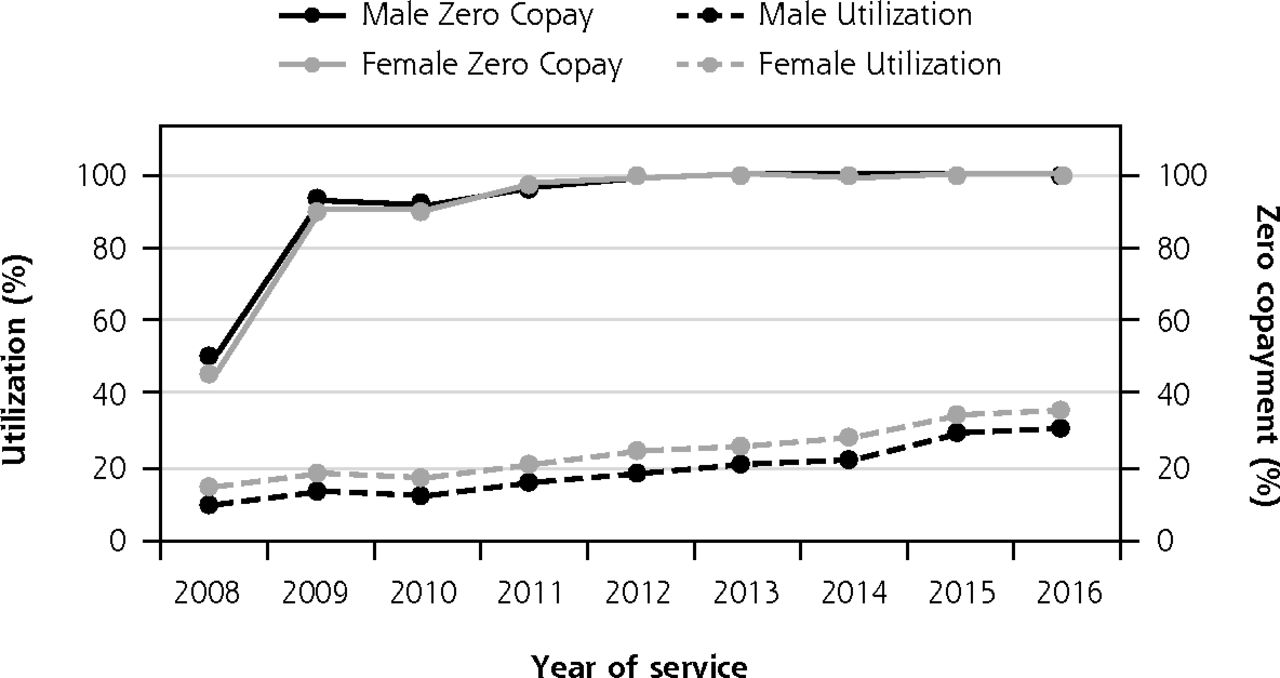
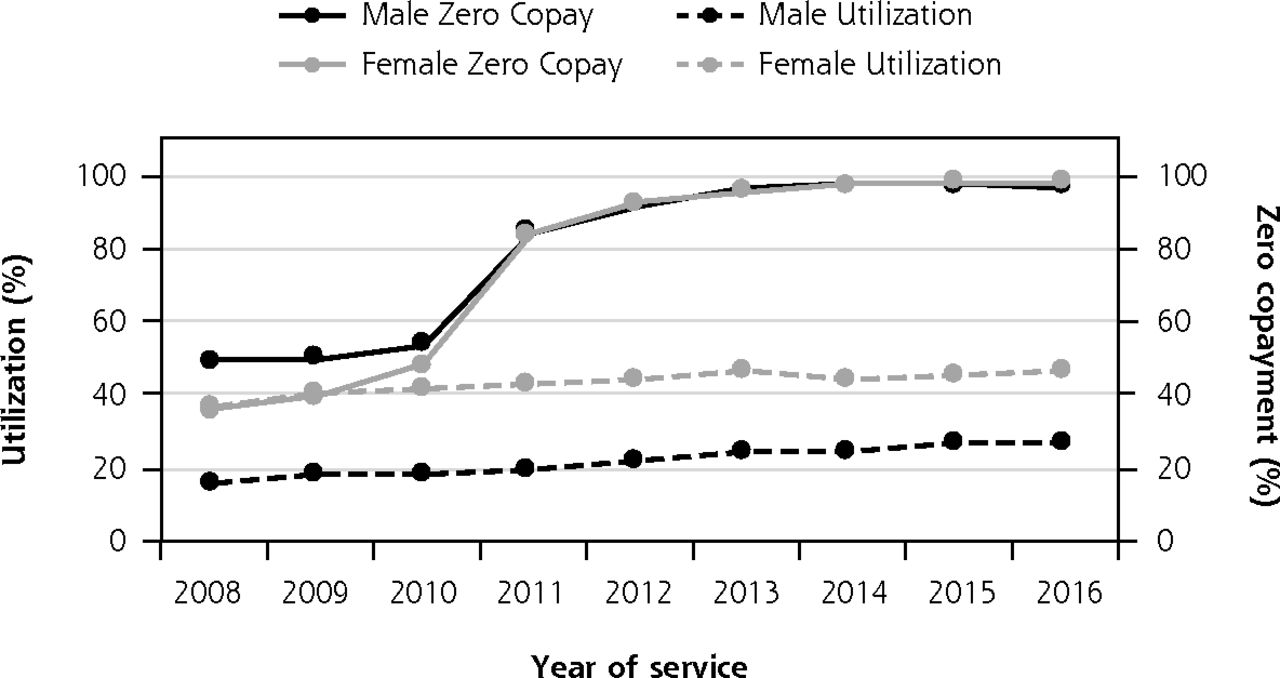
Disability evaluated by insurance membership showed that post ACA, MA-insured adults with acquired or congenital disabilities both had significantly fewer AWVs (Figure 2A, B) compared with respective COM members (Figure 2C, D). Whereas there was no difference in AWVs by disability for COM members (Figure 2C and Figure 2D), MA members with acquired disabilities had significantly fewer AWVs than those with congenital disabilities (Figure 2A, B).

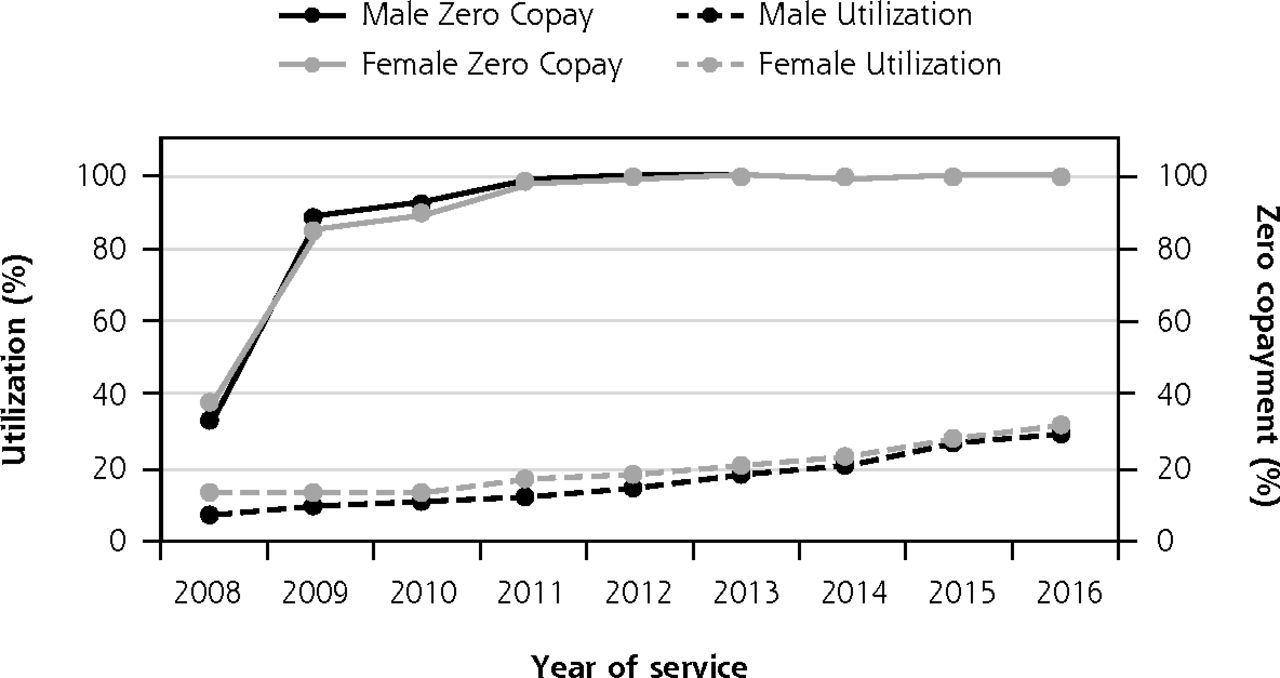


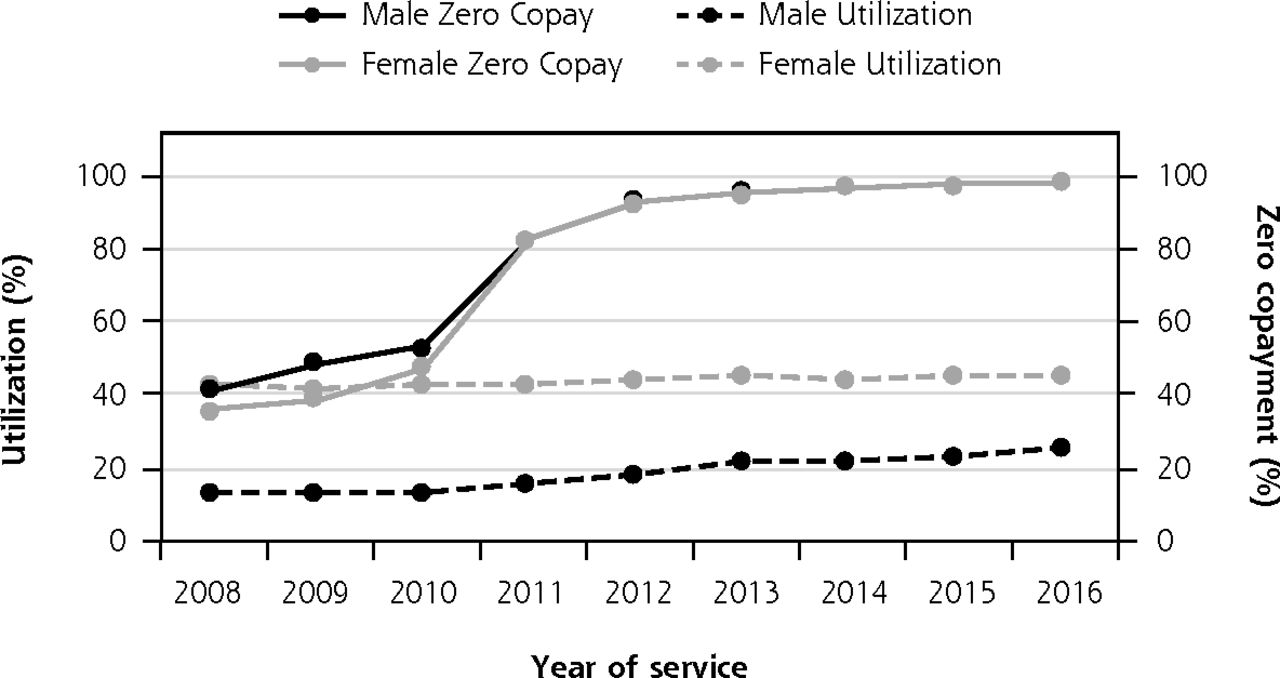
Proportion of zero copay and annual wellness visits by insurance, disability, and sex.
A. Annual wellness visits among MA insured, with congenital disability, by sex.
B. Annual wellness visits among MA insured, with acquired disability, by sex.
C. Annual wellness visits among COM insured, with congenital disability, by sex.
D. Annual wellness visits among COM insured, with acquired disability, by sex.
ACA = Affordable Care Act of 2010; COM = commercial; MA = Medicare Advantage.
Note: The Pre-ACA period is from 2008 to 2010. The ACA implementation period is from 2011 to 2013. The Post-ACA period is from 2014 to 2016. The solid lines represent the proportion of individuals with zero copay. The dotted lines represent utilization rate. Gray lines represent female. Black lines represent male.
By Sex
Before the ACA, initial AWV use among men (11.4% [95% CI, 10.8%-12.1%]) was approximately one-third that among women (33.0% [95% CI, 32.2%-33.8%]) (Supplemental Table 3). By 2016, whereas men significantly increased AWV use (28.5%), it was still significantly less than women's AWV use (36.8%). Rates of AWV use over the 3 time frames differed significantly by sex as well. Women had decreasing rates of AWV use during the pre-ACA period, increasing during ACA implementation, with yet greater increases in the post-ACA period (Supplemental Table 3). Men had a minimal positive rate of AWV use in the pre-ACA period but during ACA implementation significantly surpassed women's rate of AWV use and matching women's post-ACA rate.
By Race
Black and Hispanic patients had the lowest AWV use in 2008 (Black: 19.6% [95% CI, 18.1%-21.2%], Hispanic: 21.7% [95%. CI, 19.8%-23.8%]) compared to White patients (26.1% [95% CI, 25.4%-26.7%]), and despite varying increases in use over time, had the lowest AWV use in 2016 (Black: 30.1% [95% CI, 29.2%-31.1%], Hispanic: 30.1% [95% CI, 29.2%-31.1%]) compared with White patients (34.3% [95% CI, 33.9%-34.7%]) (Supplemental Table 3). The rate of AWV use over the 3 time frames by race was different than those for insurance, sex, and disability. In the pre-ACA period, White patients had a greater decrease in AWV use compared to Black patients (Supplemental Table 3), but in the post-ACA period, there was no difference in AWV use by race. All copays went to zero, owing to implementation of the ACA. Further stratification by insurance, sex, disability, and race are presented in Supplemental Table 4 (https://www.AnnFamMed.org/lookup/suppl/doi:10.1370/afm.2712/-/DC1), Supplemental Table 5 (https://www.AnnFamMed.org/lookup/suppl/doi:10.1370/afm.2712/-/DC1), Supplemental Table 6 (https://www.AnnFamMed.org/lookup/suppl/doi:10.1370/afm.2712/-/DC1), Supplemental Figure 2 (https://www.AnnFamMed.org/lookup/suppl/doi:10.1370/afm.2712/-/DC1), and Supplemental Figure 3 (https://www.AnnFamMed.org/lookup/suppl/doi:10.1370/afm.2712/-/DC1/).
DISCUSSION
The results of the present study show how AWV use by persons with physical disabilities changed over the timeline of the ACA. By 2016, AWV use maximized at 47.6% (95% CI, 44.7%-50.8%) among COM-insured White women with congenital disabilities. By 2016, the lowest AWV use reached one-half the maximum, at 21.6% (95% CI, 18.4%-25.2%) among COM-insured Hispanic men with acquired disabilities. MA-insured Black and Hispanic men with acquired disabilities reached similarly low levels of AWV use. In addition, our data showed that implementation of the ACA required a 3-year time frame to reach complete zero copay for 2 different health insurance types. Our rigorous definition of ACA time frames allowed for 3 evaluation periods of AWV use, whereas most other research has dichotomized the ACA without regard to an intermediary period of change,6,20-22 which was necessary for this population.
We found that during the pre-ACA period (2008-2010), women with physical disabilities, who had gained the greatest AWV use of all persons with disabilities, were decreasing their rate of attendance at AWVs at the same time both the Surgeon General and HP2010 were encouraging AWVs specifically for persons with disabilities.2,3 Whereas this negative trend was also seen among those with congenital disabilities and among White patients, all groups increased rate and use of AWVs during the implementation phase of the ACA (2011-2013). Both rates and use continued to increase for all groups except those with COM insurance post ACA, when zero copays had been firmly established.
The rates of increase in AWV use exposed 2 gaps: (1) the maximal AWV use achieved by White women with congenital disabilities and COM insurance was more than twice that of the lowest AWV use for COM-insured Black/Hispanic males with acquired disabilities, which was the same as that for all MA members; (2) the greatest AWV use for persons with disabilities was nearly 15% less than the 62% AWV use threshold seen in the general population.20
We do not understand the reasons why MA members with disabilities were successful in increasing their AWV use but then stopped short of closing the gap with COM members. Social determinants of health are likely to be one set of effectors of ability to uptake AWVs,7,22-25 where the development of 5 place-based domains of economic stability, education, health and health care, neighborhood/built environment, and social/community context most affect population health. Likewise, we do not understand why AWV use among COM members differed so much by sex and race. We did show that COM members were younger than MA members, and other work in the general population shows that younger people use preventive care 50% more than those aged >65 years.26 Other work has also shown that men in the general population with COM insurance are much less likely to get preventive health care than women when cost is not a barrier to care.27,28 Likewise, masculine norms among men aged <65 years prevent participation in preventive care,29 whereas among men aged >65 years, those most likely to have MA insurance seek similar preventive care as women.30 Our results show that among MA members, both men and women had similar AWV use throughout the ACA phases, perhaps indicating that cost barriers, while important, are only a part of the solution to increasing AWV use.
Race continued to be a part of the differences in AWV use over the study time span. As we described, only White women with congenital disabilities were able to decrease the gap between MA insurance and COM insurance to reach an AWV use that closed in on the use that COM members with disabilities experienced. Black and Hispanic patients with disability showed significantly lower AWV use across the ACA time frames. This has also been reported in the general population; compared to White patients, both Black and Hispanic patients had fewer preventive health care visits post ACA.31 It is unlikely that race itself drives the AWV use pattern; rather it could be some combination of the local social determinants of health experienced by each population of persons with disabilities.
Disabilities themselves should drive preventive care use, given that preventive care use is recommended to help prevent chronic diseases experienced by those with spina bifida,32,33 cerebral palsy,34-38 or spinal cord injuries.39-41 There are recommendations regarding control of hypertension, diabetes, and cholesterol to prevent second strokes42 but little regarding actual primary prevention of those risk factors for persons with paralyses. Again, whereas there are national organizational recommendations for preventive care,43-45 women with multiple sclerosis have been shown to have fewer annual primary care physician visits (61%)46 compared to the general population (84.3%).47
Study Strengths and Limitations
The present study has several strengths in leveraging large administrative claims from both COM and MA insurances. Our large, single-private-payer database maintains substantial market penetration throughout the United States, covering a large sample of physically disabled individuals from which we gained insight regarding the use of AWVs during the ACA time frame. A second strength of large administrative claims data sets is that sufficient enrollment in a plan allows for assessment of multiple calendar years and longitudinal follow-up or long cross-sections of time to assess service use. Finally, the use of a single, large, private payer controls for some between-payer variability in cost and coverage for services that might exist in other multipayer databases.
A limitation of administrative claims databases is that we could only document prevalence of AWV use by population strata as they were coded. Therefore, we could not obtain or infer reasons for AWV use, including whether zero copay was a priority, or disability severity itself. Because the single-private-payer database is not geographically representative, our results are not nationally generalizable within the United States. In addition, the subset of persons with disabilities studied are not generalizable to all persons with disabilities because persons with disabilities are also covered by Medicare fee for service or Medicaid.
CONCLUSIONS
Annual wellness visits provide an opportunity to assess broad health parameters for upcoming decision points in a person's health care. The decreasing rate of AWV use reversed at the inception of the ACA, with continued increased use for persons with physical disabilities. Gaps remain in AWV use between those with MA and COM insurance. In addition, gaps remain between AWV use among persons with disabilities and the general population.
Acknowledgments
We would like to acknowledge Dawn Russell for making group meeting arrangements.
Footnotes
Conflicts of interest: authors report none.
To read or post commentaries in response to this article, go to https://doi.org/10.1370/afm.2712.
Funding support: 90RTHF0001-02-00 (Meade) Administration for Community Living (NIDILRR) - Rehabilitation Research and Training Center (RRTC) on Promoting Healthy Aging for People with Long-Term Physical Disabilities; P30CA046592 NCI Comprehensive Cancer Center UL1TR001070 National Center for Advancing Translational Science.
Supplemental materials: Available at https://www.AnnFamMed.org/lookup/suppl/doi:10.1370/afm.2712/-/DC1.
- Received for publication July 15, 2020.
- Revision received January 21, 2021.
- Accepted for publication February 3, 2021.
- © 2021 Annals of Family Medicine, Inc.
References
In this issue


Jump to section
Related Articles
Cited By...
- No citing articles found.