
Article Figures & Data
Figures
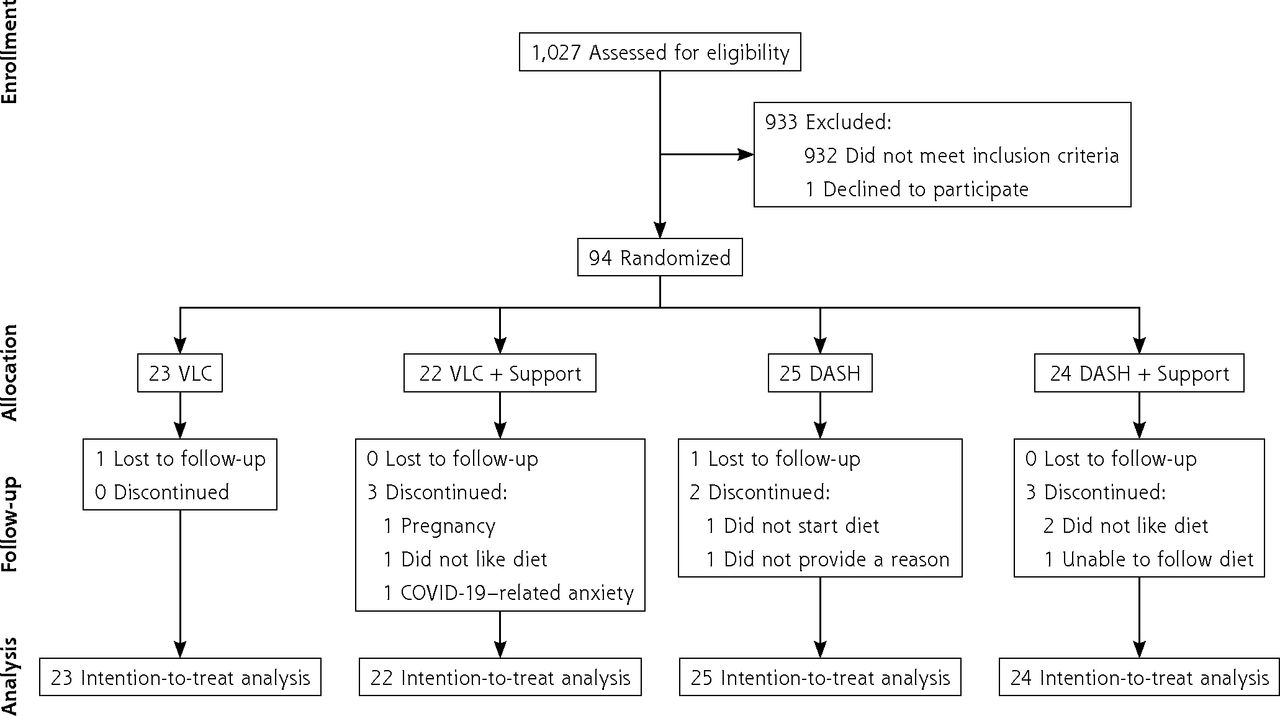
- Figure 1.
Participant CONSORT flow diagram.
CONSORT = Consolidated Standards of Reporting Trials; COVID-19 = coronavirus disease 2019; DASH = Dietary Approaches to Stop Hypertension; VLC = very low-carbohydrate.

Tables
Characteristic VLC VLC + Support DASH DASH + Support Sex, No. (%) Male 8 (34.78) 8 (36.36) 9 (36.00) 9 (37.50) Female 15 (65.22) 14 (63.64) 16 (64.00) 15 (62.50) Age, y 60.09 (6.03) 55.18 (10.48) 58.40 (8.11) 60.21 (6.19) Race/ethnicity, No. (%), can be >1 American Indian or Alaska Native 1 (4.35) 0 (0) 0 (0) 1 (4.17) Asian/Pacific Islander 0 (0) 0 (0) 0 (0) 3 (12.50) Black 4 (17.39) 4 (18.18) 6 (24.00) 5 (20.83) Latine 0 (0) 2 (9.09) 1 (4.00) 1 (4.17) White 19 (82.61) 18 (81.82) 19 (76.00) 15 (62.50) College graduate, No. (%) 20 (86.96) 17 (77.27) 20 (80.00) 17 (70.83) Married or long-term partner, No. (%) 21 (91.30) 17 (77.27) 20 (80.00) 18 (75.00) Total household income, No. (%) ≤$35,000 0 (0) 1 (4.55) 3 (12.00) 3 (12.50) $35,001-$75,000 6 (26.09) 8 (36.36) 4 (16.00) 8 (33.33) ≥$75,001 10 (43.48) 12 (54.55) 18 (72.00) 11 (45.83) Smoker, No. (%) 0 (0) 1 (4.55) 0 (0) 1 (4.17) SBP, mm Hg 132.53 (11.13) 133.76 (13.71) 133.13 (8.58) 131.58 (10.85) Diastolic BP, mm Hg 85.54 (9.54) 82.98 (9) 80.82 (8.2) 82.02 (8.24) Weight, lb 222.22 (40.53) 213.14 (31.64) 236.25 (49.61) 227.08 (42.77) BMI, kg/m2 35.10 (5.71) 35.50 (4.69) 37.34 (6.20) 35.78 (5.42) HbA1c, % 6.09 (0.45) 6.13 (0.56) 6.26 (0.55) 5.99 (0.42) BMI = body mass index; BP = blood pressure; DASH = Dietary Approaches to Stop Hypertension; HbA1c = glycated hemoglobin; SBP = systolic blood pressure; VLC = very low-carbohydrate.
Note: Data are presented as mean (SD) unless otherwise noted.
Outcome VLC Diet DASH Diet Difference
in Change
(VLC Lower)Between-
Group P
ValueBaseline Post Change Within-Group
P ValueBaseline Post Change Within-Group
P ValueSBP, mm Hg 133.72
(1.73)123.95
(1.88)−9.77
(1.66)<.001 132.84
(1.69)127.66
(1.80)−5.18
(1.59).002 −4.59 .046 HbA1c, % 6.09
(0.07)5.74
(0.08)−0.35
(0.07)<.001 6.10
(0.07)5.97
(0.07)−0.14
(0.07).06 −0.21 .034 Weight, lb 219.24
(5.39)200.10
(5.41)−19.14
(1.73)<.001 236.43
(5.1)226.1
(5.2)−10.34
(1.73)<.001 −8.81 .0003 DASH = Dietary Approaches to Stop Hypertension; HbA1c = glycated hemoglobin; SBP = systolic blood pressure; VLC = very low-carbohydrate.
Note: Outcomes were analyzed using a linear mixed model including all possible interactions between diet, support, and time and adjusted for age and sex. Results are presented collapsed over all other factors: support allocation, sex, and at the mean value of age. The between-group P value is calculated from a Z-test based on the estimated mean changes and the associated SE values reported in the table.
Parameter Systolic BP HbA1c Weight β Coefficient (SE) P Value β Coefficient (SE) P Value β Coefficient (SE) P Value Intercept 126.11 (9.23) <.001 5.86 (0.37) <.001 360.15 (29.96) <.001 Baseline (vs follow-up) 8.17 (2.23) <.001 0.16 (0.10) .12 12.55 (2.53) <.001 VLC (vs DASH) diet 1.99 (3.80) .60 −0.10 (0.15) .52 −31.91 (10.76) <.001 No support (vs support) 7.43 (3.53) .04 0.31 (0.14) .03 10.19 (10.20) .32 Time × diet 0.22 (3.35) .95 0.23 (0.15) .13 7.64 (3.58) .04 Time × support −5.97 (3.19) .07 −0.05 (0.14) .71 −4.43 (3.45) .20 Diet × support −11.40 (5.17) .03 −0.26 (0.21) .22 11.84 (14.99) .43 Time × diet × support 8.73 (4.60) .06 −0.04 (0.20) .85 2.34 (4.89) .63 Female (vs male) −3.86 (2.26) .09 0.15 (0.09) .09 −28.50 (7.51) <.001 Age, y −0.004 (0.14) .98 −0.002 (0.01) .69 −2.12 (0.47) <.001 BP = blood pressure; DASH = Dietary Approaches to Stop Hypertension; HbA1c = glycated hemoglobin; VLC = very low-carbohydrate.
- Table 4.
Estimated Mean (SE) of Outcomes Across Support Groups and Time From Linear Mixed Model
Outcome Extra Support No Extra Support Difference
in Change
(Extra Lower)Between-
Group P
ValueBaseline Post Change Within-Group
P ValueBaseline Post Change Within-Group
P ValueSBP, mm Hg 133.22
(1.74)124.94
(1.90)−8.28
(1.68)<.001 133.35
(1.67)126.67
(1.78)−6.68
(1.57)<.001 −1.60 .49 HbA1c, % 6.04
(0.07)5.76
(0.08)−0.28
(0.08)<.001 6.15
(0.07)5.94
(0.07)−0.21
(0.07).004 −0.07 .51 Weight, lb 221.41
(5.31)205.04
(5.36)−16.37
(1.79)<.001 234.26
(5.22)221.15
(5.24)−13.11
(1.66)<.001 −3.26 .18 HbA1c = glycated hemoglobin; SBP = systolic blood pressure.
Note: Outcomes were analyzed using a linear mixed model including all possible interactions between diet, support, and time and adjusted for age and sex. Results are presented collapsed over all other factors: diet, sex, and at the mean value of age. The between-group P value is calculated from a Z test based on the estimated mean changes and the associated SE values reported in the table.
Outcome n/N (%) VLC VLC + Support DASH DASH + Support BP drugs (n = 72) Discontinued or decreased 5/16 (31.3) 7/16 (43.8) 3/23 (13.0) 1/19 (5.3) No change 8/16 (50.0) 6/16 (37.5) 15/23 (65.2) 12/19 (63.2) Increased 2/16 (12.5) 1/16 (6.3) 2/23 (8.7) NA Missing 1/16 (6.3) 2/16 (12.5) 3/23 (13.0) 6/19 (31.6) Blood glucose drugs (n = 24) Discontinued or decreased 2/5 (40.0) 3/4 (75.0) NA NA No change 2/5 (40.0) NA 8/10 (80.0) 3/6 (50.0) Increased NA NA 2/10 (20.0) NA Missing 1/5 (20.0) 1/4 (25.0) NA 3/6 (50.0) BP = blood pressure; DASH = Dietary Approaches to Stop Hypertension; NA = not applicable; VLC = very low-carbohydrate.
Note: NA indicates no participants in the category.
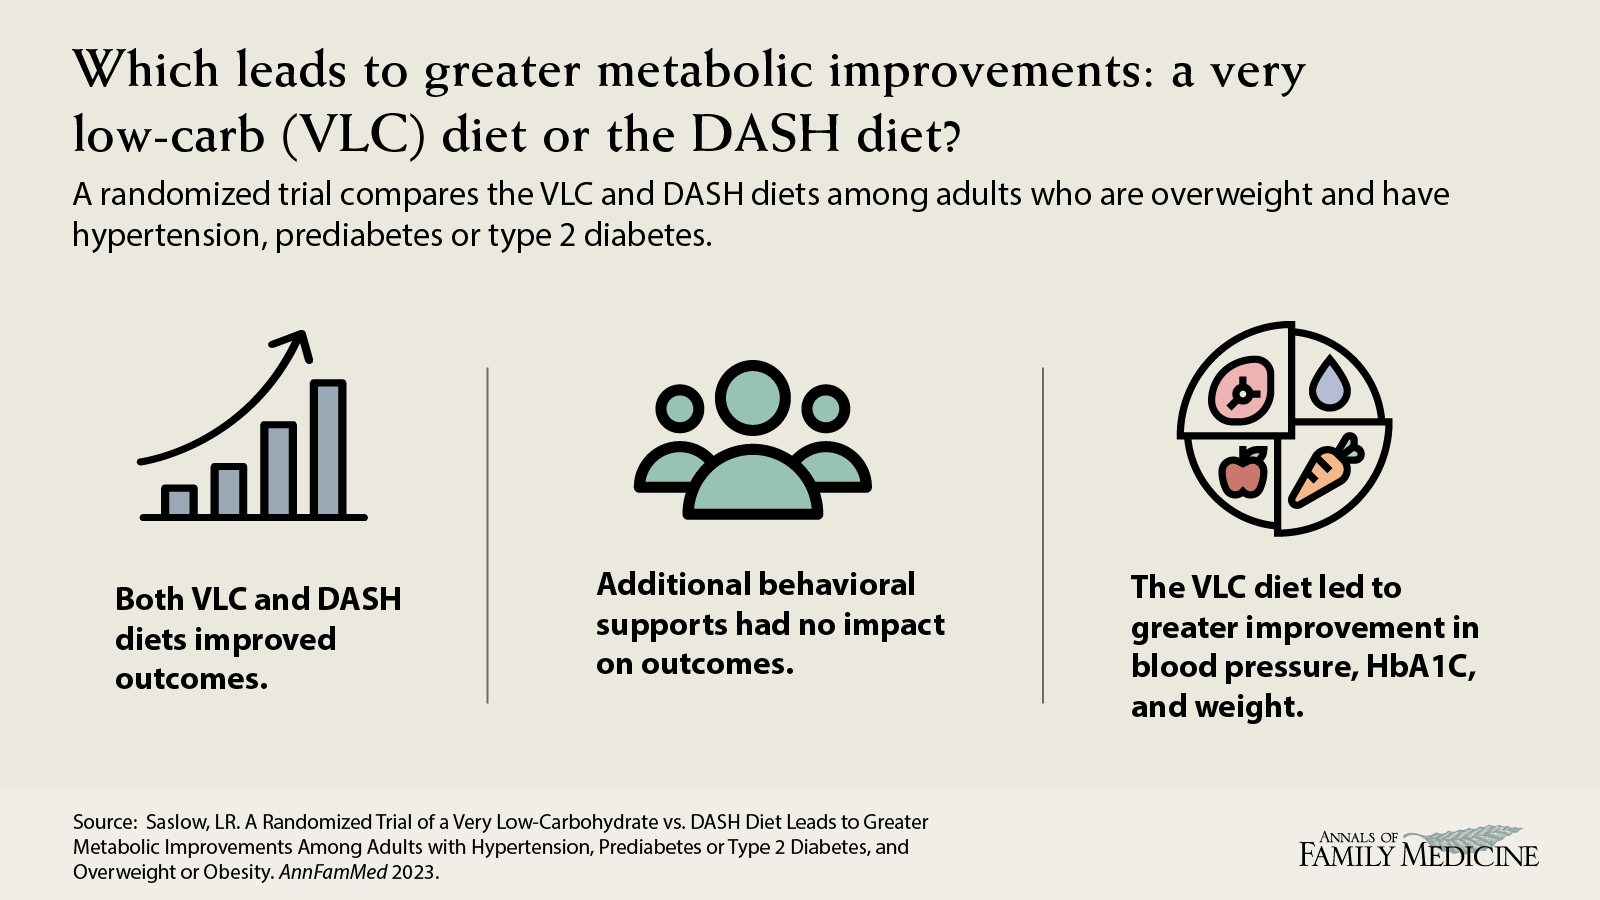
VISUAL ABSTRACT IN PFG FILE BELOW
- 21.3_saslow_v04.png -
PNG file
- 21.3_saslow_v04.png -


