
Article Figures & Data
Tables
Qualitative Interview Participants No. (%) Sampling Frame No. (%) Total 22 413 Years in practice <5 1 (4.5) 6 (1.5) 5-10 2 (9.1) 82 (19.9) 11-20 7 (31.8) 182 (44.1) 21-29 7 (31.8) 89 (21.5) >30 5 (22.7) 54 (13.1) Race American Indian or Alaska Native 0 (0) 3 (0.7) Asian 1 (4.5) 95 (23.0) Black or African American 5 (22.7) 82 (19.9) Other 4 (18.2) 50 (12.1) White 12 (54.5) 183 (44.3) Ethnicity Hispanic or Latine 5 (22.7) 96 (23.2) Non-Hispanic 17 (77.3) 317 (76.8) Regiona Midwest 4 (18.2) 80 (19.5) Northeast 2 (9.1) 70 (17.1) South 10 (45.5) 152 (37.1) West 6 (27.3) 108 (26.3) Principal practice size 2-5 physicians 8 (36.4) 155 (37.5) Solo practice 14 (63.6) 258 (62.5) Care in other language No 9 (40.9) 121 (29.3) Yes, other 3 (13.6) 130 (31.5) Yes, Spanish 10 (45.5) 162 (39.2) ↵a Three individuals in the sampling frame practiced in a US territory. They are not included in the Region counts.
Additional Files
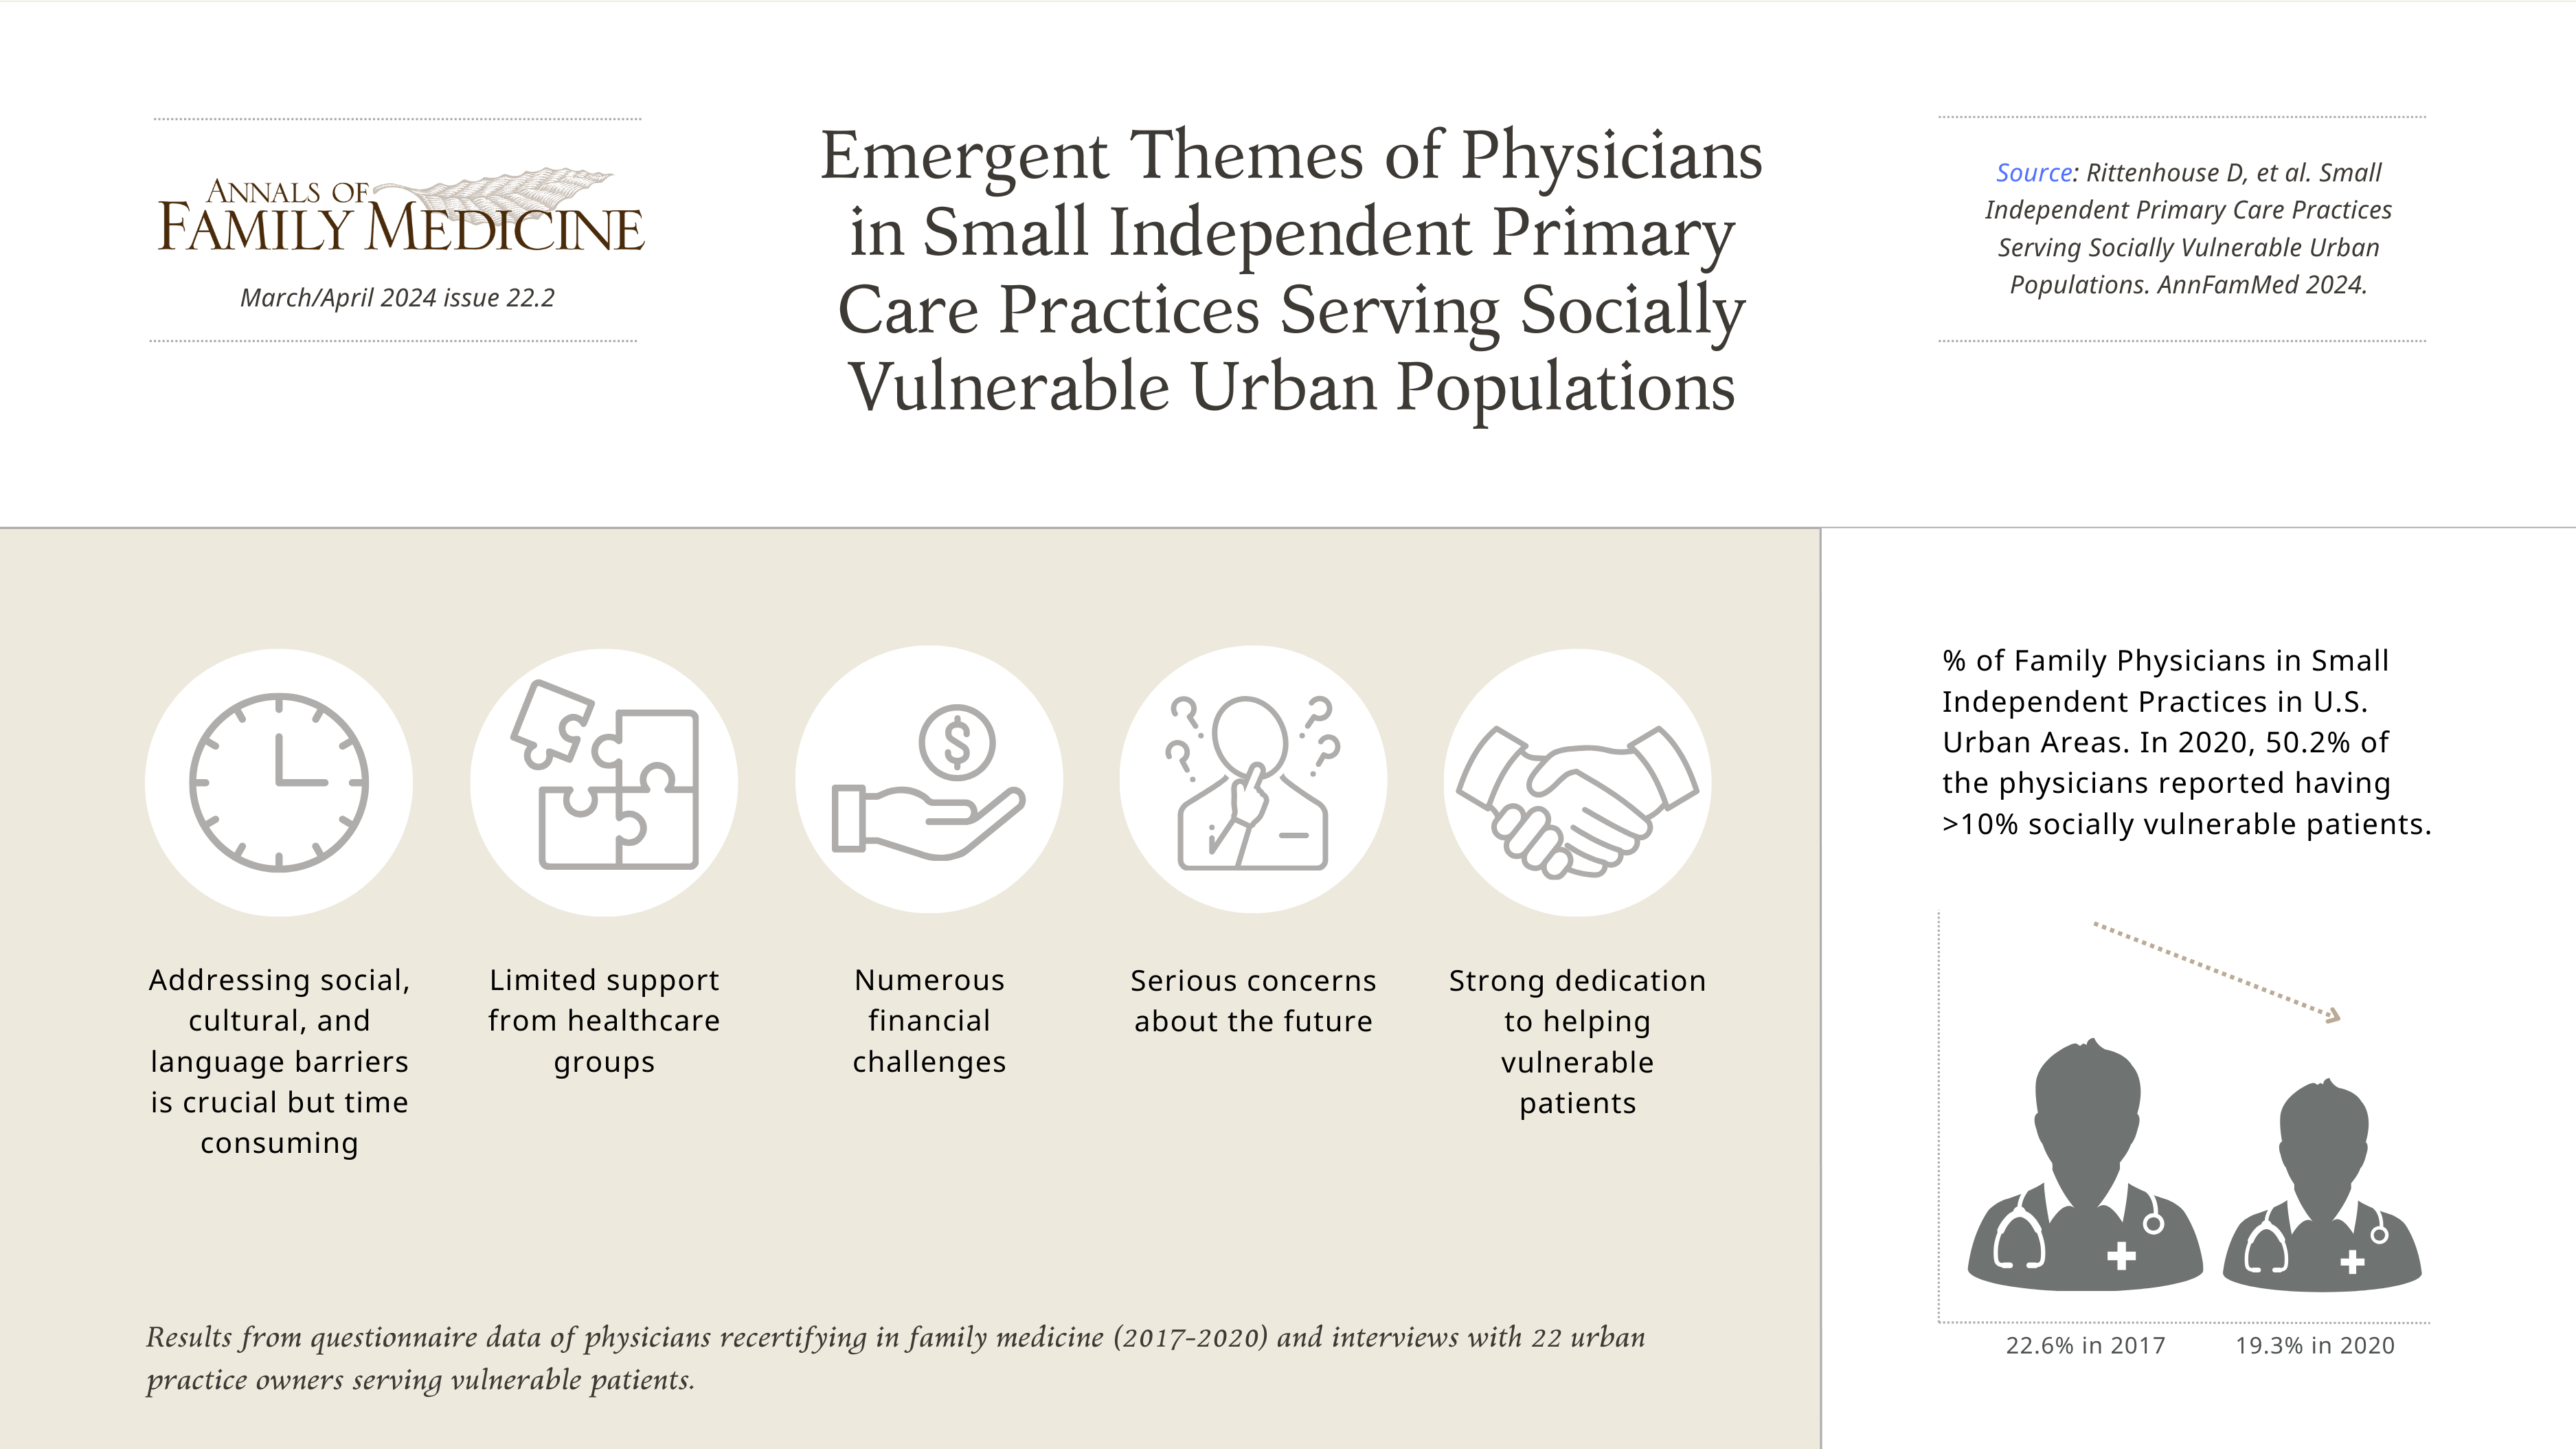
VISUAL ABSTRACT IN PNG FILE BELOW
- Rittenhouse.png -
PNG file
- Rittenhouse.png -
In this issue


Jump to section
Related Articles
Cited By...
- No citing articles found.