
Main menu

  • Home
  • Current Issue
  • Content
    • Current Issue
    • Early Access
    • Multimedia
    • Podcast
    • Collections
    • Past Issues
    • Articles by Subject
    • Articles by Type
    • Supplements
    • Plain Language Summaries
    • Calls for Papers
  • Info for
    • Authors
    • Reviewers
    • Job Seekers
    • Media
  • About
    • Annals of Family Medicine
    • Editorial Staff & Boards
    • Sponsoring Organizations
    • Copyrights & Permissions
    • Announcements
  • Engage
    • Engage
    • e-Letters (Comments)
    • Subscribe
    • Podcast
    • E-mail Alerts
    • Journal Club
    • RSS
    • Annals Forum (Archive)
  • Contact
    • Contact Us
  • Careers

User menu

  • My alerts

Search

  • Advanced search
Annals of Family Medicine
  • My alerts
Annals of Family Medicine

Advanced Search

  • Home
  • Current Issue
  • Content
    • Current Issue
    • Early Access
    • Multimedia
    • Podcast
    • Collections
    • Past Issues
    • Articles by Subject
    • Articles by Type
    • Supplements
    • Plain Language Summaries
    • Calls for Papers
  • Info for
    • Authors
    • Reviewers
    • Job Seekers
    • Media
  • About
    • Annals of Family Medicine
    • Editorial Staff & Boards
    • Sponsoring Organizations
    • Copyrights & Permissions
    • Announcements
  • Engage
    • Engage
    • e-Letters (Comments)
    • Subscribe
    • Podcast
    • E-mail Alerts
    • Journal Club
    • RSS
    • Annals Forum (Archive)
  • Contact
    • Contact Us
  • Careers
  • Follow annalsfm on Twitter
  • Visit annalsfm on Facebook
Research ArticleOriginal Research

The Impact of Primary Care Clinic and Family Physician Continuity on Patient Health Outcomes: A Retrospective Analysis From Alberta, Canada

Terrence McDonald, Paul E. Ronksley, Lisa L. Cook, Alka B. Patel, Judy Seidel, Brendan Cord Lethebe and Lee A. Green
The Annals of Family Medicine May 2024, 22 (3) 223-229; DOI: https://doi.org/10.1370/afm.3107
Terrence McDonald
1University of Calgary, Department of Family Medicine, Calgary, Alberta, Canada
2University of Calgary, Department of Community Health Sciences, Calgary, Alberta, Canada
MD, MSc
  • Find this author on Google Scholar
  • Find this author on PubMed
  • Search for this author on this site
  • For correspondence: Terrence.McDonald@ucalgary.ca
Paul E. Ronksley
2University of Calgary, Department of Community Health Sciences, Calgary, Alberta, Canada
PhD
  • Find this author on Google Scholar
  • Find this author on PubMed
  • Search for this author on this site
Lisa L. Cook
3Faculty of Health Sciences, University of Lethbridge, Lethbridge, Alberta, Canada
4Alberta Health Services, Calgary, Alberta, Canada
PhD
  • Find this author on Google Scholar
  • Find this author on PubMed
  • Search for this author on this site
Alka B. Patel
2University of Calgary, Department of Community Health Sciences, Calgary, Alberta, Canada
4Alberta Health Services, Calgary, Alberta, Canada
PhD
  • Find this author on Google Scholar
  • Find this author on PubMed
  • Search for this author on this site
Judy Seidel
2University of Calgary, Department of Community Health Sciences, Calgary, Alberta, Canada
4Alberta Health Services, Calgary, Alberta, Canada
PhD
  • Find this author on Google Scholar
  • Find this author on PubMed
  • Search for this author on this site
Brendan Cord Lethebe
5University of Calgary, Clinical Research Unit, Cumming School of Medicine, Calgary, Alberta, Canada
MSc
  • Find this author on Google Scholar
  • Find this author on PubMed
  • Search for this author on this site
Lee A. Green
2University of Calgary, Department of Community Health Sciences, Calgary, Alberta, Canada
7University of Michigan, Institute for Healthcare Policy and Innovation, Ann Arbor, Michigan
MD, MPH
  • Find this author on Google Scholar
  • Find this author on PubMed
  • Search for this author on this site
  • Article
  • Figures & Data
  • eLetters
  • Info & Metrics
  • PDF
Loading

Article Figures & Data

Tables

  • Additional Files
    • View popup
    Table 1.

    Patient Characteristics Overall and by Physician Continuity

    CharacteristicOverall (N = 1,200,000)Physician ContinuityaP Value
    Low (n = 77,870)Moderate (n = 547,680)High (n = 574,450)
    Gender, No. (%)
        Female669,046 (55.8)46,757 (60.0)315,585 (57.6)306,704 (53.4)<.001
        Male530,954 (44.2)31,113 (40.0)232,095 (42.4)267,746 (46.6)<.001
    Age, median (IQR), y            50 (30-65)          35 (25-50)            45 (25-60)            55 (35-70)<.001
    Complexity level,b No. (%)<.001
        1-2732,890 (61.1)54,310 (69.7)353,939 (64.6)324,641 (56.5)
        2-3200,003 (16.7)11,935 (15.3)89,671 (16.4)98,397 (17.1)
        5-9267,107 (22.3)11,625 (14.9)104,070 (19.0)151,412 (26.4)
    Geographic zone, No. (%)<.001
        1 (South)94,052 (7.8)3,655 (4.7)35,198 (6.4)55,199 (9.6)
        2 (Calgary and area)468,776 (39.1)33,598 (43.1)227,555 (41.5)207,623 (36.1)
        3 (Central)128,221 (10.7)12,788 (16.4)60,457 (11.0)54,976 (9.6)
        4 (Edmonton)410,881 (34.2)22,812 (29.3)184,383 (33.7)203,686 (35.5)
        5 (North)98,070 (8.2)5,017 (6.4)40,087 (7.3)52,966 (9.2)
    Location, No. (%)
        Metro841,715 (70.1)53,855 (69.2)394,632 (72.1)393,228 (68.5)
        Rural211,445 (17.6)13,261 (17.0)90,496 (16.5)107,688 (18.7)
        Urban146,840 (12.2)10,754 (13.8)62,552 (11.4)73,534 (12.8)
    Physician continuity,a No. (%)
        Low77,870 (6.5)77,870 (100.0)0 (0.0)0 (0.0)<.001
        Moderate547,680 (45.6)0 (0.0)547,680 (100.0)0 (0.0)<.001
        High574,450 (47.9)0 (0.0)0 (0.0)574,450 (100.0)<.001
    GCR, mean (SD), %42 (41)53 (31)41 (40)41 (45)<.001
    Clinic continuity,c No. (%)
        None350,180 (29.2)5,944 (7.6)194,120 (35.4)150,116 (26.1)<.001
        NA247,403 (20.6)0 (0.0)0 (0.0)247,403 (43.1)<.001
        Low167,033 (13.9)28,322 (36.4)112,401 (20.5)26,310 (4.6)<.001
        High190,633 (15.9)31,577 (40.6)123,284 (22.5)35,772 (6.2)
        Complete244,751 (20.4)12,027 (15.4)117,875 (21.5)114,849 (20.0)
    Total visits/patient in study period, mean (SD)            14.0 (12.7)            13.4 (11.5)            13.7 (12.1)            14.4 (13.3)<.001
    Physician patient volume per day,d mean (SD)            29.4 (13.8)            27.8 (12.5)            28.5 (13.5)            30.5 (14.3)<.001
    ED visits during study period
        Number/patient, mean (SD)            2.3 (4.5)            2.8 (5.2)            2.4 (4.6)            2.1 (4.4)<.001
        Patients with none, No. (%)462,781 (38.6)25,423 (32.6)200,998 (36.7)236,360 (41.1)<.001
        Number/patient among those with ≥1, mean (SD)            3.7 (5.3)            4.2 (5.9)            3.7 (5.3)            3.6 (5.3)<.001
    Hospitalizations during study period
        Number/patient, mean (SD)            0.3 (0.8)            0.3 (0.8)            0.3 (0.8)            0.3 (0.8).02
        Patients with none, No. (%)974,793 (81.2)62,689 (80.5)443,307 (80.9)468,797 (81.6)<.001
    • ED = emergency department; CRG = clinical risk grouper; GCR = group care rate; IQR = interquartile range; KPC = known provider of care; NA = not applicable; UPC = usual provider of care.

    • ↵a Based on KPC index. Low = 0%-40% of visits were to the attached family physician; moderate = 41%-80% of visits; high = 81%-100% of visits.

    • ↵b Based on CGR.

    • ↵c Based on GCR. None = 0% (always went elsewhere if not seeing their FP); NA = always saw their own FP (KPC index of 100% with no opportunity for group care); low = 1%-50%; high = 51%-99%; complete = 100% (always saw one of their FP’s partners if not their own FP).

    • ↵d For the physician associated with the patient.

    • View popup
    Table 2.

    Patient Characteristics by Clinic Continuity

    CharacteristicClinic ContinuityaP Value
    NoneNALowHighComplete
    Patients, No. (%)350,180 (29.2)247,403 (20.6)167,033 (13.9)190,633 (15.9)244,751 (20.4)
    Age, median (IQR), y          45 (30-60)          55 (35-65)          45 (30-60)          45 (30-60)          50 (30-65)<.001
    Sex, No. (%)
        Male152,080 (43.4)124,704 (50.4)62,516 (37.4)78,314 (41.1)113,340 (46.3)<.001
        Female198,100 (56.6)122,699 (49.6)104,517 (62.6)112,319 (58.9)131,411 (53.7)
    Complexity level,b No. (%)<.001
        1-2221,631 (63.3)159,360 (64.4)88,637 (53.1)113,142 (59.4)150,120 (61.3)
        3-459,613 (17.0)35,793 (14.5)33,753 (20.2)33,368 (17.5)37,476 (15.3)
        5-968,936 (19.7)52,250 (21.1)44,643 (26.7)44,123 (23.1)57,155 (23.4)
    Geographic zone, No. (%)…
        1 (South)21,586 (6.2)25,355 (10.2)10,366 (6.2)13,606 (7.1)23,139 (9.5)
        2 (Calgary and area)154,541 (44.1)83,350 (33.7)76,004 (45.5)76,540 (40.2)78,341 (32.0)
        3 (Central)26,995 (7.7)23,805 (9.6)19,041 (11.4)24,525 (12.9)33,855 (13.8)
        4 (Edmonton)119,370 (34.1)89,076 (36.0)53,328 (31.9)63,725 (33.4)85,382 (34.9)
        5 (North)27,688 (7.9)25,817 (10.4)8,294 (5.0)12,237 (6.4)24,034 (9.8)
    Location…
        Metro265,873 (75.9)164,938 (66.7)124,912 (74.8)133,617 (70.1)152,375 (62.3)
        Urban42,142 (12.0)34,370 (13.9)17,285 (10.3)23,466 (12.3)29,577 (12.1)
        Rural42,165 (12.0)48,095 (19.4)24,836 (14.9)33,550 (17.6)62,799 (25.7)
    Physician continuity,c No. (%)<.001
        Low5,944 (1.7)0 (0.0)28,322 (17.0)31,577 (16.6)12,027 (4.9)
        Moderate194,120 (55.4)0 (0.0)112,401 (67.3)123,284 (64.7)117,875 (48.2)
        High150,116 (42.9)247,403 (100.0)26,310 (15.8)35,772 (18.8)114,849 (46.9)
    Total visits/patient, mean (SD)13.5 (11.5)10.2 (8.5)20.2 (17.1)16.1 (14.4)12.7 (10.8)<.001
    Physician patient volume/day,d median (IQR)27.2
    (20.4-37.5)
    27.5
    (20.9-38.0)
    25.7
    (19.4-34.6)
    25.2
    (19.1-34.3)
    25.1
    (19.1-34.2)
    <.001
    ED visits during study period
        Number/patient, mean (SD)2.2 (4.3)1.5 (3.2)3.3 (6.0)2.7 (5.3)2.0 (4.1)<.001
        Patients with none, No. (%)128,849 (36.8)122,561 (49.5)46,630 (27.9)62,078 (32.6)102,663 (41.9)<.001
        Number/patient among those with ≥1, mean (SD)3.6 (4.9)3.0 (3.9)4.6 (6.6)4.0 (6.0)3.5 (4.8)<.001
    Hospitalizations during study period
        Number/patient, mean (SD)0.3 (0.8)0.2 (0.6)0.5 (1.1)0.3 (0.9)0.2 (0.7)<.001
        Patients with none, No. (%)282,855 (80.8)213,299 (86.2)123,288 (73.8)149,748 (78.6)205,603 (84.0)<.001
        Number/patient among those with ≥1, mean (SD)1.5 (1.2)1.4 (1.0)1.7 (1.6)1.6 (1.4)1.5 (1.0)<.001
    • ED = emergency department; CRG = clinical risk grouper; FP = family physician; GCR = group care rate; IQR = interquartile range; KPC = known provider of care; NA = not applicable.

    • Note: See Table 1 footnotes for category definitions.

    • ↵a Based on GCR.

    • ↵b Based on CRG.

    • ↵c Based on KPC index.

    • ↵d For the physician associated with the patient.

    • View popup
    Table 3.

    Associations of Physician Continuity and Clinic Continuity With ED and Hospital Use, by Patient Complexitya

    CharacteristicED Visits, Incidence Rate Ratio (95% CI)Hospitalizations, Incidence Rate Ratio (95% CI)
    Low ComplexityModerate ComplexityHigh ComplexityLow ComplexityModerate ComplexityHigh Complexity
    Physician continuityb1.00 (1.00-1.00)1.00 (1.00-1.00)1.00 (1.00-1.00)1.00 (1.00-1.00)1.00 (1.00-1.00)1.00 (1.00-1.00)
    Clinic continuityc
        NA0.81 (0.80-0.81)0.79 (0.78-0.81)0.68 (0.67-0.70)0.77 (0.75-0.78)0.67 (0.66-0.68)0.78 (0.76-0.79)
        NoneRefRefRefRefRefRef
        Low1.04 (1.03-1.06)1.05 (1.04-1.07)1.04 (1.02-1.06)1.12 (1.10-1.14)1.11 (1.07-1.15)1.10 (1.08-1.13)
        High0.94 (0.93-0.95)0.97 (0.95-0.99)0.94 (0.92-0.95)0.97 (0.95-0.98)1.02 (0.99-1.06)0.97 (0.95-0.99)
        Complete0.79 (0.78-0.80)0.81 (0.80-0.83)0.72 (0.71-0.73)0.77 (0.75-0.78)0.83 (0.80-0.86)0.69 (0.67-0.70)
    Sex, male1.10 (1.09-1.11)0.98 (0.97-1.00)1.07 (1.06-1.08)0.86 (0.84-0.89)1.01 (1.01-1.01)1.03 (1.01-1.05)
    Age, per 5 years0.98 (0.98-0.98)1.00 (0.99-1.00)1.00 (1.00-1.00)0.93 (0.93-0.93)1.01 (1.03-1.14)1.03 (1.03-1.04)
    Total visits, per visit1.05 (1.05-1.05)1.03 (1.03-1.03)1.02 (1.02-1.02)1.05 (1.05-1.05)1.02 (1.02-1.02)1.02 (1.02-1.02)
    Physician visit volume, per patient/day1.00 (1.00-1.00)1.00 (1.00-1.00)1.00 (1.00-1.00)1.00 (1.00-1.00)1.00 (1.00-1.00)1.00 (1.00-1.00)
    Location
        MetroRefRefRefRefRefRef
        Urban1.41 (1.39-1.42)1.44 (1.42-1.47)1.28 (1.26-1.30)1.41 (1.38-1.43)1.36 (1.31-1.40)1.35 (1.32-1.38)
        Rural2.68 (2.66-2.70)2.46 (2.42-2.50)2.33 (2.30-2.36)1.76 (1.73-1.78)1.65 (1.60-1.69)1.74 (1.70-1.77)
    • CRG = clinical risk grouper; ED = emergency department; FP = family physician; GCR = group care rate; KPC = known provider of care; NA = not applicable; Ref = reference group.

    • Note: Adjusted for sex, age, visits in study period, average physician patient volume per day, and location.

    • ↵a Based on CRG. Low = 1-2; moderate = 3-4; high = 5-9.

    • ↵b Per 1% increase in KPC index.

    • ↵c Based on GCR; see Table 1 footnotes for category definitions.

Additional Files

  • Tables
  • SUPPLEMENTAL MATERIALS IN PDF FILE BELOW

    • McDonaldSupp.pdf -

      PDF FILE

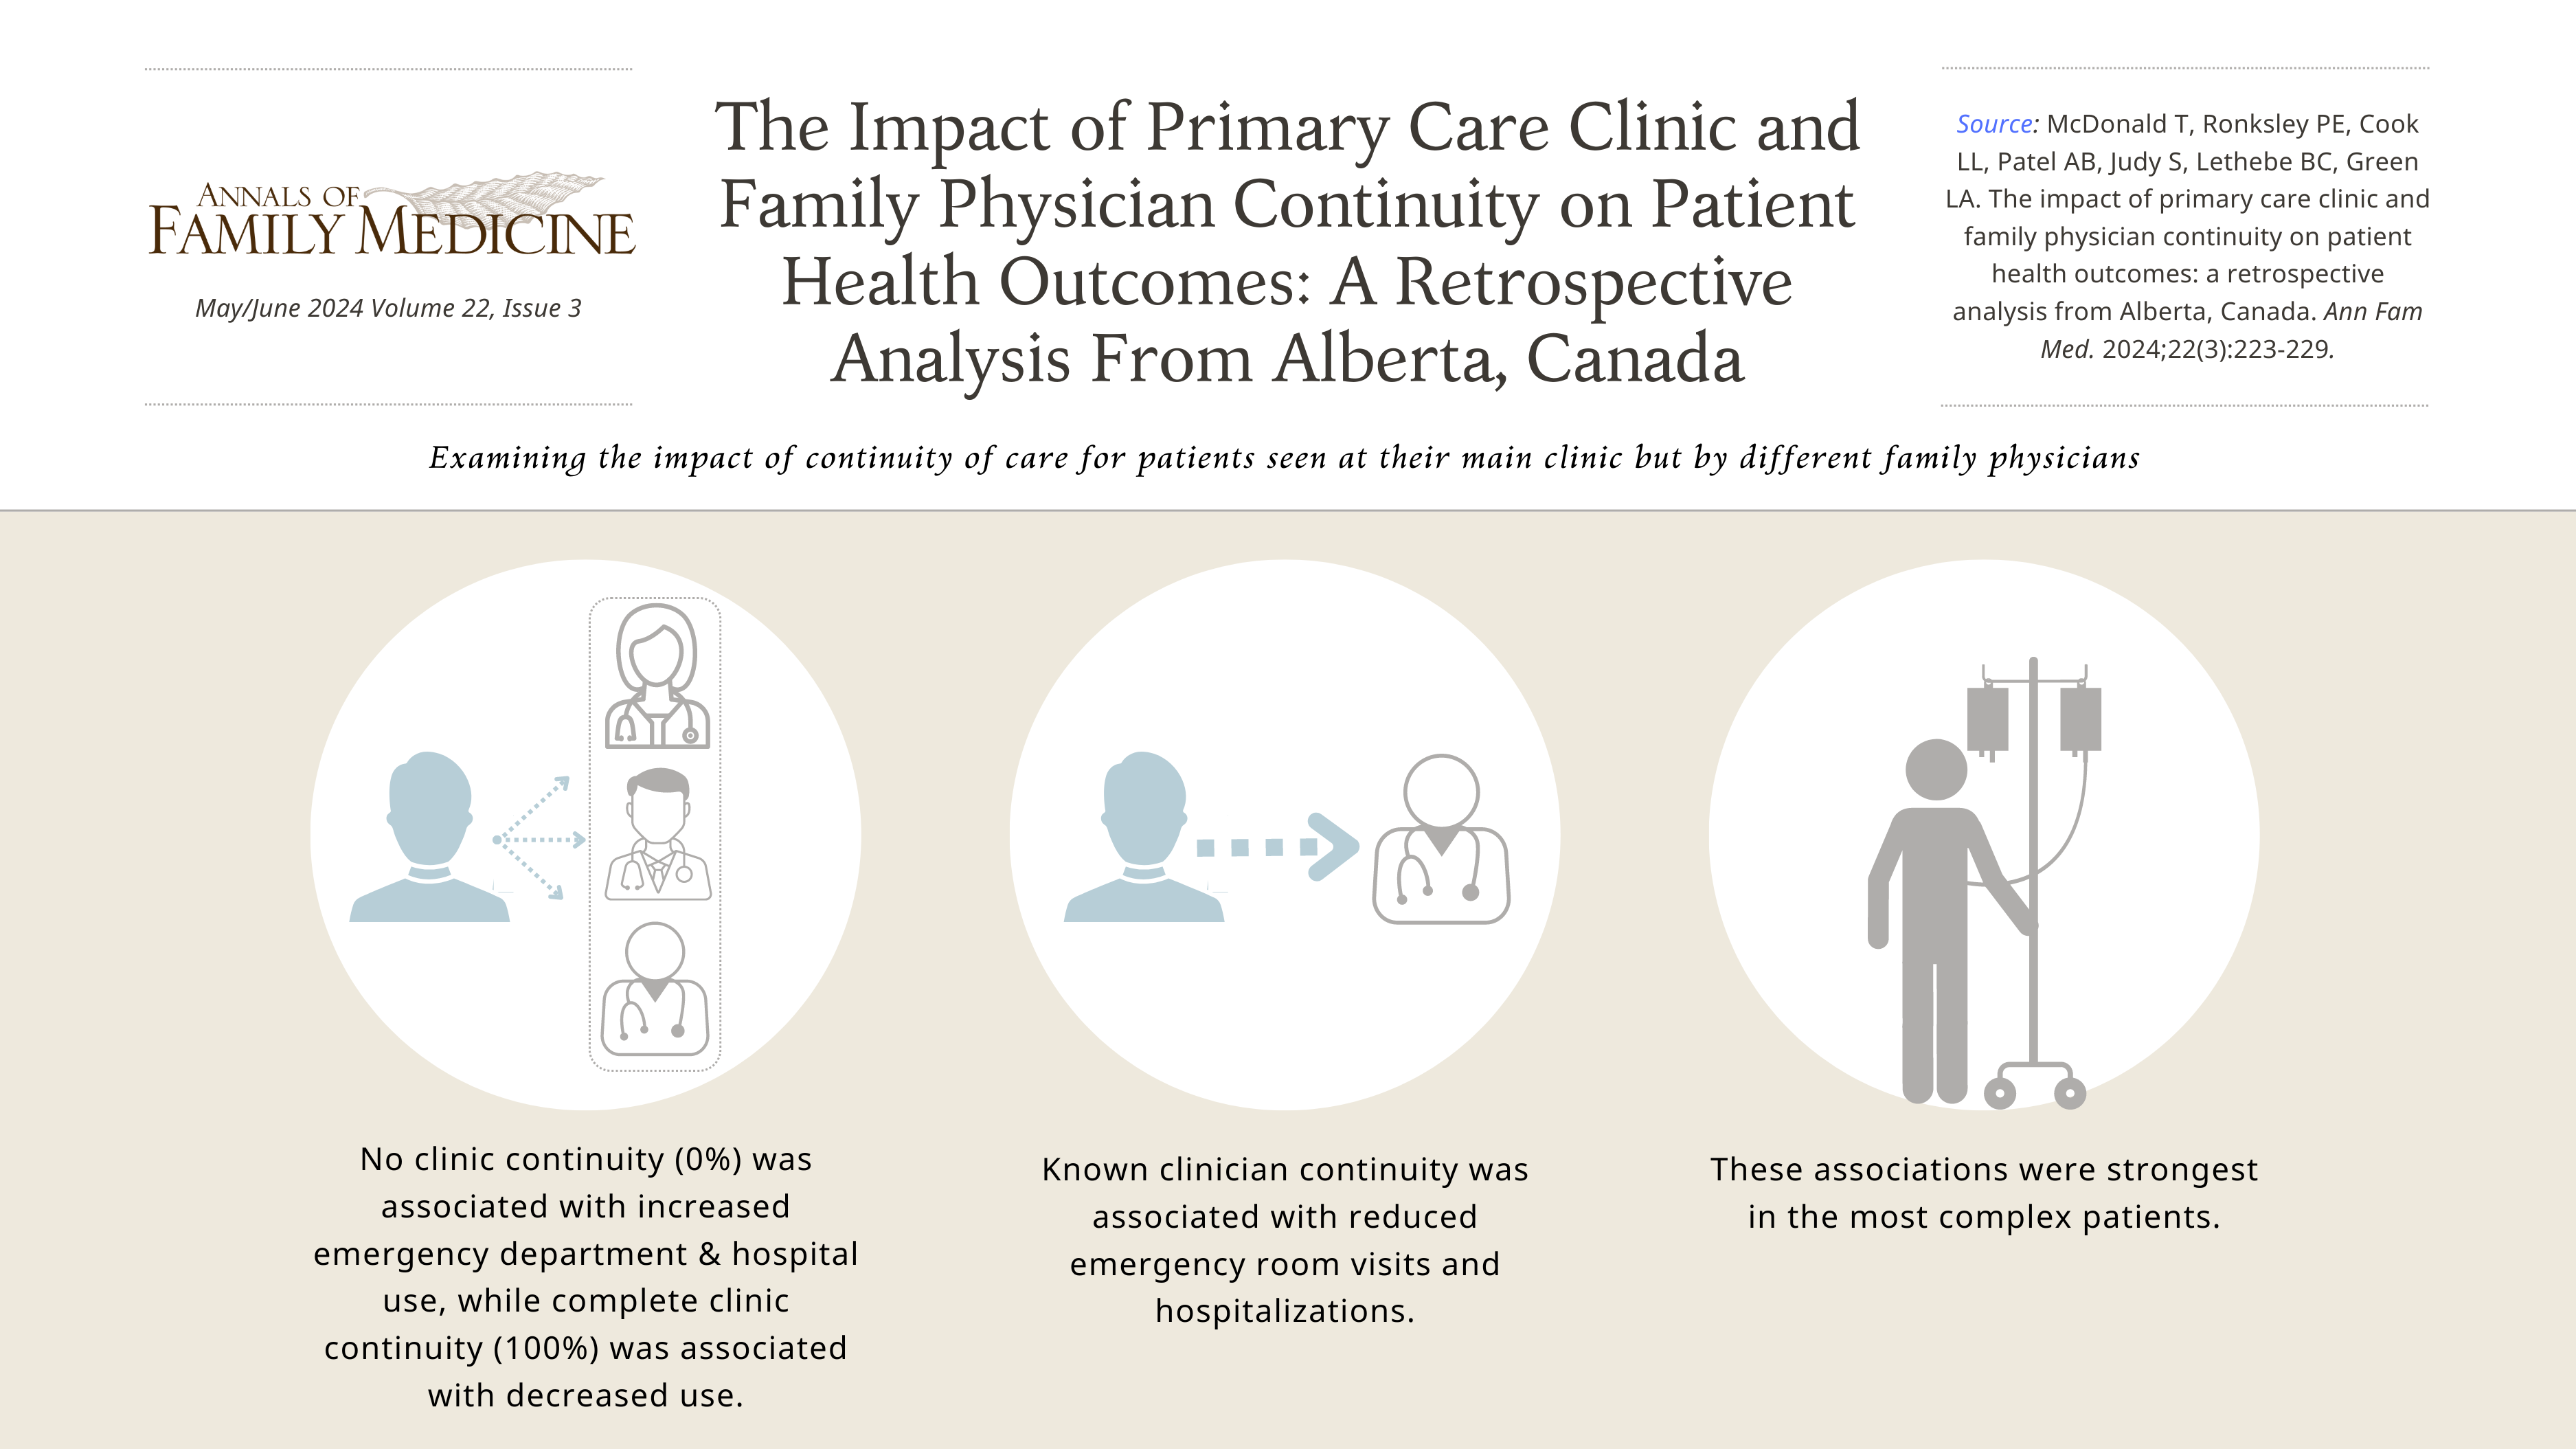
  • VISUAL ABSTRACT IN PNG FILE BELOW

    • McDonald_Final_Visual_Abstract.png -

      PNG FILE

PreviousNext
Back to top

In this issue

The Annals of Family Medicine: 22 (3)
Vol. 22, Issue 3
May/June 2024
  • Table of Contents
  • Index by author
  • Front Matter (PDF)
  • Plain-Language Summaries
Print
Download PDF
Article Alerts
Sign In to Email Alerts with your Email Address
Email Article

Thank you for your interest in spreading the word on Annals of Family Medicine.

NOTE: We only request your email address so that the person you are recommending the page to knows that you wanted them to see it, and that it is not junk mail. We do not capture any email address.

Enter multiple addresses on separate lines or separate them with commas.
The Impact of Primary Care Clinic and Family Physician Continuity on Patient Health Outcomes: A Retrospective Analysis From Alberta, Canada
(Your Name) has sent you a message from Annals of Family Medicine
(Your Name) thought you would like to see the Annals of Family Medicine web site.
CAPTCHA
This question is for testing whether or not you are a human visitor and to prevent automated spam submissions.
2 + 8 =
Solve this simple math problem and enter the result. E.g. for 1+3, enter 4.
Citation Tools
The Impact of Primary Care Clinic and Family Physician Continuity on Patient Health Outcomes: A Retrospective Analysis From Alberta, Canada
Terrence McDonald, Paul E. Ronksley, Lisa L. Cook, Alka B. Patel, Judy Seidel, Brendan Cord Lethebe, Lee A. Green
The Annals of Family Medicine May 2024, 22 (3) 223-229; DOI: 10.1370/afm.3107

Citation Manager Formats

  • BibTeX
  • Bookends
  • EasyBib
  • EndNote (tagged)
  • EndNote 8 (xml)
  • Medlars
  • Mendeley
  • Papers
  • RefWorks Tagged
  • Ref Manager
  • RIS
  • Zotero
Get Permissions
Share
The Impact of Primary Care Clinic and Family Physician Continuity on Patient Health Outcomes: A Retrospective Analysis From Alberta, Canada
Terrence McDonald, Paul E. Ronksley, Lisa L. Cook, Alka B. Patel, Judy Seidel, Brendan Cord Lethebe, Lee A. Green
The Annals of Family Medicine May 2024, 22 (3) 223-229; DOI: 10.1370/afm.3107
Twitter logo Facebook logo Mendeley logo
  • Tweet Widget
  • Facebook Like
  • Google Plus One

Jump to section

  • Article
    • Abstract
    • INTRODUCTION
    • METHODS
    • RESULTS
    • DISCUSSION
    • Footnotes
    • References
  • Figures & Data
  • eLetters
  • Info & Metrics
  • PDF

Related Articles

  • PubMed
  • Google Scholar

Cited By...

  • Convenience or Continuity: When Are Patients Willing to Wait to See Their Own Doctor?
  • Impact of changes in primary care attachment: a scoping review
  • Health Care Utilization After a Visit to a Within-Group Family Physician vs a Walk-In Clinic Physician
  • Of care continuity and brick walls
  • A propos de la continuite des soins et des murs de briques
  • Google Scholar

More in this TOC Section

  • Proactive Deprescribing Among Older Adults With Polypharmacy: Barriers and Enablers
  • Artificial Intelligence Tools for Preconception Cardiomyopathy Screening Among Women of Reproductive Age
  • Family Physicians in Focused Practice in Ontario, Canada: A Population-Level Study of Trends From 1993/1994 Through 2021/2022
Show more Original Research

Similar Articles

Subjects

  • Person groups:
    • Community / population health
  • Methods:
    • Quantitative methods
  • Other research types:
    • Health policy
  • Core values of primary care:
    • Continuity

Keywords

  • continuity of care
  • primary care
  • patient health outcomes
  • known provider
  • physician-patient relationship
  • patient care team
  • group practice
  • part-time
  • health workforce
  • health policy
  • physician shortage area
  • delivery of health care
  • office visits
  • appointments and schedules
  • community health planning

Content

  • Current Issue
  • Past Issues
  • Early Access
  • Plain-Language Summaries
  • Multimedia
  • Podcast
  • Articles by Type
  • Articles by Subject
  • Supplements
  • Calls for Papers

Info for

  • Authors
  • Reviewers
  • Job Seekers
  • Media

Engage

  • E-mail Alerts
  • e-Letters (Comments)
  • RSS
  • Journal Club
  • Submit a Manuscript
  • Subscribe
  • Family Medicine Careers

About

  • About Us
  • Editorial Board & Staff
  • Sponsoring Organizations
  • Copyrights & Permissions
  • Contact Us
  • eLetter/Comments Policy

© 2025 Annals of Family Medicine