
Article Figures & Data
Figures
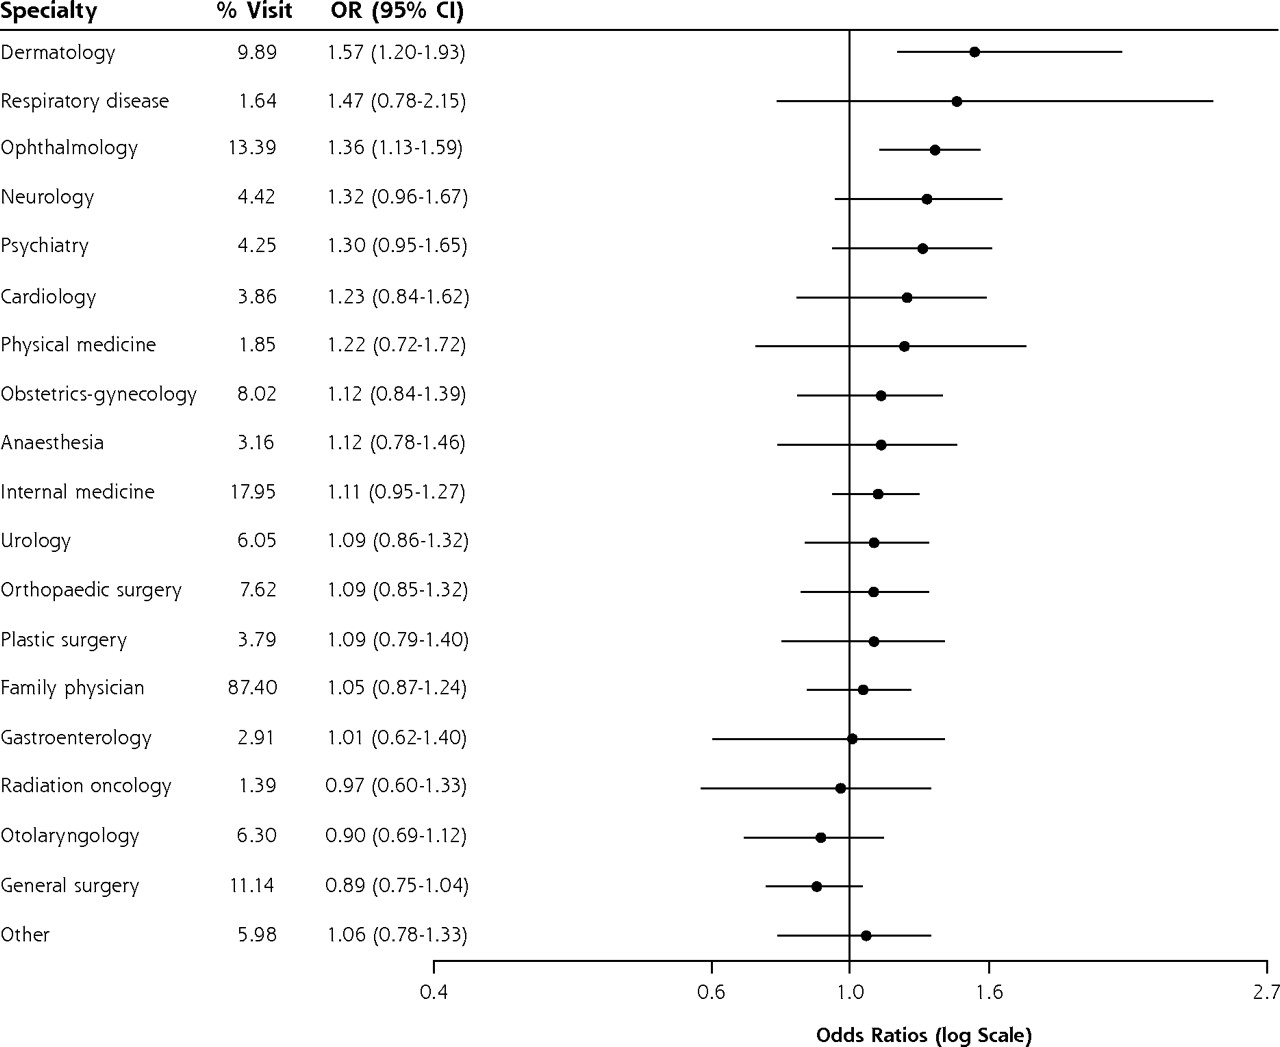
- Figure 1.
Utilization of at least 1 office visit by specialty, adjusted for sociodemographic characteristics, self-reported morbidity, and diagnosis-based morbidity.

Tables
- Table 1.
Sociodemographic and Morbidity Measures by Sex for Population-Weighted Canadian Community Health Survey, 2000–2001 for Ontario, and Johns Hopkins Adjusted Clinical Groups, 2001–2002
Variable All Female Male PValue CCHS = Canadian Community Health Survey. aEducational attainment categorized as low (not completed high school), medium (high school completion and some postsecondary education), and high (university degree). Values missing for 0.7% of respondents. bIncome defined using total household income adjusted for the number of people living in the household and categorized as low (Statistics Canada’s lowest and lower-middle income), medium (upper-middle income), and high (highest income). For a household with 2 or fewer people, income levels correspond with Canadian dollar incomes of <$30,000, $30,000-59,999, and ≥$60,000, respectively. Values missing for 9.0% of respondents. CCHS measures Mean age, y 45.6 47.1 44.1 <.001 Educational attainment, %a Low 18.3 19.3 17.4 Medium 30.8 32.5 29.3 High 50.9 48.2 53.3 <.001 Income, %b Low 26.9 30.8 23.3 Medium 34.4 34.1 34.7 High 38.7 35.1 42.0 <.001 Poor-fair self-rated health, % 12.8 13.8 11.9 <.001 ≥2 Chronic conditions, % 41.6 49.6 34.3 <.001 Depression, % 11.7 14.9 8.8 <.001 Disability, % 13.9 18.9 9.4 <.001 Adjusted Clinical Groups ≥6 Aggregated diagnosis groups, % 30.3 38.9 22.4 <.001 ≥4 Resource utilization bands, % 12.1 14.1 10.3 <.001 - Table 2.
Distribution of Morbidity Measures by Education and Income, Population-Weighted Canadian Community Health Survey, 2000–2001, for Ontario, and Johns Hopkins Adjusted Clinical Groups, 20001–2002
Educationa Incomeb Morbidity Measure Age, y High % Medium % Low % Rate Ratio 95% CI High % Medium % Low % Rate Ratio 95% CI CCHS = Canadian Community Health Survey. Note: Rate ratio for high/low education and income. a Educational attainment categorized as low (not completed high school), medium (high school completion and some postsecondary education), and high (university degree). Values missing for 0.7% of respondents. b Income defined using total household income adjusted for the number of people living in the household and categorized as low (Statistics Canada’s lowest and lower-middle income), medium (upper-middle income), and high (highest income). For a household with 2 or fewer people, income levels correspond with Canadian dollar incomes of <$30,000, $30,000-59,999, and ≥$60,000, respectively. Values missing for 9.0% of respondents. CCHS measures Poor-fair self-rated health Female 20–44 5.8 7.0 17.9 0.32 0.21–0.44 3.5 5.9 13.1 0.27 0.24–0.31 45–79 13.1 16.8 32.0 0.41 0.34–0.48 9.7 17.1 31.3 0.31 0.16–0.37 Male 20–44 3.6 6.4 16.2 0.22 0.13–0.31 3.2 6.1 10.4 0.31 0.23–0.39 45–79 12.8 18.6 33.1 0.39 0.32–0.45 9.9 17.5 35.2 0.28 0.19–0.43 All 20–79 8.3 11.4 28.0 0.30 0.26–0.33 6.3 11.5 22.8 0.28 0.22–0.34 Chronic conditions ≥2 Female 20–44 34.5 35.5 48.0 0.72 0.61–0.82 33.8 36.6 38.9 0.87 0.74–1.00 45–79 57.2 59.4 69.9 0.82 0.77–0.87 52.4 63.2 68.0 0.77 0.71–0.83 Male 20–44 23.4 23.1 30.4 0.77 0.63–0.91 21.4 25.4 26.0 0.82 0.68–0.96 45–79 43.5 47.5 53.3 0.82 0.75–0.88 41.4 44.7 55.8 0.74 0.67–0.81 All 20–79 37.9 39.8 55.2 0.69 0.65–0.72 35.5 41.9 48.2 0.74 0.69–0.78 Depression Female 20–44 14.9 18.9 20.0 0.75 0.55–0.94 13.8 16.4 20.1 0.69 0.53–0.83 45–79 12.5 13.3 14.0 0.89 0.68–1.10 12.1 13.0 15.2 0.80 0.58–1.01 Male 20–44 8.5 9.5 19.1 0.45 0.32–0.56 7.0 10.0 15.5 0.45 0.33–0.58 45–79 7.2 7.4 7.9 0.91 0.65–1.18 5.2 8.1 9.4 0.55 0.38–0.72 All 20–79 10.6 12.4 13.6 0.78 0.68–0.87 9.1 11.7 15.2 0.60 0.52–0.68 Disability Female 20–44 8.4 8.4 18.8 0.45 0.29–0.60 6.6 8.6 14.2 0.46 0.33–0.60 45–79 21.8 24.3 38.4 0.57 0.49–0.64 18.3 25.9 36.0 0.51 0.42–0.60 Male 20–44 3.2 3.6 11.4 0.28 0.15–0.41 3.3 3.5 8.1 0.41 0.23–0.59 45–79 12.2 15.4 22.9 0.53 0.43–0.64 8.7 14.1 28.2 0.31 0.24–0.38 All 20–79 10.5 12.2 26.4 0.40 0.36–0.44 8.5 12.7 22.4 0.38 0.33–0.43 Adjusted Clinical Groups Aggregated diagnosis groups ≥6 Female 20–44 28.7 34.2 38.0 0.75 0.61–0.90 29.2 31.2 34.3 0.85 0.72–0.98 45–79 41.6 45.1 50.8 0.82 0.74–0.90 40.9 44.4 49.2 0.83 0.75–0.92 Male 20–44 13.2 14.4 20.3 0.65 0.49–0.81 11.8 15.1 17.3 0.68 0.50–0.87 45–79 29.4 32.6 37.2 0.79 0.69–0.89 26.7 33.2 39.6 0.68 0.58–0.77 All 20–79 26.7 30.4 39.7 0.67 0.63–0.72 25.4 30.3 35.9 0.71 0.66–0.76 Resource utilization bands ≥4 Female 20–44 6.6 9.0 13.6 0.49 0.43–0.56 7.3 7.6 9.4 0.78 0.52–1.03 45–79 17.7 17.2 23.8 0.74 0.28–0.69 14.6 16.5 25.9 0.56 0.46–0.67 Male 20–44 3.9 4.1 10.4 0.38 0.61–0.87 3.4 4.4 7.0 0.48 0.24–0.72 45–79 14.6 16.1 23.1 0.63 0.22–0.53 13.2 17.0 22.0 0.60 0.47–0.73 All 20–79 9.9 10.8 20.1 0.49 0.52–0.75 9.0 11.1 16.5 0.54 0.47–0.62 - Table 3.
Patient Utilization of Family Physicians/General Practitioners and Specialists by Education and Income, Population-Weighted Canadian Community Health Survey, 2000–2001, for Ontario, and Ontario Health Insurance Plan Claims, 2002–2004
Educationa,b Incomea,c Variabled Age, y High % Medium % Low % Rate Ratio 95% CI High % Medium % Low % Rate Ratio 95% CI CI=confidence interval; FP/GP = family physician/general practitioner. Note: Rate ratio for high/low education and income. a Data from the Canadian Community Health Survey. b Educational attainment categorized as low (not completed high school), medium (high school completion and some postsecondary education), and high (university degree). Values missing for 0.7% of respondents. c Income defined using total household income adjusted for the number of people living in the household and categorized as low (Statistics Canada’s lowest and lower-middle income), medium (upper-middle income), and high (highest income). For a household with 2 or fewer people, income levels correspond with Canadian dollar incomes of <$30,000, $30,000-59,999, and ≥$60,000, respectively. Values missing for 9.0% of respondents. d Data from the Ontario Health Insurance Plan Claims. FP/GP visits ≥1 Female 20–44 91.1 89.9 91.7 0.99 0.96–1.03 92.4 89.6 89.4 1.03 1.00–1.07 45–79 91.4 90.9 92.5 0.99 0.96–1.01 91.8 91.5 91.2 1.01 0.98–1.03 Male 20–44 81.9 81.1 79.7 1.03 0.96–1.09 81.8 80.0 81.0 1.01 0.96–1.06 45–79 87.6 87.0 86.2 1.02 0.98–1.05 84.9 90.0 85.8 0.99 0.95–1.03 All 20–79 87.4 86.9 88.2 0.99 0.97–1.01 87.0 87.4 87.2 1.00 0.98–1.02 FP/GP visits ≥10 Female 20–44 29.3 31.8 42.8 0.68 0.54–0.82 26.9 34.3 33.3 0.81 0.68–0.93 45–79 38.7 47.5 55.7 0.69 0.63–0.76 37.8 47.4 51.0 0.74 0.66–0.82 Male 20–44 14.0 15.1 20.2 0.69 0.50–0.89 13.4 13.6 19.0 0.70 0.50–0.91 45–79 33.4 38.5 43.3 0.77 0.69–0.85 31.4 39.3 44.0 0.71 0.62–0.81 All 20–79 27.4 31.7 44.1 0.62 0.58–0.66 25.9 32.8 37.6 0.69 0.64–0.74 Specialist visits ≥1 Female 20–44 52.3 51.5 56.0 0.93 0.82–1.04 52.5 51.5 53.9 0.97 0.88–1.06 45–79 68.2 70.9 72.9 0.94 0.88–0.99 67.8 70.1 71.9 0.94 0.89–1.00 Male 20–44 39.1 33.2 38.0 1.03 0.86–1.20 37.7 34.9 39.9 0.95 0.82–1.08 45–79 64.3 63.1 64.6 0.99 0.93–1.06 62.0 66.1 64.2 0.97 0.90–1.04 All 20–79 54.3 52.7 62.3 0.87 0.84–0.91 53.2 54.8 58.2 0.91 0.88–0.95 Specialist visits ≥5 Female 20–44 16.3 17.9 17.9 0.91 0.64–1.18 15.4 17.8 18.8 0.82 0.62–1.01 45–79 35.1 34.8 36.9 0.95 0.85–1.06 32.2 37.0 37.9 0.85 0.74–0.96 Male 20–44 9.5 9.1 14.3 0.66 0.44–0.89 9.0 10.0 11.0 0.82 0.55–1.08 45–79 30.5 32.1 32.7 0.93 0.82–1.05 28.2 35.0 35.0 0.81 0.69–0.92 All 20–79 21.4 22.0 29.4 0.73 0.67–0.79 20.0 23.7 26.9 0.74 0.70–0.83 - Table 4.
Patient Utilization of Family Physicians/General Practitioners by Education and Income, Population-Weighted Canadian Community Health Survey, 2000–2001, for Ontario, and Ontario Health Insurance Plan Claims, 2002–2004
≥1 FP/GP Visits vs No Visita ≥10 FP/GP Visits vs <10 Visitsa Patient Characteristic Partially Adjusted OR (95% CI) Fully Adjusted OR (95% CI) Partially Adjusted OR (95% CI) Fully Adjusted OR (95% CI) CCHC = Canadian Community Health Survey; CI = confidence interval; FP/GP = family physician/general practitioner; OR = odds ratio. aAdjusted for sociodemographic characteristics, self-reported morbidity, and diagnosis-based morbidity. bEducational attainment categorized as low (not completed high school), medium (high school completion and some postsecondary education), and high (university degree). Values missing for 0.7% of respondents. cIncome defined using total household income adjusted for the number of people living in the household and categorized as low (Statistics Canada’s lowest and lower-middle income), medium (upper-middle income), and high (highest income). For a household with 2 or fewer people, income levels correspond with Canadian dollar incomes of <$30,000, $30,000-59,999, and ≥$60,000, respectively. Values missing for 9.0% of respondents. CCHC measures Educational attainmentb High 1.02 (0.84–1.20) 1.05 (0.87–1.24) 0.66 (0.57–0.75) 0.77 (0.65–0.88) Medium 0.95 (0.78–1.12) 0.99 (0.80–1.18) 0.79 (0.68–0.90) 0.91 (0.77–1.05) Low (reference) 1.00 1.00 1.00 1.00 Incomec High 1.11 (0.94–1.28) 1.14 (0.95–1.33) 0.71 (0.61–0.81) 0.85 (0.72–0.98) Medium 1.10 (0.92–1.27) 1.09 (0.90–1.28) 0.90 (0.78–1.01) 1.02 (0.87–1.16) Low (reference) 1.00 1.00 1.00 1.00 Location Urban 1.05 (0.90–1.20) 0.98 (0.83–1.12) 1.31 (1.14–1.47) 1.23 (1.05–1.41) Rural (reference) 1.00 1.00 1.00 1.00 Age (continuous) 1.01 (1.01–1.02) 1.00 (0.99–1.00) 1.04 (1.03–1.04) 1.02 (1.02–1.03) Sex Female 1.95 (1.71–2.18) 1.44 (1.24–1.63) 1.65 (1.49–1.81) 1.26 (1.12–1.40) Male (reference) 1.00 1.00 1.00 1.00 Self-rated health Fair-poor — 0.69 (0.53–0.85) — 1.74 (1.44–2.03) Good — 0.95 (0.79–1.12) — 1.28 (1.11–1.44) Very good/excellent (reference) — 1.00 — 1.00 Chronic conditions ≥2 Yes — 1.34 (1.15–1.54) — 1.34 (1.19–1.50) No (reference) — 1.00 — 1.00 Depression Yes — 1.05 (0.81–1.29) — 1.08 (0.90–1.26) No (reference) — 1.00 — 1.00 Disability 0.84 (0.64–1.03) 1.18 (0.99–1.37) Yes — — No (reference) — 1.00 — 1.00 Adjusted Clinical Groups Aggregated diagnosis groups ≥10 (high) — 3.19 (1.61–4.78) — 6.82 (5.00–8.65) 6–9 (medium) — 3.07 (2.29–3.86) — 2.81 (2.46–3.16) 0–5 (low) (reference) — 1.00 — 1.00 Resource utilization bands ≥4 (very high) — 2.80 (1.89–3.72) — 3.53 (2.32–4.74) 3 (high) — 5.29 (4.40–6.17) — 4.29 (3.04–5.54) 2 (medium) — 2.68 (2.23–3.13) — 2.26 (1.55–2.97) 0–1 (low) (reference) — 1.00 — 1.00 - Table 5.
Patient Utilization of Specialists by Education and Income, Population-Weighted Canadian Community Health Survey, 2000–2001, for Ontario, and Ontario Health Insurance Plan Claims 2002–2004
≥1 Specialist Visit vs No Visita ≥5 Specialist Visit vs <5 Visitsa Patient Characteristic Partially Adjusted OR (95% CI) Fully Adjusted OR (95% CI) Partially Adjusted OR (95% CI) Fully Adjusted OR (95% CI) CI=confidence interval; OR = odds ratio. aAdjusted for sociodemographic characteristics, self-reported morbidity, and diagnosis-based morbidity. bEducational attainment categorized as low (not completed high school), medium (high school completion and some postsecondary education), and high (university degree). Values missing for 0.7% of respondents. cIncome defined using total household income adjusted for the number of people living in the household and categorized as low (Statistics Canada’s lowest and lower-middle income), medium (upper-middle income), and high (highest income). For a household with 2 or fewer people, income levels correspond with Canadian dollar incomes of <$30,000, $30,000-59,999, and ≥$60,000, respectively. Values missing for 9.0% of respondents. CCHC measures Educational attainmentb High 1.06 (0.93–1.18) 1.22 (1.07–1.37) 1.04 (0.88–1.19) 1.23 (1.03–1.42) Medium 0.99 (0.87–1.12) 1.12 (0.97–1.26) 1.04 (0.86–1.22) 1.19 (0.99–1.40) Low (reference) 1.00 1.00 1.00 1.00 Incomec High 0.98 (0.88–1.08) 1.12 (0.99–1.24) 0.88 (0.76–1.00) 1.05 (0.90–1.20) Medium 0.95 (0.85–1.05) 1.02 (0.90–1.13) 1.00 (0.86–1.13) 1.12 (0.96–1.29) Low (reference) 1.00 1.00 1.00 1.00 Location Urban 1.29 (1.16–1.41) 1.22 (1.10–1.34) 1.22 (1.07–1.37) 1.19 (1.03–1.34) Rural (reference) 1.00 1.00 1.00 1.00 Age (continuous) 1.04 (1.04–1.04) 1.03 (1.02–1.03) 1.04 (1.03–1.04) 1.03 (1.02–1.03) Sex Female 1.55 (1.42–1.67) 1.21 (1.10–1.31) 1.18 (1.04–1.32) 1.04 (0.90–1.17) Male (reference) 1.00 1.00 1.00 1.00 Self-rated health Fair-poor — 1.24 (1.05–1.43) — 1.66 (1.37–1.95) Good — 1.12 (1.00–1.24) — 1.24 (1.06–1.42) Very good/excellent (reference) — 1.00 — 1.00 Chronic conditions ≥2 Yes — 1.32 (1.19–1.45) — 1.12 (0.97–1.26) No (reference) — 1.00 — 1.00 Depression Yes — 1.08 (0.92–1.24) — 1.08 (0.90–1.25) No (reference) — 1.00 — 1.00 Disability Yes — 1.15 (0.98–1.33) — 1.15 (0.97–1.33) No (reference) — 1.00 — 1.00 Adjusted Clinical Groups Aggregated diagnosis groups ≥10 (high) — 3.02 (2.17–3.87) — 2.34 (1.76–2.92) 6–9 (medium) — 1.89 (1.67–2.10) — 1.37 (1.18–1.56) 0–5 (low) (reference) — 1.00 — 1.00 Resource utilization bands ≥4 (very high) — 3.31 (2.53–4.10) — 2.76 (1.85–3.68) 3 (high) — 2.79 (2.38–3.21) — 1.85 (1.36–2.33) 2 (medium) — 1.71 (1.44–1.98) — 1.22 (0.88–1.57) 0–1 (low) (reference) — 1.00 — 1.00
The Article in Brief
Universal Health Insurance and Equity in Primary Care and Specialist Office Visits: A Population-Based Study
Richard H. Glazier , and colleagues
Background Does universal coverage of physician services reduce socioeconomic disparities in health care? If so, to what degree? Researchers in Canada, which has universal coverage of necessary physician services, examined equity in the use of those services.
What This Study Found Universal health insurance appears to reduce income inequities but not education-related disparities in physician services. Those with higher levels of education are more likely to see specialists, to be frequent visitors to the doctor, and to bypass primary care to reach specialists compared with those with lower levels of education.
Implications
- One explanation for the study findings may be that patients with higher levels of education have better health knowledge, which leads to greater demand for care and better ability to navigate the health care system.
- The authors suggest that policy makers consider the advantage of providing universal physician coverage as a means to reduce income inequities, although this strategy alone is unlikely to eliminate educational disparities in use of physician services.


Jump to section
Related Articles
Cited By...
- Collecting sociodemographic data in primary care: qualitative interviews in community health centres
- Routinely asking patients about income in primary care: a mixed-methods study
- Lignes directrices de pratique clinique 2018 de Diabete Canada: Principaux messages a lintention des medecins de famille qui traitent les patients atteints de diabete de type 2
- Diabetes Canada 2018 clinical practice guidelines: Key messages for family physicians caring for patients living with type 2 diabetes
- Adverse effect of long work hours on incident diabetes in 7065 Ontario workers followed for 12 years
- Integrated care for resected early stage lung cancer: innovations and exploring patient needs
- Do baby boomers use more healthcare services than other generations? Longitudinal trajectories of physician service use across five birth cohorts
- Building a Foundation to Reduce Health Inequities: Routine Collection of Sociodemographic Data in Primary Care
- Making the case for primary care
- Unintended consequences of delisting routine eye exams on retinopathy screening for people with diabetes in Ontario, Canada
- Reinventing Primary Care: Lessons From Canada For The United States
- In This Issue: Critical Topics in Primary Care