
Abstract
PURPOSE Vaccination rates for pneumococcal polysaccharide vaccine (PPV) and influenza vaccine are relatively low in disadvantaged urban populations. This study was designed to assess which physician and practice characteristics might explain differences in rates across physicians.
METHODS PPV and influenza vaccination rates were determined for 2,021 patients aged 65 years and older receiving care from 30 physicians in 17 practices surveyed about their office systems for providing adult immunizations. Hierarchical linear modeling (HLM) analyses were used to examine the relationships among vaccination rates, patient-level characteristics, and physician variables.
RESULTS Overall, the weighted PPV vaccination rate was 60.0% and varied widely across physicians (range, 11%–98%). At the patient level in HLM, patient race (P=.01) and age (P = .02), but not neighborhood income, were associated with PPV status. By linking physician survey data with PPV rates, we found the best pair of physician variables to be “reported time spent with patients for a well visit” (P = .01) and “use of enhanced immunization documentation” (P=.10). The overall influenza vaccination rate was 51.9% (range, 22%–96%). Patient race (P=.003) and age (P = .002) were associated with influenza vaccination. The pair of physician variables with the strongest association with influenza vaccination was “use of standing orders” (P <.001) and “average observed physician examination room time,” regardless of visit type (P=.02).
CONCLUSIONS Vaccination rates vary widely in urban settings and are associated with practice characteristics such as time spent with patients and, for influenza vaccine, use of standing orders.
INTRODUCTION
Racial disparities in adult vaccination rates are well established.1–3 There are several possible reasons, among them, low uptake of both influenza and pneumococcal polysaccharide vaccine (PPV). A potential explanation for disparities in vaccination rates may be systematic differences inherent to the practices where people receive care. Crab-tree et al have described the unique culture and organization of primary care practices, leading to differences in provision of preventive services.4 Furthermore, recent research has shown that blacks and whites receive care from clinicians who differ both in their training and in the level and types of resources available to them.5 Thus, a hierarchical examination of immunization as an outcome in the context of the individual clinician within the structure of the practice is a logical next step.
This study was designed to (1) examine physician characteristics and office systems that are associated with vaccination rates among the elderly; and (2) account for variation in vaccination levels among physicians. Physician survey data, patient demographics, and vaccination status from medical record reviews were combined in hierarchical linear modeling to account for clustering of patient data.
METHODS
Detailed methods, including site selection, recruitment, survey development, patient selection, power calculations, and medical record review, have been published.6 Methods specific to this analysis will be described herein.
Site and Physician Selection
In our intentional selection, we sought diverse types of practices that served a large percentage of elderly patients. We attempted to match practices (solo or multiphysician) serving primarily minority patients with a similar practice serving primarily white patients in socioeconomically comparable neighborhoods. Twenty-three practices were solicited for participation and 18 accepted. Five practices (22%) failed to respond to requests or refused to participate. Twelve of the participating practices were affiliated with a network that shares an electronic billing system, 2 were faculty practice sites, and 4 were independently owned. One practice did not have data usable for this analysis, leaving 17 practices with 36 physicians who agreed to participate.
Survey Development
The questionnaires were designed to describe current medical practices and determine barriers and facilitators to organization change that could lead to future adoption of immunization improvement strategies. The PRECEDE-PROCEED framework7 was used to develop the survey questionnaires. Constructs from this framework that appeared in the physician questionnaire included predisposing, enabling, and environmental factors. Some factors of the Competing Values Framework8,9 were used to assess team-work, innovation, bureaucracy, and efficiency, all of which can affect the ability of a practice to implement quality improvements. Variables derived from survey questions are described in Supplemental Appendix 1, available at http://www.annfammed.org/cgi/content/full/7/6/534/DC1.
The study questionnaire was developed and revised through an iterative process by a multidisciplinary team that examined it for face and content validity.10 It was pilot-tested before use and revised accordingly. Physician participants were offered $50 payment in the form of a check or gift certificate. Survey data were entered twice into an electronic data base, results were compared electronically, and discrepancies were reconciled to reduce keystroke entry error.
Patient Sampling
The first stage of a 2-stage stratified sampling was an intentional sample of diverse practices, stratified by race, as discussed above. Using electronic billing lists or electronic medical records, patients who were born before January 1, 1940, were living, and had an office visit in the last 12 months (indicating they were active patients of the practice) were selected. For offices with more than 1 physician, the physician of record was determined to be the individual who saw a patient for more than 50% of visits during the 5-year review period. These panel lists were randomized, leading to a clustered random sample at the patient level.6
Medical Record Review
Because of the Health Insurance Portability and Accountability Act (HIPAA) regulations, an honest broker11 reviewed medical records from the sampling list at a given practice until a sufficient number (150 to 175) were collected or until all eligible charts in the practice (for smaller practices with fewer than 150 eligible patients) were reviewed. Pneumococcal vaccination status was determined by searching the medical record back as far as possible after the patient reached age 65 years. Influenza vaccination status (vaccinated/ not vaccinated) was collected for the preceding 5 years and was based on receiving influenza vaccine in 3 or more of the 5 years. For more details see Supplemental Appendix 1.
Observed Timing of Visits
On a single day of observation, 2 observers were stationed in a practice, 1 in the waiting room and another in the back-office area. Observers recorded the times that each of a sample of patients entered and left the waiting room, back-office area, and examination rooms, as well as the time that physicians spent in the examination rooms. Based on a prearranged set of physical descriptors for patients, data from the observers were combined to provide the practice-specific (not physician-specific) time for each segment of the visits. Patient times were averaged for each practice.
Statistical Methods
The de-identified medical record data file for each patient was merged with the survey data file for the physician of record. SAS version 9.1 (SAS Institute, Cary, North Carolina) was used to calculate descriptive statistics (Tables 1⇓ and 2⇓). Based on sampling fractions, weights were calculated so that the reviewed records reflected the patient panels within practices and physicians, as appropriate (see Supplemental Appendix 2 at http://www.annfammed.org/cgi/content/full/7/6/534/DC1 for further details). Weighted vaccination rates were stratified, and the Cochran-Mantel-Haenszel test was used to compare vaccination rates by race.
Physician Characteristics (N = 30)
Physician (N = 30) and Practice Characteristics by Panels’ Pneumococcal Polysaccharide Vaccine and Influenza Vaccination Rates, with Significance Testing by Hierarchical Linear Modeling
The PPV and influenza vaccination rates for each panel were calculated using SAS. For descriptive purposes, median splits were used to divide the 30 physicians into 2 groups (high- and low-vaccination rates) for each vaccine. Physician survey responses were compared among the high- and low-vaccination groups (Table 2⇑, columns 1–3). Significance testing was not performed using SAS because the patients were nested within panels.
HLM version 6 (Scientific Software International, Inc, Lincolnwood, Illinois) was used to determine the effect of physician-level variables on vaccination status while controlling for patient race and age.
Following the strategy recommended by Raudenbush and Bryk,12 the multilevel analyses for a Bernoulli distribution were conducted in an incremental fashion, starting with an empty or null model, then adding uncentered level-1 variables about patient race and age, and subsequently adding uncentered level-2 variables from the physician survey and the observed timing variables. The full mathematical model is shown in Supplemental Appendix 2. For level-2 variables with coefficients that were significant at the P <.10 level, correlations were calculated and 1 member of pairs that were statistically significantly correlated (P <.05) was excluded from further analyses. The variable selection was based on the significance level and the number of correlations for a particular variable. Remaining level-2 variables were entered pairwise into multivariable analyses, and the most significant pair was selected.
RESULTS
Sample size constraints of the statistical analyses determined that at least 10 patients with medical record views were required per physician. Consequently, further analyses included 30 physicians. In Table 1⇑ the physician characteristics indicate that the intentional sampling resulted in a diverse array of practices.
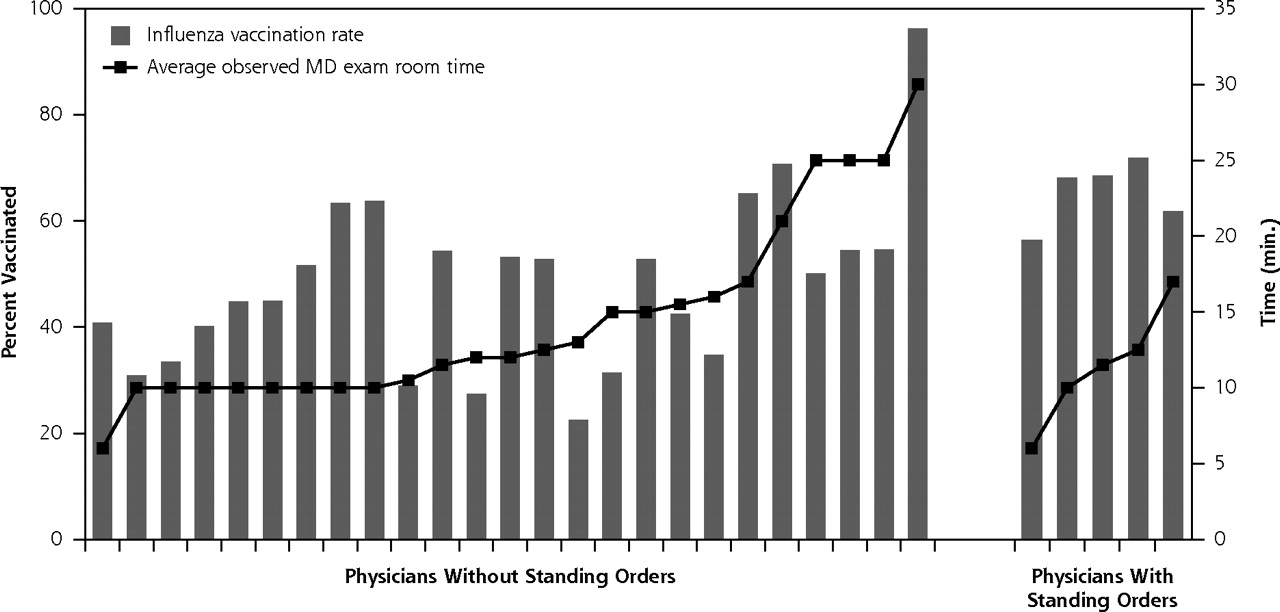
Based on weighted results, the 2,021 patients were largely female (60.8%) and white (81.2%), their average age was 76 years, and they lived in neighborhoods with an average income of $19,439. Overall, weighted PPV vaccination rate was 60.0%; rates differed significantly by race (65.5% for whites vs 36.6% for minorities, P <.001 by stratified Cochran-Mantel-Haenszel test). Overall, weighted influenza vaccination rate was 51.9%; rates again differed significantly by race (55.6% for whites vs 36.2% for minorities, P <.001 by stratified Cochran-Mantel-Haenszel test). Figures 1⇓ (PPV) and 2 (influenza) display bars to plot the vaccination rates for each physician’s patients. Figure 1⇓ is stratified by quality of vaccination documentation, and the PPV vaccination rate shown in columns is organized by increasing reported time for well visits, using a line to show minutes. Without accounting for clustering or other factors, higher rates were more likely to be found with enhanced vaccination documentation and/or with increased reported time spent with patients for well visits. Figure 2⇓ is stratified by use of standing orders, with influenza vaccination shown in columns, and is subsequently organized by increasing average observed physician time in the examination room, regardless of visit type, using a line to show minutes. Without accounting for clustering or other factors, higher rates were more likely to be found with standing orders and/or with increased observed physician time spent in the examination room, although the standing order observation is based on 5 physicians.
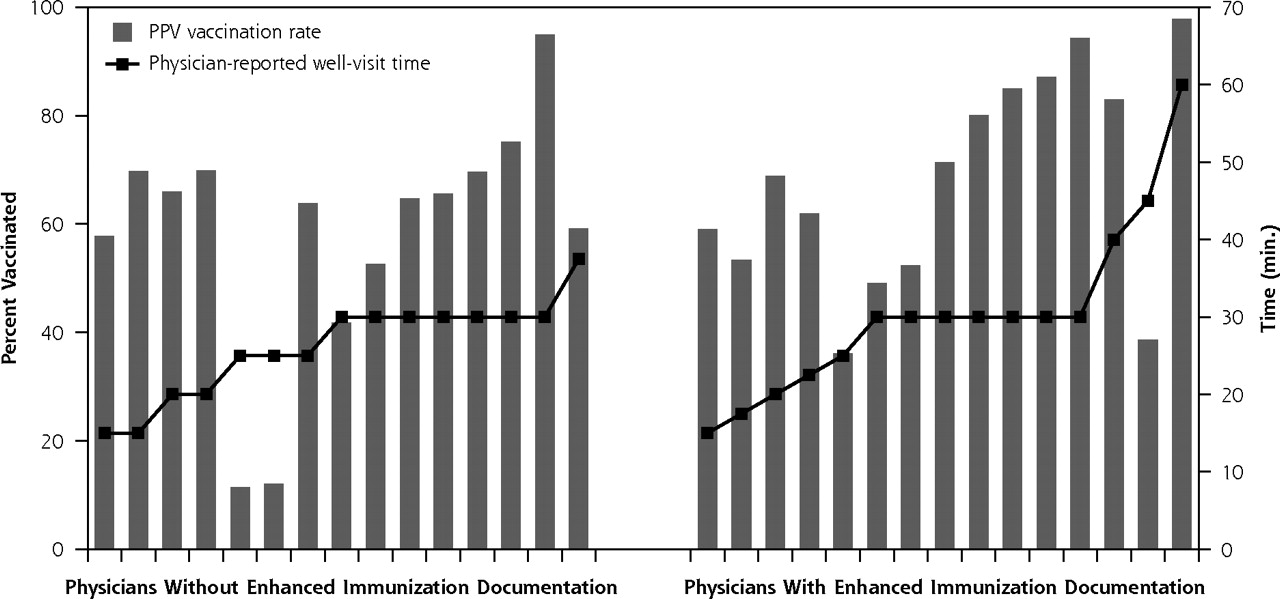
Pneumococcal polysaccharide vaccine (PPV) vaccination rate by immunization documentation and physician-reported well-visit time.
Note: The figure is organized first by quality of immunization documentation and within quality, by reported time for well visits (line). Bars represent PPV vaccination rates.

Influenza vaccination rate by use of standing orders and examination room time.
Note: The figure is organized first by use of standing orders and within standing orders use, by observed time in the examination room for the practice (line). Bars represent influenza vaccination rates.
To allow a comparison of physician responses by vaccination rates, physicians were divided into 2 groups based on median vaccination rate for each vaccine. Descriptive measures of physician responses were calculated by group for PPV (Table 2⇑, columns 2 and 3) and then again for influenza (columns 5 and 6). Inspection suggests differences in screening for immunizations, standing orders, physician reminders, the vaccination status of the physician, and the physician’s race between high and low vaccination groups.
Hierarchical Linear Modeling
In step 1, the overall variance, also called the residual error (μ0), was statistically significant at P <.001 for PPV and P <.001 for influenza, showing significant between-panel variance in immunization rates and supporting the use of heirarchal linear modeling (HLM) over traditional logistic regression.
In step 2, among level-1 variables, patient race (P = .01) and age (P = .02), but not neighborhood income, were found to be associated with PPV immunization status; the former 2 variables were retained for further HLM analyses. For influenza, patient race (P = .003) and age (P = .002) were also significant.
In step 3, one at a time, level-2 variables (physician and practice characteristics) were entered into the model and tested for association with immunization status (Table 2⇑, columns 4 and 7). Items associated with PPV at P <.10 included reported time spent with patients for a well visit, use of enhanced immunization documentation (electronic medical record or health maintenance flow sheet), and average observed total visit time, regardless of visit type. Items associated with influenza vaccination at P <.10 included routinely screening for adult immunizations, use of standing orders to vaccinate, use of physician reminder systems for immunization, influenza vaccination status of the physician, more recent medical school graduation, average observed physician time in the examination room regardless of visit type, and presence of a hierarchical office culture.
In step 4, correlation coefficients were calculated among level-2 variables associated with vaccination at P <.10. For influenza vaccine only, routinely screening for adult immunizations and presence of a hierarchical office culture were correlated with multiple other variables and were excluded from further analyses because of multiple correlations.
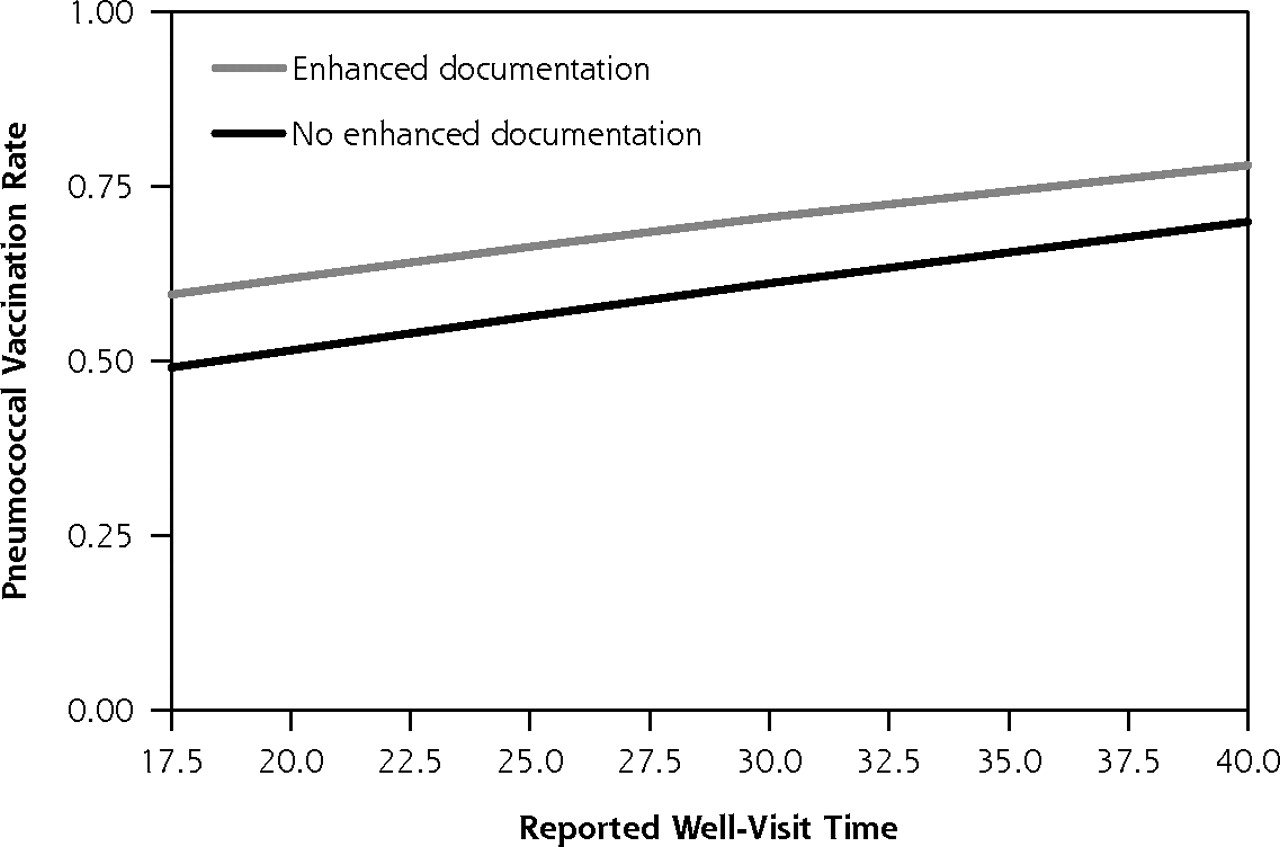
In step 5, the uncorrelated level-2 variables associated with vaccination at P <.10 on an individual basis were entered into multivariable models pairwise to determine statistically significant level-2 variable combinations. For PPV, the best pair was physician reported time spent with patients for a well visit (P = .01) and use of enhanced immunization documentation (P = .10). These results are displayed in Figure 3⇓, in which increasing reported time is associated with higher vaccination rates, with the line for enhanced documentation exceeding the line for a basic style of immunization documentation. For influenza vaccination, the best pair was use of standing orders (P <.001) and average observed physician time spent in the examination room, regardless of visit type (P = .02). Graphically, this association is displayed in Figure 4⇓ in which increasing time is associated with higher vaccination rates, with the line representing standing orders exceeding that for no standing orders. Modeling that included more than 2 level-2 variables did not improve the associations.

Model-based prediction of pneumococcal polysaccharide vaccination rate by reported time for well visits and by use of enhanced (eg, electronic medical records or flow sheet) vs basic vaccination documentation.
Note: Total well-visit time based on 10th and 90th percentiles.
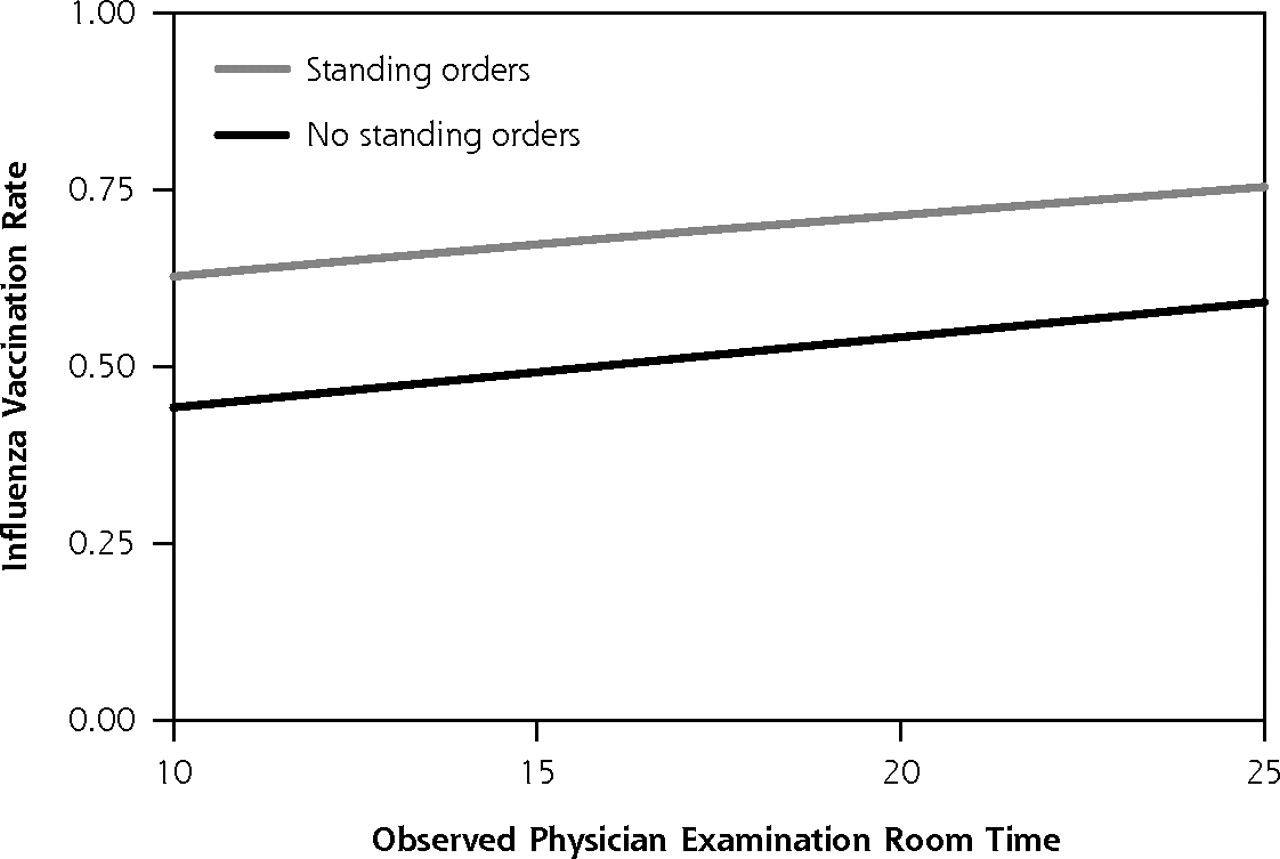
Model-based prediction of influenza vaccination rate by observed physician examination room time and by use of standing orders.
Note: Measured physician time in the examination room based on 10th and 90th percentiles.
Table 3⇓ displays the variables that were included in HLM for each vaccine, as well as the incremental impact of the variable when accounting for the others. White patients experienced an 11% to 12% increase in vaccination rates compared with nonwhites, and increasing age was associated with increased vaccination for both vaccines. Each minute of additional time with patients also improved vaccination rates. Use of standing orders significantly increased influenza vaccination rates.
Correlates of Vaccination Status in Multivariate Hierarchical Linear Modeling
DISCUSSION
Previous research has shown that vaccination rates vary by race and age, and level-1 analyses confirmed those findings in these data. We also found that vaccination rates differed by physician and that, after controlling for race and age, longer reported well-visit length and enhanced vaccine documentation were associated with vaccination status for PPV, and use of standing orders and average observed physician examination room time were associated with influenza vaccination status.
Because PPV is ordinarily administered only once, physicians may hesitate to vaccinate if the status is unknown.13 Thus documentation of PPV in an easily located electronic medical record or health maintenance record would, understandably, be associated with higher rates. Stange et al found that increased visit length was associated with increased provision of preventive services.14 We found the same outcome for influenza vaccine as measured and for PPV as reported. Timing studies of primary care visits report that length of visit is largely affected by organizational factors, such as availability of nonphysician support staff and organizational structure.15,16 Although the type and number of topics discussed did not affect visit length,16 longer visits were associated with more procedures and screening tests.15
Standing orders to vaccinate without an individual physician’s order have long been recognized as an effective strategy for increasing adult vaccination rates in both inpatient and outpatient settings.17–19 Furthermore, the reduction or elimination of racial disparities in PPV vaccination in inner-city practices has been found using a menu approach that includes standing orders as a program component.20,21 Despite being based on only 5 physicians in as many practices, use of standing orders was associated with the largest increase in influenza vaccination rates in our estimations, which is apparent graphically in Figure 4⇑. Given the difficulty in increasing physician time, particularly in health man-power shortage areas that often occur in disadvantaged inner-city communities, standing orders may be the most feasible way to increase vaccination rates in these communities.
Strengths and Limitations
Among strengths of this study are that we selected a diverse sample of practices and used a variety of underlying theoretical models to understand office culture and practices that enhance or inhibit vaccination. We intentionally sampled practices with large minority patient populations and generally matched them with similar sized practices that had largely white patient populations. Our questionnaires and observations are second generation, building on our previous work. Using HLM, we examined vaccination of patients within the environment of the individual physician and his or her office setting, thus accounting for the clustered nature of the data and properly accounting for variance partitioning.
We found somewhat different variables to be associated with influenza in comparison to PPV; although some may see our finding as a limitation, we note the differences in the frequency of vaccination according to Centers for Disease Control and Prevention guidelines: influenza is recommended annually whereas, PPV is recommended once or twice in a lifetime.
A possible limitation is conducting this study in one region of the country; however, this region has the second oldest population of any metropolitan area in the country, with a high proportion of elderly blacks. Unfortunately, the low number of elderly Hispanic patients precludes the examination of factors related to their historically low rates of PPV receipt. The study was conducted on an intentional, diverse convenience sample of a modest number of practices, and the degree to which this sample is representative of where nonwhites and whites obtain care is not known. Our sampling strategy resulted in a few panels with low rates and, by design, included panels that either had few whites or few minorities. In the case of group practices, the data were analyzed at the physician level without accounting for the physicians being in the same practice. Another limitation is that vaccines can be given elsewhere (eg, specialist offices or the hospital); however, many vaccines given to hospitalized patients or specialists within the network would have been captured with our health system’s electronic data bases.
Vaccination rates varied widely in urban settings. Using HLM that accounts for the nested structure of the data (ie, patients are nested within physician) and adjusting for race and age and practice characteristics (such as time spent with patients, vaccination documentation, and influenza vaccine), use of standing orders are associated with higher vaccination rates. We recommend that physicians enhance vaccination documentation by use of flow sheets or electronic medical records and use standing orders for influenza vaccine.
Footnotes
-
Conflicts of interest: Richard K. Zimmerman receives grant funding from Merck & Co, Inc, and MedImmune, Inc; Mary Patricia Nowalk receives grant funding from Merck & Co, Inc, and MedImmune, Inc; Dwight E. Fox receives grant funding from Merck & Co, Inc.
-
Funding support: This study was supported by the Centers for Disease Control and Prevention, grant No. 5 U01 IP000054-02, and the National Institutes of Health and the EXPORT Health Project at the Center for Minority Health, University of Pittsburgh Graduate School of Public Health, National Institutes of Health and the National Center on Minority Health and Health Disparities, grant No. P60 MD-000-207. Its contents are the responsibility of the authors and do not necessarily reflect the official views of the Centers for Disease Control and Prevention, Center for Minority Health, or the National Institutes of Health.
- Received for publication October 19, 2008.
- Revision received March 9, 2009.
- Accepted for publication March 16, 2009.
- © 2009 Annals of Family Medicine, Inc.


