
Article Figures & Data
Figures
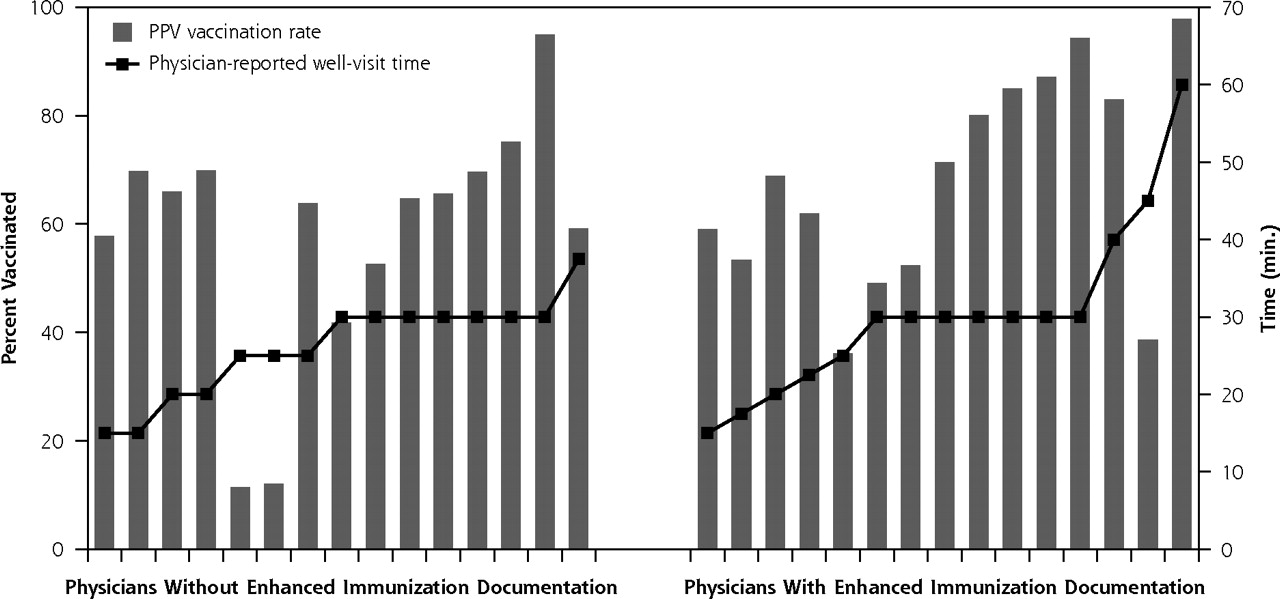
- Figure 1.
Pneumococcal polysaccharide vaccine (PPV) vaccination rate by immunization documentation and physician-reported well-visit time.
Note: The figure is organized first by quality of immunization documentation and within quality, by reported time for well visits (line). Bars represent PPV vaccination rates.
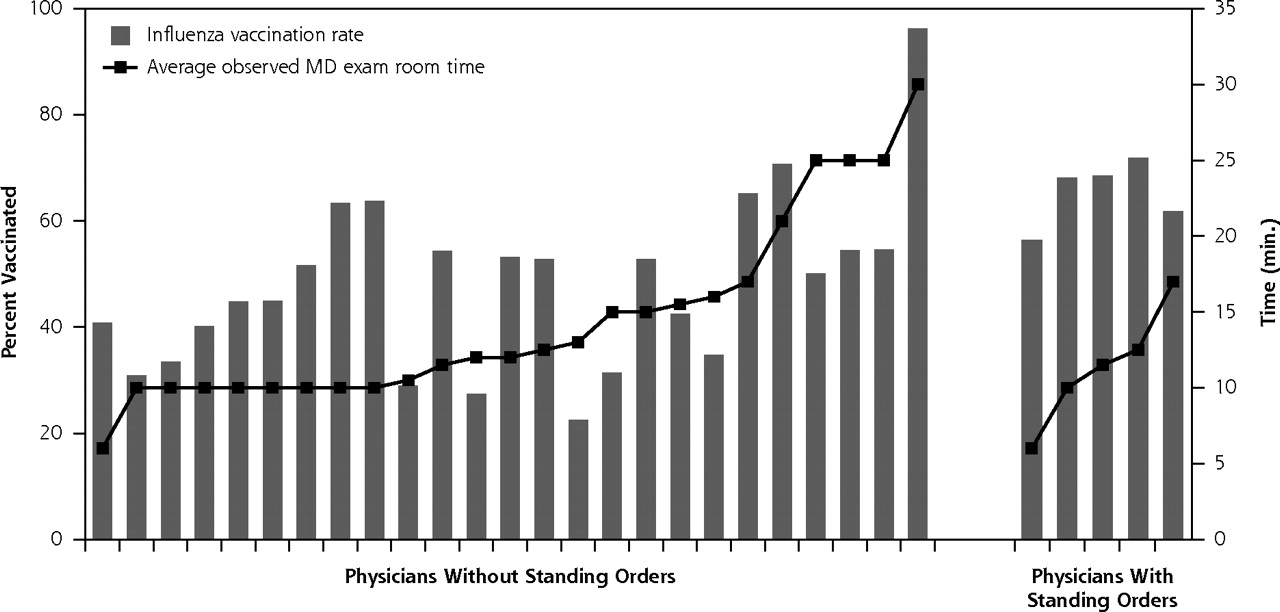
- Figure 2.
Influenza vaccination rate by use of standing orders and examination room time.
Note: The figure is organized first by use of standing orders and within standing orders use, by observed time in the examination room for the practice (line). Bars represent influenza vaccination rates.
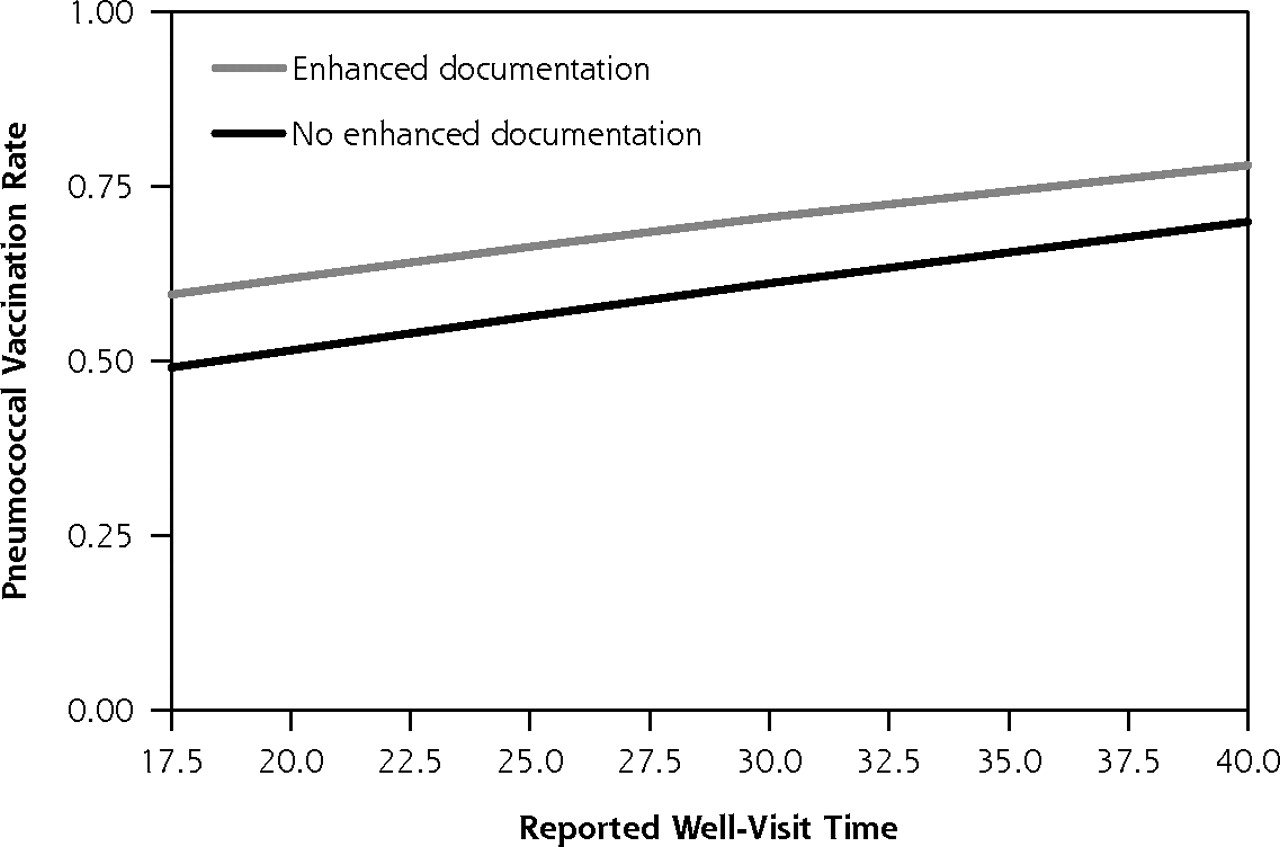
- Figure 3.
Model-based prediction of pneumococcal polysaccharide vaccination rate by reported time for well visits and by use of enhanced (eg, electronic medical records or flow sheet) vs basic vaccination documentation.
Note: Total well-visit time based on 10th and 90th percentiles.
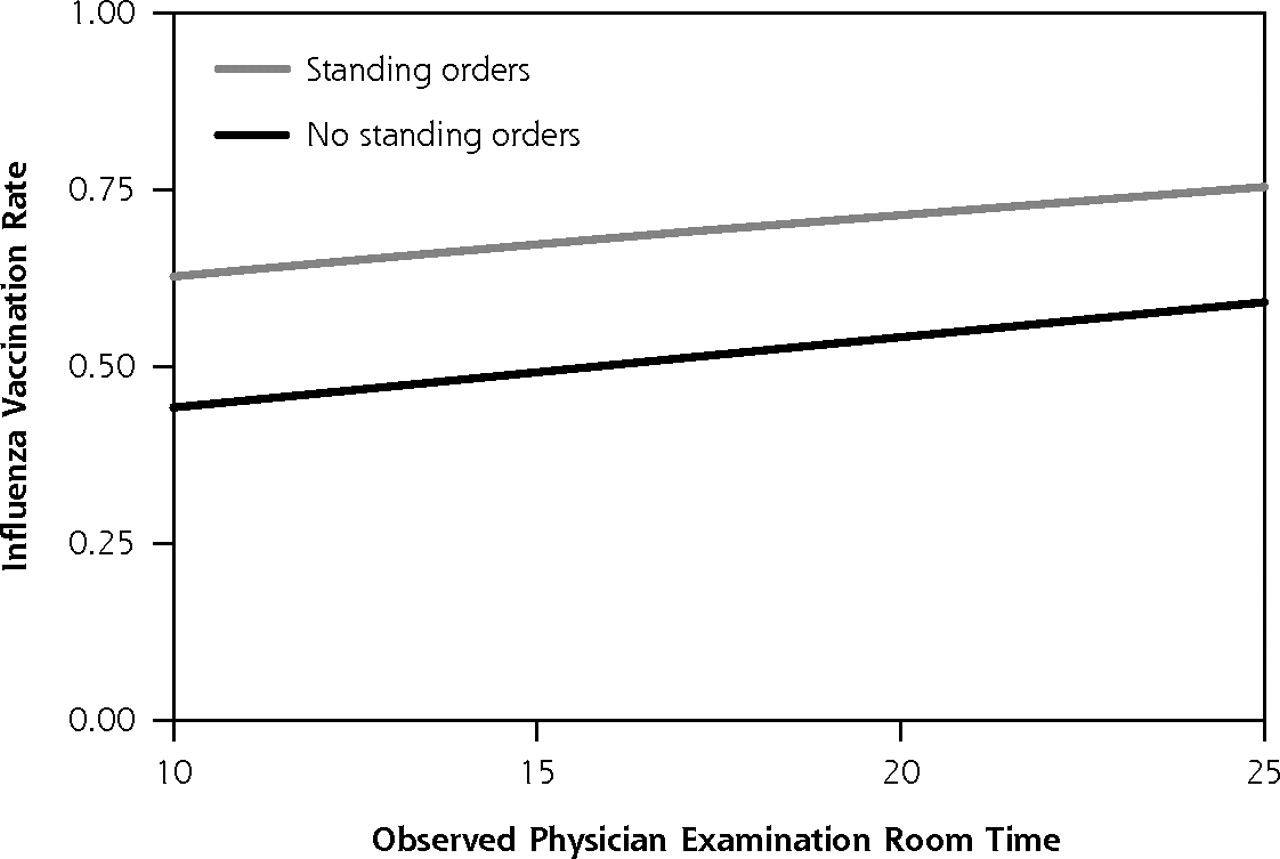
- Figure 4.
Model-based prediction of influenza vaccination rate by observed physician examination room time and by use of standing orders.
Note: Measured physician time in the examination room based on 10th and 90th percentiles.


Tables
Characteristics No. (%) Practices 17 (100) Solo practitioner 7 (23) White 19 (63) Black 4 (13) Asian and other 7 (23) Non-Hispanic 29 (97) Female 8 (27) Age, mean ± SD, y 50.6 ± 8.2 Graduated medical school since 1982 18 (60) US medical graduates 20 (67) Board certified 27 (90) - Table 2.
Physician (N = 30) and Practice Characteristics by Panels’ Pneumococcal Polysaccharide Vaccine and Influenza Vaccination Rates, with Significance Testing by Hierarchical Linear Modeling
PPV Vaccination Influenza Vaccination Characteristics High Ratea n=15 Panels Low Ratea n=15 Panels HLMPValueb High Ratea n=15 Panels Low Ratea n=15 Panels HLMPValueb EMR = electronic medical record; HLM = hierarchal linear modeling; LPN = licensed practical nurse; MA = medical assistant; PA =physician’s assistant; PPV = pneumococcal polysaccharide vaccine; Ref = reference group; RN = registered nurse. a Median split, high-rate PPV = 65.5%–94.7% vaccinated; low-rate PPV = 11.3%–64.6% vaccinated; high-rate influenza = 52.7%–96.1% vaccinated; low-rate influenza = 22.4%–52.6% vaccinated. b P value for the coefficient γ01 in weighted univariate HLM analyses, n = 30. c US medical school, conference attendance, reads top tier research journals, board certified. d PPV knowledge/support score applies to PPV and influenza knowledge/support score applies to influenza vaccination. e See Supplemental Appendix 1, available at http://www.annfammed.org/cgi/content/full/7/6/534/DC1. f Culture scores based on the Competing Values Framework8,9 to assess teamwork, innovation, bureaucracy, and efficiency. Physician demographics Solo physician, % 20.0 26.7 .190 20 26.7 .682 Ref = multiphysician practices White, % 73.3 53.3 .386 60 66.7 .511 Ref = minority Physicians who graduated from medical school 1982 to present, % 60.0 60.0 .991 40 80 .034 Ref = before 1982 Higher physician education,c mean (SD), % 5.8 (1.1) 5.4 (0.9) .186 5.7 (1.1) 5.5 (0.9) .539 Immunization support Using reminder cards/computer recall/ telephone call for patient preventive services, % 66.7 66.7 .568 73.3 60 .122 Ref = other nonsystematic methods Offices where someone routinely screens for adult immunization, % 40.0 26.7 .477 53.3 13.3 .010 Offices with provider reminders for adult immunizations, % 46.7 33.3 .626 40 60 .052 Practices with standing orders for nurses to give adult immunizations without a doctor’s order, % 26.7 6.7 .216 33.3 0 .000 Offices with EMR, health maintenance/flow sheet to record adult immunizations, % 46.7 53.3 .064 60 40 .171 Ref = chart notes, vaccine log, sticker Higher knowledge/more supportive of PPV (influenza) vaccinationd 60.0 46.7 .798 53.3 40 .649 Ref = lower Physicians who received influenza vaccine in 2004–2005 season, % 93.3 80.0 .868 93.3 80 .057 Office structure/practice acuity Time usual primary helper is RN, LPN, PA, % 53.3 26.7 .388 40 40 .142 Ref = MA, student Patients’ bills coded 99213, mean (SD), % 53.6 (20.2) 53.2 (21.7) .362 54.5 (18.5) 52.3 (23.2) .583 Patients’ bills coded 99214, mean (SD), % 39.1 (18.7) 33.5 (22.4) .171 37.3 (18.6) 35.3 (22.8) .663 Physician estimate of time spent with adults for acute and chronic office visits, mean (SD), min 18.2 (5.5) 19.2 (4.6) .498 19.3 (5) 18.2 (5.2) .522 Physician estimate of time spent with adults for a well visit, mean (SD), min 29.7 (10.43) 26.8 (8.0) .009 28.2 (11.4) 28.3 (6.9) .654 Average observed time for total visit, mean (SD), min 55.6 (20.1) 47.6 (11.4) .056 48.3 (9) 54.9 (21.6) .301 Average observed time with physician in examination room—all types of visits, mean (SD), min 15.3 (6.0) 12.6 (5.6) .158 15.4 (6.9) 12.5 (4.4) .068 Better adaptability to office change, mean (SD), % 8.9 (2.2) 9.8 (1.8) .420 9.7 (2.3) 9.1 (1.8) .704 Greater office stability,e mean (SD), % 8.9 (1.6) 8.7 (1.7) .810 9.1 (1.6) 8.5 (1.6) .468 Hierarchical culture,f mean (SD), % 23.4 (15.4) 20.8 (12.8) .993 16.3 (10.9) 27.9 (14.5) .018 Group culture,f mean (SD), % 44.8 (13.1) 44.6 (14.2) .488 43.3 (12.1) 46.1 (14.3) .310 Variable, Fixed Effect Odds Ratio 95% Confidence Interval PValue Interpretation: Incremental Impact of Variablea a The logits were calculated for various scenarios from the HLM equations in Supplemental Appendix 2 (available online at http://www.annfammed.org/cgi/content/full/7/6/534/DC1) and then estimated vaccination rates were calculated using the formula: rate = 1/(1+ exponent [−logit]). A spreadsheet was used to calculate incremental impact. Pneumococcal polysaccharide vaccine Intercept (γ00) 0.03 0.01–0.17 <.001 Patient-level factors Older age, years (γ10) 1.03 1.01–1.06 .019 0.7% increase in rates for each year older White race, ref = minority (γ20) 1.70 1.25–2.32 .001 12% increase in rates for whites vs minorities Physician- and practice-level factors Physician reported time for well visit, minutes (γ01) 1.04 1.01–1.07 .015 0.9% increase in rates for each additional minute Enhanced immunization documentation† (γ02) 1.53 0.91–2.54 .102 9%–10% increase in rates for enhanced documentation (eg, electronic medical record or flow sheet) Influenza Intercept (γ00) 0.04 0.01–0.19 <.001 Patient-level factors Older age, years (γ10) 1.03 1.01–1.05 .003 0.7% increase in rates for each year older White race, reference = minority (γ20) 1.60 1.23–2.10 .001 11% increase in rates for whites vs minorities Physician- and practice-level factors Practice uses standing orders (γ01) 2.12 1.57–2.87 <.001 17%–19% increase in rates for standing orders Average observed physician time in examination room, minutes (γ02) 1.04 1.01–1.07 .016 1% increase in rates for each additional minute
Supplemental Appendixes
Supplemental Appendix 1. Data Collection Survey Variables; Supplemental Appendix 2. Statistical Methods Data Reduction
Files in this Data Supplement:
- Supplemental data: Appendix 1-2 - PDF file, 2 pages, 68 KB
The Article in Brief
Understanding Adult Vaccination in Urban, Lower-Socioeconomic Settings: Influence of Physician and Prevention Systems
Mary Patricia Nowalk , and colleagues
Background Vaccination rates are relatively low in disadvantaged urban populations. This study was designed to (1) examine physician characteristics and office systems that are associated with vaccination rates among the elderly; and (2) account for variation in vaccination levels among physicians.
What This Study Found Analyzing data for 2,021 patients aged 65 years and older receiving care in 17 different practices, researchers found that PPV (pneumococcal polysaccharide vaccine) and influenza vaccination rates varied widely across individual physicians. Longer reported well-visits and enhanced vaccine documentation were associated with vaccination for PPV. The use of standing orders and average physician examination room time were associated with vaccination for influenza.
Implications
- The authors conclude that given the difficulty in increasing physician visit time, particularly in health professional shortage areas that often occur in disadvantaged urban communities, enhanced vaccination documentation using flow sheets or electronic medical records, and standing orders may be the most feasible ways to increase vaccination rates.


