
Article Figures & Data
Figures
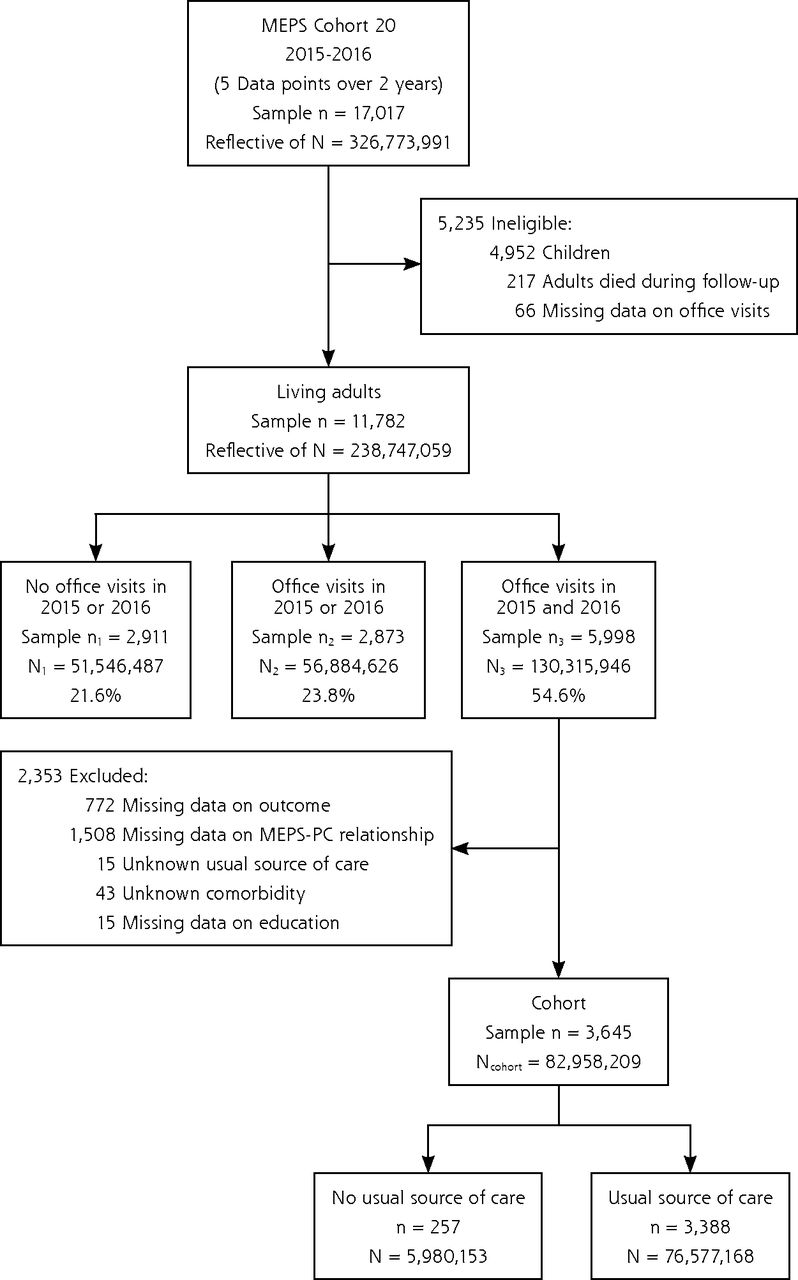
- Figure 1
Construction of a prospective cohort study of US adults who had office-based physician visits in 2 consecutive years. Data from MEPS, 2015-2016.
HC = MEPS Household Component; MEPS-PC = Medical Expenditure Panel Survey Primary Care measure.
Note: Source: Agency for Healthcare Research and Quality, Medical Expenditure Panel Survey (MEPS Panel 20 Longitudinal Data File [HC-193, 2015-2016] and Medical Conditions File [HC-190, 2015]).
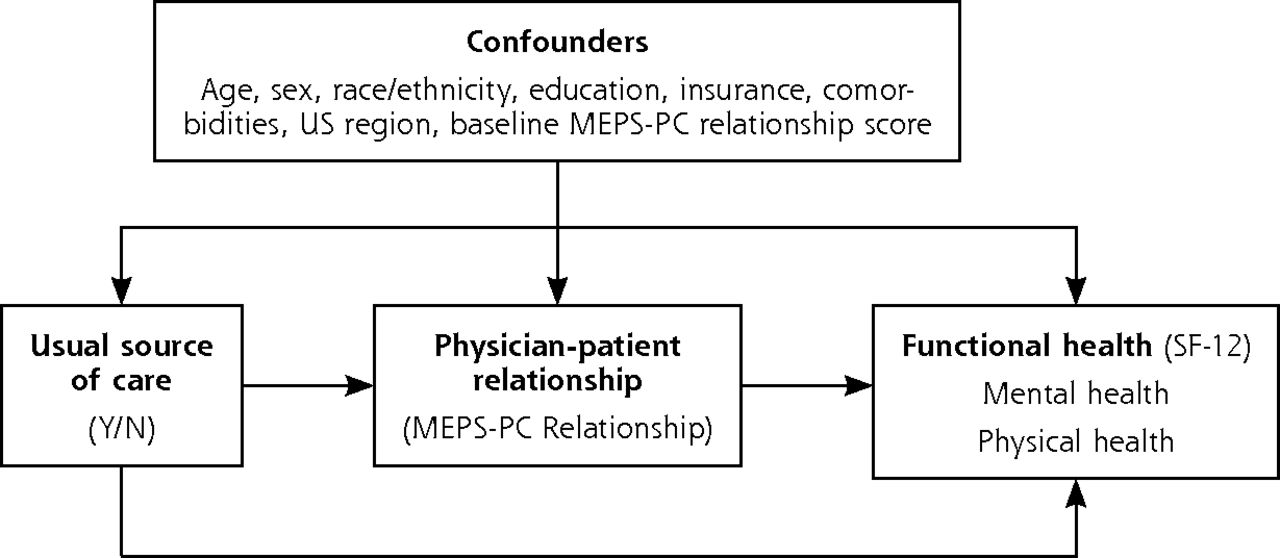
- Figure 2
Directed acyclic graph of the hypothesized mechanism for how physician-patient relationship advances functional health.
HAVEUS2 = does person have USC provider-R2; MEPS-PC = Medical Expenditure Panel Survey Primary Care measure; N = no; SF-12 = 12-Item Short-Form Survey; Y = yes.
Note: Functional health operationalized with the SF-12 instrument. Physician-patient relationship operationalized with the MEPS-PC Relationship composite subscale. Usual source of care operationalized as having a particular doctor’s office, clinic, health center, or other place usually visited when sick or seeking advice about their health, operationalized with the MEPS HAVEUS2 indicator.


Tables
- Table 1
Demographic and Clinical Characteristics of US Community-Dwelling Adults, Comparing Patients With No Physician Office Visits (2015 or 2016), Patients With Physician Office Visits (2015 or 2016), and Patients With Physician Office Visits (2015 and 2016)
Baseline Characteristic MEPS Sample n = 11,782 Overall, US Adult Population Patients With No Office Visits (2015 or 2016) Patients With Office Visits (2015 or 2016) Patients With Office Visits (2015 and 2016) P Value Weighted Frequency (in 1,000s) (%) N = 238,747 (100%) Weighted Frequency (in 1,000s) (%) N1 = 51,546 (21.6%) Weighted Frequency (in 1,000s) (%) N2 = 56,885 (23.8%) Weighted Frequency (in 1,000s) (%) N3 = 130,316 (54.6%) Age, mean (SD) 46.0 (17.5) 46.6 (17.8) 37.6 (14.2) 40.8 (15.5) 52.7 (17.7) <.001 Age group <.001 <40 y 4,707 (40.0) 93,301 (39.1) 30,487 (59.1) 29,532 (51.9) 33,282 (25.5) 40-64 y 5,107 (43.3) 102,195 (42.8) 19,112 (37.1) 22,924 (40.3) 60,159 (46.2) ≥65 y 1,968 (16.7) 43,251 (18.1) 1,948 (3.8) 4,428 (7.8) 36,874 (28.3) Sex <.001 Male 5,455 (46.3) 114,958 (48.2) 32,548 (63.1) 29,503 (51.9) 52,908 (40.6) Female 6,327 (53.7) 123,789 (51.8) 18,998 (36.9) 27,382 (48.1) 77,408 (59.4) Race/Ethnicity <.001 White, non-Hispanic 5,037 (42.8) 152,163 (63.7) 26,842 (52.1) 33,429 (58.8) 91,891 (70.5) Black, non-Hispanic 2,113 (17.9) 27,936 (11.7) 7,615 (14.8) 6,994 (12.3) 13,328 (10.2) Asian, non-Hispanic 938 (8.0) 14,220 (6.0) 3,480 (6.8) 4,251 (7.5) 6,489 (5.0) Other, non-Hispanic 312 (2.6) 6,972 (2.9) 1,296 (2.5) 1,397 (2.5) 4,279 (3.3) Hispanic 3,382 (28.7) 37,456 (15.7) 12,314 (23.9) 10,813 (19.0) 14,328 (11.0) Educationa <.001 <High school 2,331 (19.8) 30,476 (12.8) 8,417 (16.3) 6,978 (12.3) 15,080 (11.6) High school graduate 3,729 (31.6) 73,042 (30.6) 18,186 (35.3) 17,879 (31.4) 36,977 (28.4) >High school 5,611 (47.6) 133,789 (56.0) 24,271 (47.1) 31,643 (55.6) 77,875 (59.8) US region .02 Northeast 1,971 (16.7) 43,448 (18.2) 9,167 (17.8) 9,717 (17.1) 24,566 (18.9) Midwest 2,242 (19.0) 50,597 (21.2) 10,290 (20.0) 11,451 (20.1) 28,856 (22.1) South 4,410 (37.4) 88,295 (37.0) 19,456 (37.7) 20,431 (35.9) 48,408 (37.1) West 3,159 (26.8) 56,406 (23.6) 12,634 (24.5) 15,286 (26.9) 28,487 (21.9) Multimorbiditya <.001 0-1 diagnosis 1,945 (16.5) 38,428 (16.1) 12,736 (24.7) 14,661 (25.8) 11,032 (8.7) 2-4 diagnoses 3,789 (32.2) 79,785 (33.4) 12,260 (23.8) 23,343 (41.0) 44,183 (33.9) ≥5 diagnoses 3,772 (32.0) 83,426 (34.9) 2,400 (4.7) 8,844 (15.5) 72,183 (55.4) Insurance <.001 Private 6,968 (59.1) 168,343 (70.5) 31,780 (61.7) 42,118 (74) 94,445 (72.5) Public 3,175 (26.9) 48,635 (20.4) 7,802 (15.1) 9,308 (16.4) 31,525 (24.2) Uninsured 1,639 (13.9) 21,769 (9.1) 11,964 (23.2) 5,459 (9.6) 4,346 (3.3) Usual source of carea 8,388 (71.2) 177,517 (74.4) 23,090 (44.8) 39,323 (69.1) 115,104 (88.3) <.001 Physician-patient relationship, mean (SD) 66.6 (14.3) 67.1 (13.6) 66.0 (15.8) 67.4 (14.6) 67.1 (13.2) .49 HC = MEPS Household Component; MEPS = Medical Expenditure Panel Survey.
Notes: Data are presented as population count (in 1,000s) and percent unless otherwise noted. For MEPS sample, data are shown as count (%), except for continuous measures, which are presented as mean (SD). For physician-patient relationship, there are missing data for n = 5,342. χ2 test performed on all observations with value > 0.
Source: Agency for Healthcare Research and Quality, Medical Expenditure Panel Survey, Longitudinal Panel (HC −193, 2015-2016) and Medical Conditions (HC −190, 2015).
↵a Data missing for education (n = 111), multimorbidity (n = 2,276), and usual source of care (n = 3,394); percentages reflect observed counts and thus do not sum to 100.
- Table 2
Bivariate Associations Between Baseline Patient Characteristics and Physician-Patient Relationship Among Longitudinal Cohort of US Adults With Physician Office Visits in 2015 and 2016
Baseline Characteristic Physician-Patient Relationship Score Survey-Weighted Population Mean (95% CI) SMDa Age group 0.14 <40 y 65.85 (64.63-67.07) 40-64 y 66.31 (65.47-67.15) ≥65 y 68.65 (67.77-69.53) Sex 0.01 Male 66.95 (66.15-67.75) Female 67.02 (66.31-67.73) Race/Ethnicity 0.17 White, non-Hispanic 67.10 (66.43-67.77) Black, non-Hispanic 68.39 (67.06-69.72) Asian, non-Hispanic 66.62 (64.41-68.83) Other, non-Hispanic 62.68 (58.37-65.99) Hispanic 66.33 (64.78-67.88) Education 0.02 <High school 67.08 (65.53-68.63) High school graduate 67.24 (66.26-68.22) >High school 66.88 (66.17-67.59) US region 0.10 Northeast 68.06 (66.75-69.37) Midwest 67.71 (66.59-68.83) South 66.72 (65.86-67.58) West 65.85 (64.56-67.14) Multimorbidity 0.26 0-1 diagnosis 71.38 (69.13-73.63) 2-4 diagnoses 67.65 (66.67-68.63) ≥5 diagnoses 66.28 (65.61-66.95) Insurance 0.33 Private 67.14 (66.49-67.79) Public 67.31 (66.29-68.33) Uninsured 60.59 (57.49-63.69) Baseline functional healthb 0.52 Low 63.33 (62.45-64.21) High 69.97 (69.31-70.64) HC = MEPS Household Component; SF-12 = 12-Item Short-Form Survey; SMD = standardized mean difference.
Note: Population mean and 95% CI of physician-patient relationship score among adults ≥18 years with office visits in 2015 and 2016, reflective of 83 million patients in 2015.
Source: Agency for Healthcare Research and Quality, Medical Expenditure Panel Survey, Longitudinal Panel (HC −193, 2015-2016) and Medical Conditions (HC −190, 2015).
↵a SMD between the 2 extremes in each category. Difference in means or proportions divided by SD; imbalance defined as absolute value >0.2 (small effect size).
↵b Functional health captured with the SF-12 instrument, cut at the population median.
- Table 3
Effect of Physician-Patient Relationship Change Trajectories on Functional Health Using Survey-Weighted, Covariate-Adjusted, Predicted Marginal Means Among a National Representative Cohort of US Adults With Office Visits in 2 Consecutive Years (n = 3,645, Representative of 83 Million US Adults), 2015-2016
Relationship MEPS Cohort n Functional Health (SF-12) Cohen Effect Estimate 2015 Mean (SD) 2016 Mean (SD) Change Mean (SD) 95% CI Effect Estimate 95% CI High → Better 1,208 97.90 (0.58) 98.94 (0.60) 1.04 (0.39) 0.29 to 1.80 0.08 0.02 to 0.13 High → Same 444 96.33 (0.83) 94.82 (0.85) –1.51 (0.64) –2.76 to –0.27 –0.11 –0.21 to 0.02 High → Worse 197 93.68 (1.58) 89.62 (1.49) –4.06 (0.88) –5.78 to –2.32 –0.33 –0.47 to –0.02 Low → Better 1,397 97.89 (0.62) 98.75 (0.61) 0.86 (0.46) –0.04 to 1.76 0.05 0 to 0.10 Low → Same 293 95.22 (0.99) 93.90 (1.12) –1.32 (0.78) –2.85 to 0.21 –0.10 –0.21 to 0.02 Low → Worse 106 93.82 (1.66) 91.39 (2.03) –2.43 (1.48) –5.33 to –0.47 –0.16 –0.35 to –0.03 HC = MEPS Household Component; MEPS = Medical Expenditure Panel Survey; MEPS-PC = MEPS Primary Care measure; SF-12 = 12-Item Short-Form Survey; US = United States.
Notes: Mean response for each factor, adjusted for all known confounders, including age, sex, race/ethnicity, educational attainment, insurance status, multimorbidity, and US region using survey-weighted predicted marginal means. Relationship is operationalized using the MEPS-PC Relationship composite measure and cut into 6 trajectories based on 2015 score (high or low) and 2016 score (better, same, worse). High Relationship score in 2015 denotes ≥ median Relationship score at baseline (69.23), whereas Low Relationship score denotes < the population median Relationship score at baseline. Better in 2016 reflects a 1-year change in Relationship score ≥ 0.5 SD; Worse reflects a 1-year change greater than −0.5 SD, and change in either direction < 0.5 SD d enotes Same. The SD for Relationship in 2015 was 13.35. Statistical difference between 3 of 15 pairwise comparisons using Tukey pairwise multiple comparison procedures (P = .05, not adjusted for multiple testing [Bonferroni]): High→Same and High→Better, High→Worse and High→Better, Low→Better and Low→Worse. Borderline significance (P < .10) for High→Worse and High→Same, Low→Better and High→Same, Low→Same and Low→Better.
Source: Agency for Healthcare Research and Quality, Medical Expenditure Panel Survey, Longitudinal Panel (HC-193, 2015-2016) and Medical Conditions (HC-190, 2015).
Supplemental Appendix
Supplemental Appendix
Files in this Data Supplement:
In this issue


Jump to section
Related Articles
Cited By...
- No citing articles found.