
Article Figures & Data
Figures
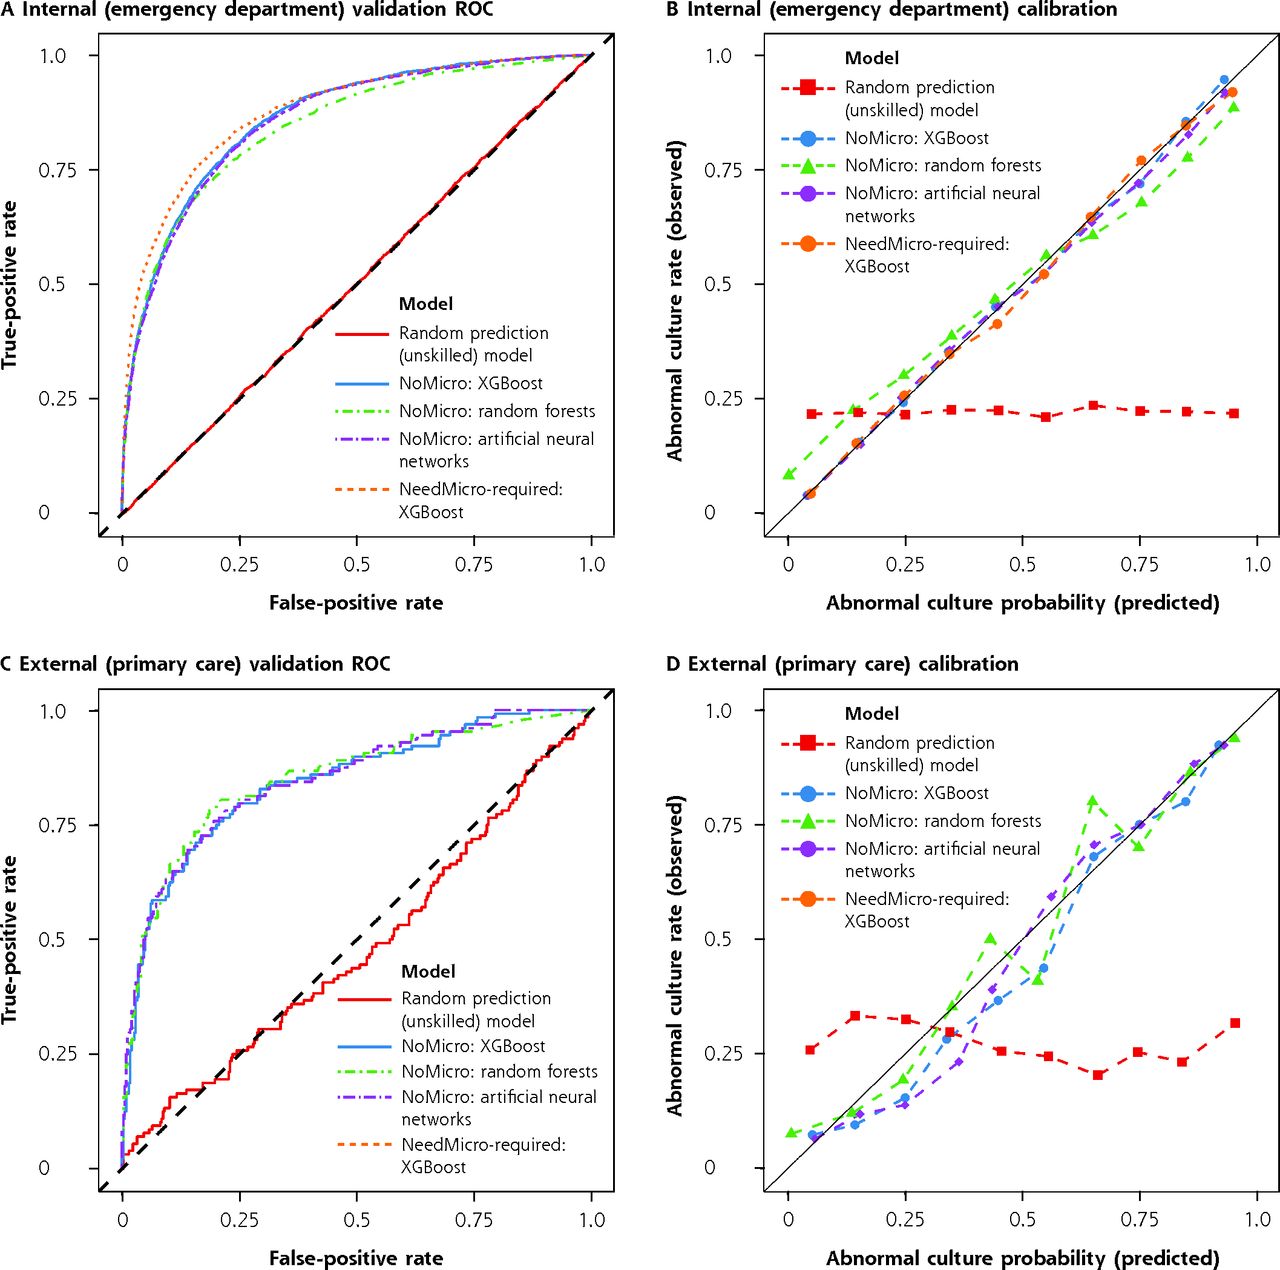
- Figure 1.
Discriminative performance and calibration of models under internal and external validation.
ROC = receiver operating characteristic; XGBoost = extreme gradient boosting.
Note: ROC (panels A and C) and calibration curves (panels B and D) for internal (emergency department, panels A-B) and external (primary care, panels C-D) validations. For internal validation, the NoMicro and NeedMicro models were evaluated. For external validation, only the NoMicro models were evaluated because microscopy is not routinely available in the primary care setting. Better models have ROC curves deflected away from the midline and toward the upper left corner. Well-calibrated models should lie along the diagonal line. The performance of unskilled classifiers (which return random results) were also simulated and are shown for comparison.
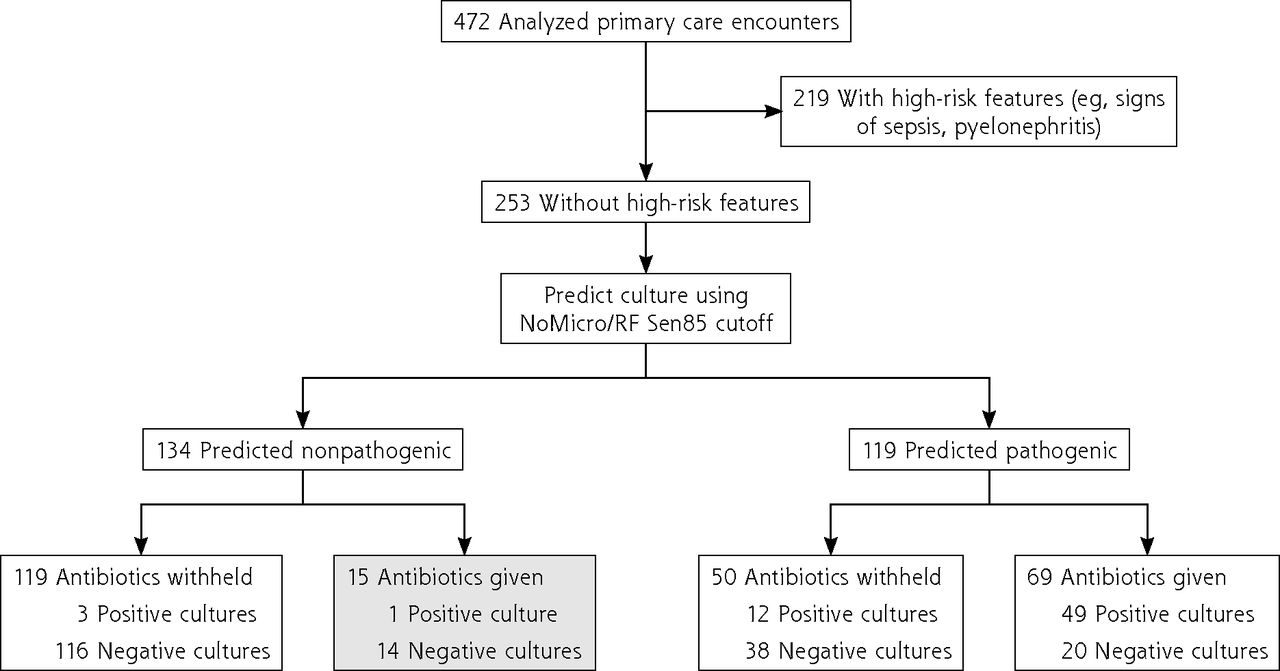
- Figure 2.
Evaluation of the potential of NoMicro to decrease antibiotic overuse (random forests).
RF = random forests; Sen85 = threshold obtained by requiring the greatest specificity such that sensitivity is >85% (ie, false-negative rate is <15%).
Note: Of 472 primary care encounters, 253 lacked high-risk features for progression to serious illness and were stratified using the NoMicro/Random Forests classifier at the Sen85 cutoff (false-negative rate 15%). These predictions were correlated with physician antibiotic prescribing behavior (made without the benefit of the NoMicro/RF model). The shaded box represents cases for which the NoMicro/RF model predicts the culture to be nonpathogenic but for which physicians nevertheless prescribed antibiotics; almost all cultures in this group were negative. Antibiotic overuse might be decreased by withholding antibiotics for this group.

Tables
Characteristic Primary Care Emergency Department Total Training Validation No. 472 80,387 64,310 16,077 Urine culture pathogenicity, No. (%) Pathogenic 128 (27.1) 18,284 (22.7) 14,718 (22.9) 3,566 (22.2) Nonpathogenic 344 (72.9) 62,103 (77.3) 49,592 (77.1) 12,511 (77.8) Age, y, No. (%) 18-25 51 (10.8) 10,052 (12.5) 8,077 (12.6) 1,975 (12.3) 26-35 87 (18.4) 11,891 (14.8) 9,455 (14.7) 2,436 (15.2) 36-45 85 (18.0) 9,450 (11.8) 7,525 (11.7) 1,925 (12.0) 46-55 59 (12.5) 12,255 (15.2) 9,825 (15.3) 2,430 (15.1) 56-65 90 (19.1) 10,327 (12.8) 8,230 (12.8) 2,097 (13.0) 66-75 67 (14.2) 9,214 (11.5) 7,380 (11.5) 1,834 (11.4) >75 33 (7.0) 17,198 (21.4) 13,818 (21.5) 3,380 (21.0) Gender, No. (%) Male 64 (13.6) 24,584 (31.0) 19,648 (31.0) 4,936 (31.1) Female 408 (86.4) 54,725 (69.0) 43,803 (69.0) 10,922 (68.9) Not reported NA 1,078 859 219 Race, No. (%) Asian 23 (4.9) 860 (1.1) 688 (1.1) 172 (1.1) Black 160 (34.0) 17,003 (21.9) 13,541 (21.8) 3,462 (22.3) White 211 (44.8) 43,156 (55.5) 34,596 (55.6) 8,560 (55.1) Other/multiple 77 (16.3) 16,735 (21.5) 13,402 (21.5) 3,333 (21.5) Not reported 1 2,633 2,083 550 Ethnicity, No. (%) Hispanic, Latine, Spanish origin 58 (12.3) 17,064 (21.6) 13,634 (21.6) 3,430 (21.7) Not Hispanic, Latine, Spanish origin 412 (87.7) 61,826 (78.4) 49,474 (78.4) 12,352 (78.3) Not reported 2 1,497 1,202 295 Note: Percentages reflect the proportion of reported values (ie, excluding not reported).
- Table 2.
Discriminative Performance (ROC-AUC), Calibration, and Brier Scores for the NoMicro and NeedMicro Predictive Models Under Internal (Emergency Department) and External (Primary Care) Validation
Model ROC-AUC (95% CIa) Calibration Decile Linear
Fit R2 (95% CIa)Scaled Brier Score (95% CIa) Primary Careb Emergency
DepartmentcPrimary Careb Emergency
DepartmentcPrimary Careb Emergency
DepartmentcNoMicro/XGB 0.84 (0.8-0.88) 0.86 (0.86-0.87) 0.98 (0.83-0.98) >0.99 (0.99-1.0) 0.34 (0.25-0.42) 0.34 (0.33-0.36) NoMicro/RF 0.85 (0.81-0.89) 0.85 (0.84-0.85) 0.94 (0.77-0.97) >0.99 (0.98-1.0) 0.37 (0.27-0.46) 0.3 (0.28-0.32) NoMicro/ANN 0.85 (0.81-0.89) 0.86 (0.85-0.86) 0.97 (0.86-0.98) >0.99 (0.99-1.0) 0.35 (0.26-0.43) 0.33 (0.32-0.35) NeedMicro/XGB NAd 0.88 (0.87-0.88) NAd >0.99 (0.99-1.0) NAd 0.4 (0.38-0.42) ANN = artificial neural networks; AUC = area under the curve; NA = not applicable; R2 = coefficient of determination; RF = random forests; ROC = receiver operating characteristic; XGB = extreme gradient boosting (XGBoost).
↵a Estimate and 95% CI values across 2,000 stratified (by pathogenicity) bootstrap replicates using the percentage method.
↵b External validation on the primary care data set.
↵c Internal validation on the emergency department data set.
↵d The NeedMicro classifier cannot be validated on the primary care data set because urine microscopy data are not available for almost all records.
- Table 3.
Cutoff-Varying Performance Metrics: Sensitivity, Specificity, Positive Predictive Value, Negative Predictive Value, Likelihood Ratios, and Diagnostic Odds Ratio
Model Threshold Performance Metric Estimate, % (95% CIa) Performance Metric Estimate, % (95% CIa) Sensitivity Specificity PPV NPV LR+ LR− DOR External validation: primary care data set NoMicro/XGB Best 72.7 (64.8-80.5) 82.8 (78.8-86.9) 61.2 (55.3-67.7) 89.1 (86.2-92.0) 4.24 (3.32-5.62) 0.33 (0.24-0.43) 12.8 (8.1-21.5) NoMicro/RF Best 78.9 (71.9-85.2) 81.4 (77.6-85.5) 61.2 (56.0-67.3) 91.2 (88.4-93.8) 4.24 (3.42-5.53) 0.26 (0.18-0.35) 16.4 (10.2-28.4) NoMicro/ANN Best 78.1 (71.1-85.2) 78.2 (73.5-82.6) 57.1 (51.8-62.7) 90.6 (87.8-93.3) 3.58 (2.89-4.52) 0.28 (0.19-0.37) 12.8 (8.3-21.5) NoMicro/XGB Sen85 85.2 (78.9-90.6) 62.8 (57.6-68.0) 46.0 (42.5-50.0) 91.9 (88.9-95.0) 2.29 (1.99-2.69) 0.24 (0.14-0.34) 9.7 (6.1-17.9) NoMicro/RF Sen85 85.2 (78.9-90.6) 66.0 (60.8-70.9) 48.2 (44.1-52.6) 92.3 (89.1-95.1) 2.50 (2.12-2.98) 0.23 (0.14-0.33) 11.1 (6.6-20.0) NoMicro/ANN Sen85 85.2 (78.9-90.6) 59.6 (54.1-64.5) 44.0 (40.3-47.7) 91.5 (88.1-94.7) 2.11 (1.82-2.45) 0.25 (0.15-0.36) 8.5 (5.1-15.5) Internal validation: emergency department data set NoMicro/XGB Best 80.0 (78.7-81.3) 76.3 (75.6-77.1) 49.1 (48.2-50.0) 93.0 (92.6-93.5) 3.38 (3.27-3.50) 0.26 (0.25-0.28) 12.9 (11.7-14.2) NoMicro/RF Best 70.6 (69.1-72.0) 83.1 (82.4-83.8) 54.4 (53.2-55.5) 90.8 (90.4-91.3) 4.18 (3.99-4.38) 0.35 (0.34-0.37) 11.8 (10.8-12.9) NoMicro/ANN Best 78.6 (77.2-79.9) 77.3 (76.6-78.1) 49.7 (48.8-50.6) 92.7 (92.2-93.1) 3.47 (3.35-3.59) 0.28 (0.26-0.3) 12.5 (11.5-13.7) NeedMicro/XGB Best 76.1 (74.6-77.5) 83.7 (83.0-84.3) 57.1 (56.0-58.1) 92.5 (92.0-92.9) 4.66 (4.47-4.87) 0.29 (0.27-0.3) 16.3 (14.9-17.8) NoMicro/XGB Sen85 85.0 (83.8-86.1) 70.5 (69.7-71.3) 45.1 (44.3-45.8) 94.3 (93.9-94.7) 2.88 (2.79-2.97) 0.21 (0.2-0.23) 13.6 (12.3-15.0) NoMicro/RF Sen85 85.1 (83.9-86.2) 64.4 (63.6-65.3) 40.6 (39.9-41.2) 93.8 (93.3-94.3) 2.39 (2.33-2.46) 0.23 (0.21-0.25) 10.3 (9.4-11.4) NoMicro/ANN Sen85 85.0 (83.8-86.2) 69.5 (68.7-70.3) 44.3 (43.5-45.0) 94.2 (93.8-94.7) 2.79 (2.71-2.87) 0.22 (0.2-0.23) 12.9 (11.7-14.3) NeedMicro/XGB Sen85 85.0 (83.8-86.2) 73.1 (72.4-73.9) 47.4 (46.6-48.2) 94.5 (94.1-94.9) 3.17 (3.07-3.27) 0.21 (0.19-0.22) 15.5 (14.1-17.1) ANN = artificial neural networks; Best = threshold maximizing the Youden index (sensitivity + specificity − 1); DOR = diagnostic odds ratio (ratio of LR+ to LR−); LR− = negative likelihood ratio;
LR+ = positive likelihood ratio; NPV = negative predictive value; PPV = positive predictive value; RF = random forests; Sen85 = threshold obtained by requiring the greatest specificity such that sensitivity is >85% (ie, false negative rate is <15%); XGB = extreme gradient boosting (XGBoost).
↵a Estimate and 95% CI values across 2,000 stratified bootstrap replicates using the percentage method.
SUPPLEMENTAL MATERIALS IN PDF FILE BELOW
- Parente.pdf -
PDF file
- Parente.pdf -
In this issue


Jump to section
Related Articles
Cited By...
- No citing articles found.