
Article Figures & Data
Tables
- Table 1.
Survey Responder Characteristics by Hospital of Practice (Hospital Presence of Family Medicine Physicians and/or Obstetricians)
Overall (N = 849) Both (n = 527) FM-Only (n = 150) OB-Only (n = 172) P Valuea Role, No. (%) <.0001 Labor and delivery nurse 569 (67) 329 (62.4) 103 (68.7) 137 (79.7) Obstetrician 98 (11.5) 74 (14) 0 (0) 24 (14) Certified nurse midwife 35 (4.1) 31 (5.9) 3 (2) 1 (0.6) Family medicine physician 78 (9.2) 52 (9.9) 26 (17.3) 0 (0) Anesthesiologist 20 (2.4) 18 (3.4) 1 (0.7) 1 (0.6) Nurse educator 15 (1.8) 12 (2.3) 2 (1.3) 1 (0.6) Nurse manager/director 34 (4) 11 (2.1) 15 (10) 8 (4.7) Race/ethnicity, No. (%) .49 American Indian/Alaska Native 1 (0.1) 1 = (0.2) 0 (0) 0 (0) Asian/Pacific Islander 12 (1.4) 11 (2.1) 0 (0) 1 (0.6) Black/African American 3 (0.4) 3 (0.6) 0 (0) 0 (0) Hispanic/Latine 12 (1.4) 6 (1.1) 1 (0.7) 5 (2.9) White (non-Hispanic) 782 (92.7)b 478 (91.6)b 144 (96) 160 (93) Prefer not to say 28 (3.3) 19 (3.6) 4 (2.7) 5 (2.9) Other (includes multirace) 6 (0.7) 4 (0.8) 1 (0.7) 1 (0.6) Gender, No. (%) .40 Female 764 (90) 467 (88.6) 136 (90.7) 161 (93.6) Male 75 (8.8) 51 (9.7) 14 (9.3) 10 (5.8) Nonbinary/third gender 1 (0.1) 1 (0.2) 0 (0) 0 (0) Prefer not to say 9 (1.1) 8 (1.5) 0 (0) 1 (0.6) Years working on labor and delivery at this hospital, median (IQR) 6 (2-14) 6 (2-14) 7 (2-14) 6 (2-19) .48 Years practicing maternity care independently, median (IQR) 7 (3-16) 7 (2-16) 7 (3-15) 9 (3-19) .29 Years working in maternity care, median (IQR) 9 (4-19) 9 (4-19) 9 (4-18) 9 (4-20) .80 - Table 2.
Hospital Characteristics by Family Medicine and Obstetrician Presence on Labor and Delivery
Overall (N = 39) Both (n = 15) FM-Only (n = 13) OB-Only (n = 11) P Valuea NTSV cesarean birth rate, mean (SD) 0.25 (0.08) 0.28 (0.05) 0.23 (0.10) 0.23 (0.08) .145 % Maternal age >35 years, mean (SD) 0.09 (0.02) 0.11 (0.02) 0.08 (0.02) 0.10 (0.02) .002 % Maternal BMI >30, mean (SD) 0.32 (0.05) 0.33 (0.04) 0.33 (0.06) 0.30 (0.05) .30 % Medicaid insurance, mean (SD) 0.41 (0.10) 0.43 (0.09) 0.42 (0.07) 0.37 (0.13) .57 Rural status, No. (%) .001 Nonrural 17 (43.6) 10 (66.7) 0 (0) 7 (63.6) Rural 22 (56.4) 5 (33.3) 13 (100) 4 (36.4) Teaching hospital, No. (%) .01 No 29 (74.4) 7 (46.7) 12 (92.3) 10 (90.9) Yes 10 (25.6) 8 (53.3) 1 (7.7) 1 (9.1) Nursery acuity level, No. (%)b .04 Basic/well newborn 18 (58.1) 4 (30.8) 9 (90) 5 (62.5) Special care 7 (22.6) 3 (23.1) 1 (10) 3 (37.5) NICU 5 (16.1) 5 (38.5) 0 (0) 0 (0) Regional NICUb 1 (3.2) 1 (7.7) 0 (0) 0 (0) Maternal care level, No. (%)c,d .01 1 13 (43.3) 2 (16.7) 9 (90) 2 (25) 2 13 (43.3) 6 (50) 1 (10) 6 (75) 3 2 (6.7) 2 (16.7) 0 (0) 0 (0) 4 2 (6.7) 2 (16.7) 0 (0) 0 (0) Average annual delivery volume, No. (%) .04 <1,000 29 (74.4) 9 (60) 13 (100) 7 (63.6) 1,000-2,499 7 (17.9) 3 (20) 0 (0) 4 (36.4) ≥2,500 3 (7.7) 3 (20) 0 (0) 0 (0) County-level maternity care access, No. (%) .002 Access 23 (59) 11 (73.3) 3 (23.1) 9 (81.8) Moderate access 15 (38.5) 4 (26.7) 10 (76.9) 1 (9.1) Deserte 1 (2.6) 0 (0) 0 (0) 1 (9.1) BMI = body mass index; FM = family medicine; NICU = neonatal intensive care unit; NTSV = nulliparous, term, singleton, vertex; OB = obstetrician.
↵a P values calculated using nonparametric Kruskal-Wallis test for continuous variables and χ2 or Fisher exact test for categorical variables.
↵b Missing (n = 8).
↵c Iowa-specific maternal care level designations.22
↵d Missing (n = 9).
↵e Maternity care desert designation by county.9
- Table 3.
Characteristics of FM Physicians in FM-Only Hospitals vs Hospitals With Both Obstetrician and FM Physicians
Overall (N = 78) Both (n = 52) FM-Only (n = 26) P Valuea Race/ethnicity, No. (%) .38 American Indian/Alaska Native 0 (0) 0 (0) 0 (0) Asian/Pacific Islander 3 (4.1) 3 (5.9) 0 (0) Black/African American 1 (1.4) 1 (2) 0 (0) Hispanic/Latine 0 (0) 0 (0) 1 (3.8) White (non-Hispanic) 63 (86.3)b 42 (82.4) 23 (88.5) Prefer not to say 6 (8.2)b 5 (9.8) 2 (7.7) Other (includes multiracial) 0 (0) 0 (0) 0 (0) Gender, No. (%) .42 Female 41 (55.4) 30 (57.7) 13 (50) Male 31 (41.9) 20 (38.5) 13 (50) Nonbinary/third gender 0 (0) 0 (0) 0 (0) Prefer not to say 2 (2.7) 2 (3.8) 0 (0) Years working on labor and delivery at this hospital, median (IQR) 4 (2-16) 4 (2-12) 9 (3-19) .16 Years practicing maternity care independently, median (IQR) 6 (1-19) 4 (0-16) 12 (4-21) .04 Years working in maternity care, median (IQR) 8 (4-19) 7 (2-17) 13 (7-22) .01 - Table 4.
Hospital Delivery Volumes by Provider Presence Category for Hospitals With <1,000 Deliveries per Year, for 2020
Hospitals With No. Median Lower Quartile Upper Quartile Minimum Maximum Both FM & OB 9 505 212 704 53 950 FM-only 13 127 92 237 54 585 OB-only 7 474 303 696 227 873 FM = family medicine; OB = obstetrician.
- Table 5.
Association of Hospital NTSV Cesarean Birth Rate and Hospital Type (Presence of Both FM & OB, FM-Only, and OB-Only) Delivery Volume <1,000
Hospitals With Estimate (95% CI) P Value Estimate (95% CI)a 1 – aIRRb P Value Both FM & OB reference reference FM-only −0.30 (−0.49 to −0.12) .0012 −0.42 (−0.64 to −0.20) 34.3% .0002 OB-only −0.13 (−0.28 to 0.02) .0888 −0.13 (−0.30 to 0.03) 13.0% .111 aIRR = adjusted incident rate ratio; BMI = body mass index; FM = family medicine; NTSV = nulliparous, term, singleton, vertex; OB = obstetrician.
↵a Model adjusted for geographic location, maternal % BMI >30, maternal % age >35 years, and maternal % Medicaid as primary insurance.
↵b The adjusted incident rate ratio was subtracted from 1 to obtain the expected relative reduction in NTSV cesarean births for hospitals with FM only or OB only compared with both FM & OB.
Both OB & FM (N = 329) Mean (95% CI) FM-Only (n = 103) Mean (95% CI) OB-Only (n = 137) Mean (95% CI) P Valuea Best practices 3.37 (3.33-3.42) 3.31 (3.23-3.40) 3.27 (3.20-3.34) .047b Fear of vaginal birth 1.37 (1.32-1.42) 1.31 (1.22-1.40) 1.32 (1.25-1.40) .14 Physician oversight 3.31 (3.26-3.37) 3.33 (3.23-3.42) 3.29 (3.20-3.38) .87 Maternal agency 2.88 (2.81-2.95) 3.04 (2.91-3.16) 2.85 (2.75-2.95) .05 Overestimation of cesarean safety 1.91 (1.86-1.96) 1.85 (1.75-1.94) 1.91 (1.83-1.99) .49 Unit normsc 2.91 (2.87-2.96) 3.05 (2.98-3.13) 2.93 (2.86-2.99) .007d,e Vaginal birth microculture 3.00 (2.95-3.05) 3.12 (3.04-3.20) 3.02 (2.95-3.09) .03d Safety culture 2.76 (2.71-2.82) 2.94 (2.84-3.04) 2.77 (2.69-2.84) .002d,e FM = family medicine; OB = obstetrician.
↵a Kruskal-Wallis test followed by the pairwise 2-sided multiple comparison analysis Dwass-Steel-Critchlow-Fligner method.
↵a Comparing both vs OB only.
↵c Unit norms contains 2 subscales measuring latent constructs that fall within the overall larger scale, vaginal birth microculture and safety culture.30
↵d Comparing FM only vs both.
↵c Comparing FM only vs OB only.
Additional Files
SUPPLEMENTAL DATA IN PDF FILE BELOW
Supplemental Table 1. Family physicians' attitudes in Both vs only-FM hospitalsSupplemental Table 2. Obstetricians' attitudes in Both vs only-OB hospitalsSupplemental Table 3. Hospital characteristics by county-level of maternity care access
- WhiteVanGompel_Supp.pdf -
PDF file
- WhiteVanGompel_Supp.pdf -
VISUAL ABSTRACT IN PNG FILE BELOW
- VanGompel_Final_VA.png -
PNG file
- VanGompel_Final_VA.png -
PLAIN LANGUAGE ARTICLE SUMMARY
Original Research
Family Physicians Associated With Lower Cesarean Rates and Higher Culture of Safety in Rural Hospitals
Background and Goal: The U.S. is currently experiencing a maternal health crisis, particularly in rural areas where access to pregnancy care is diminishing. This issue is compounded by rising rates of severe maternal morbidity and mortality. Family physicians often fill critical gaps in care in rural areas where obstetricians are scarce. This study aimed to examine how the presence of family physicians in rural hospitals impacts cesarean delivery rates and the overall quality of care during childbirth.
Study Approach:The study analyzed data from rural hospitals in Iowa. Researchers collected survey responses from clinicians including nurses, obstetricians, and family physicians, about their attitudes and practices related to childbirth. These responses were linked with hospital data on cesarean delivery rates, patient demographics, and other factors. The study compared hospitals where only family physicians provide care, hospitals with both family physicians and obstetricians, and hospitals with only obstetricians.
Main Results:A total of 849 clinicians from 39 hospitals completed the survey: 13 family medicine-only, 11 obstetrician-only, and 15 hospitals with both. All family medicine-only hospitals were rural with fewer than 1,000 annual births.
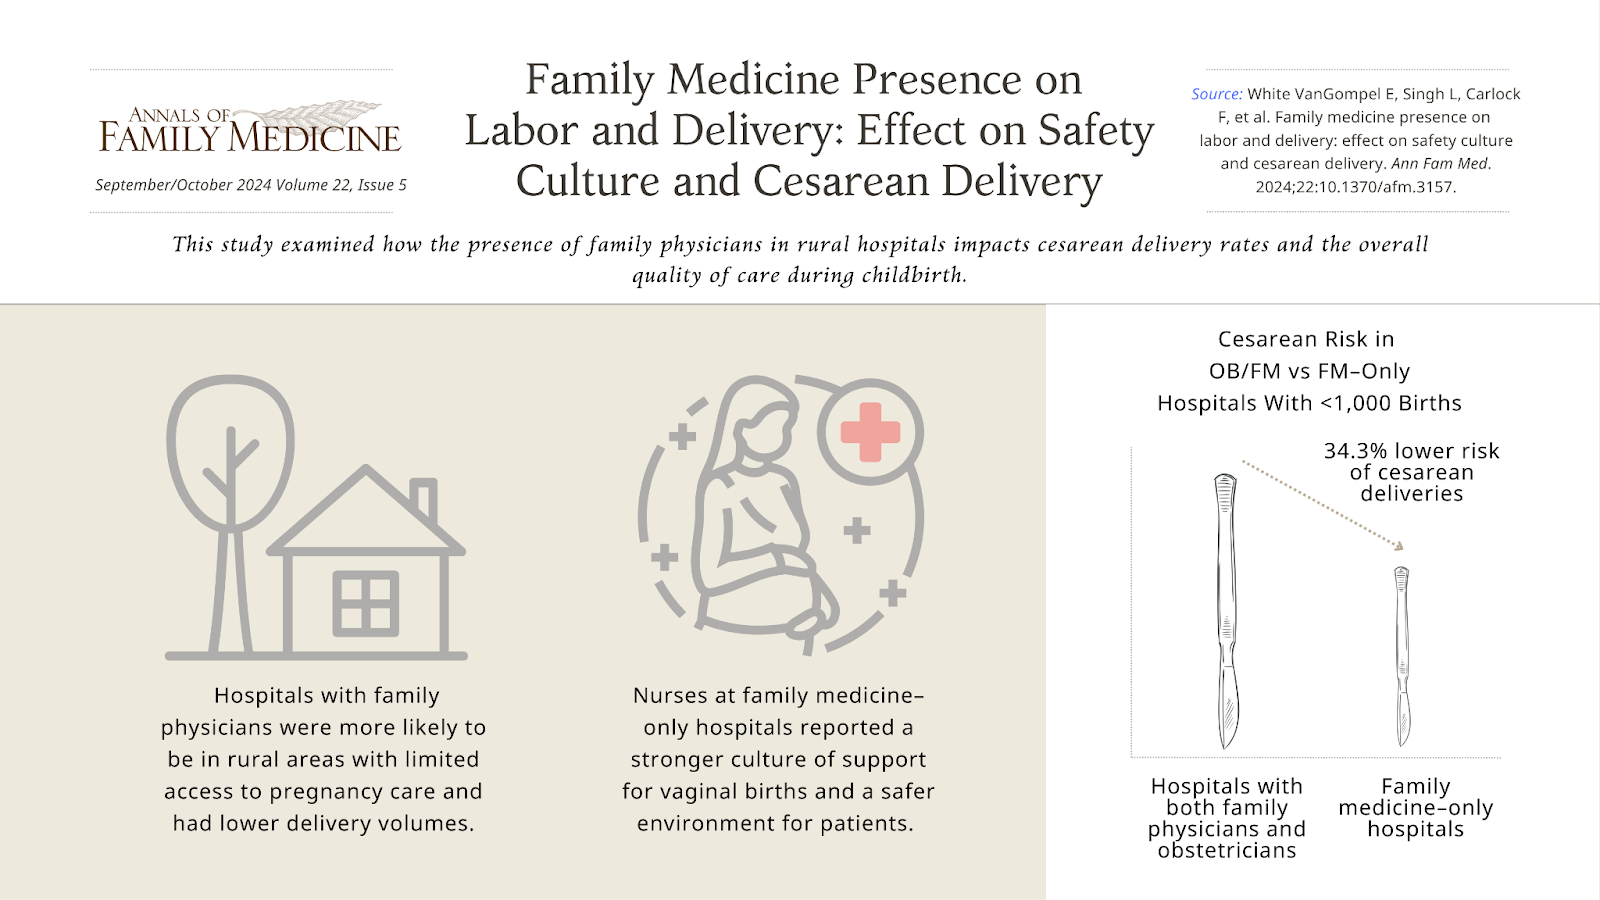
• Among hospitals with fewer than 1,000 annual births, births at family medicine–only hospitals had a 34.3% lower risk of cesarean deliveries compared to hospitals with both family physicians and obstetricians.
• Nurses at family medicine-only hospitals reported a stronger culture of support for vaginal births and a safer environment for patients.
• Hospitals with family physicians were more likely to be in rural areas with limited access to pregnancy care and had lower delivery volumes.Why It Matters: Family physicians play an important role in providing high-quality pregnancy care in rural areas, where access to specialized obstetric care is limited. The findings of this study suggest that family physicians contribute to lower cesarean delivery rates and a supportive culture for vaginal births, which are key indicators of maternal care quality. Ensuring that family physicians continue to be trained and supported in providing pregnancy care is vital for maintaining and improving maternal health outcomes in underserved rural communities.
Family Medicine Presence on Labor and Delivery: Effect on Safety Culture and Cesarean Delivery
Emily White VanGompel, MD, MPH, et al
Department of Family and Community Medicine, University of Illinois at Chicago College of Medicine, Chicago, Illinois
Visual abstract showcasing key findings from this study:


