
Abstract
PURPOSE Risk functions can help general practitioners identify patients at high cardiovascular risk, but overprediction inevitably leads to a disproportionate number of patients being targeted for treatment. To assess predicted cardiovascular risk, we analyzed the 10-year performance of the original and REGICOR Framingham coronary risk functions in nondiabetic patients.
METHODS Ours was a longitudinal, observational study of a retrospective cohort of patients observed for 10 years in primary care practices in Badajoz, Spain. Our cohort comprised 447 nondiabetic patients aged 35 to 74 years who had no evidence of cardiovascular disease and were not on lipid-lowering or antihypertensive therapy. We assessed the patients’ 10-year coronary risk measurement from the time of their recruitment. We also estimated the percentage of patients who were candidates for antihypertensive and lipid-lowering therapy.
RESULTS The actual incidence rate of coronary events was 6.7%. The original Framingham equation overpredicted risk by 73%, whereas the REGICOR Framingham function underpredicted risk by 64%. The Brier scores were 0.06364 and 0.06093 (P = .365) for the original Framingham and REGICOR Framingham functions, respectively, and the remaining discrimination and calibration parameters were also highly similar for both functions. The original Framingham function classified 14.8% of the population as high risk and the REGICOR Framingham function classified 6.9%. The proportions of patients who, according to the original Framingham and REGICOR functions, would be candidates for lipid-lowering therapy were 14.3% and 6.7%, and for antihypertensive therapy they were 12.5% and 7.8%, respectively.
CONCLUSION The original Framingham equation overestimated coronary risk whereas the REGICOR Framingham function underestimated it. The original Framingham function selected a greater percentage of candidates for antihypertensive and lipid-lowering therapy.
- Cardiovascular risk functions
- coronary disease
- REGICOR risk chart
- Framingham function
- hypolipidemic agents
- antihypertensive agents
INTRODUCTION
Cardiovascular diseases are an important health concern in the developed world. In Europe, they are the leading cause of death,1 with slightly less than one-third of all deaths attributed to cardiovascular diseases in 2004.2 Their incidence is high,3 they are a major source of disability, and they have a great impact on the costs of social and health care.
Risk prediction models can play an important role in decision making and future management of individual or groups of patients with a particular medical condition.4 Such models are designed to estimate the probability of a patient developing some clinical event based on certain key known risk factors.5 Numerous multivariable scoring functions have been developed to estimate a patient’s 10-year risk of cardiovascular disease. When ischemic heart disease with its associated mortality and morbidity is considered, one speaks of coronary risk. The main utility of calculating cardiovascular risk is to aid in clinical decision making by identifying high-risk patients in primary health care. These patients, together with those who already have arteriosclerosis, would benefit most from lipid-lowering or antihypertensive therapy to reduce their cardiovascular morbidity and mortality.
In Spain, as elsewhere in Europe, the risk of coronary disease has been calculated on the basis of the long-established Framingham function,6–10 even though it has been found to overestimate the risk in some populations.11–14 For this reason, it is recommended that the function should be calibrated and validated on large populations representative of each country’s reality.11–17
In this context, various systems have been used to calculate cardiovascular risk in our country, an example being the Framingham coronary risk tables (REGICOR).18 This function has been validated using patient data from 67 Spanish primary care centers that volunteered to participate in the study.19 Performance and predictive capacity of the Framingham equations have been analyzed with different results.14,20,21 Framingham functions yield prediction for patients when they are not treated with lipid-lowering or antihypertensive therapy; however, a substantial fraction of patients are included in these studies even though they are being treated.14,19–21 One would expect inclusion of treated patients to lower the risk of cardiovascular disease (that is, of course, why treatment is offered), and for this reason alone, it should be expected that the prediction models are overestimating risk as they pertain to an untreated population. Accordingly, for risk communication and individual decisions, cardiovascular risk should be based on study populations that do not receive additional treatment for cardiovascular disease.22
Given this background, the study was designed with the following objectives: (1) to compare the performance of the original and REGICOR Framingham functions10,18 for predicting 10-year risk of coronary events in nondiabetic patients aged 35 to 74 years who are cared for in a health care center and who are not on lipid-lowering or antihypertensive therapy; and (2) to estimate how many patients would be prescribed lipid-lowering and antihypertensive drugs according to those functions.
METHODS
The design of the present work was an observational longitudinal study of a retrospective cohort of 1,011 patients aged 35 to 74 years who had no preexisting cardiovascular disease. These patients made up 9% of the total population of this primary health care center age-group and had attended the center for the previous 10 years. The criterion for inclusion in the study cohort was that their medical history included, before January 1995, the variables necessary to estimate their coronary risk with the original Framingham function10 and the Framingham function calibrated for the Spanish population (Framingham-REGICOR).18 The diabetic population was not included because diabetes is now considered a coronary heart disease risk equivalent. Additional recorded patient data included glucose, triglycerides, total cholesterol, low-density lipoprotein (LDL) cholesterol, high-density lipoprotein (HDL) cholesterol, weight, and height, as well as the laboratory variables needed to estimate the glomerular filtration rate (GFR) by applying the Cockcroft-Gault formula corrected for body surface area, and the simplified Modification of Diet in Renal Disease (MDRD) Study formula. The cardiovascular events investigated were those included in the calculation of total coronary risk (angina and myocardial infarction, fatal and nonfatal). The deaths from other causes were considered censoring events, such that only time to cardiovascular event or censoring is considered in the calculation of the time at risk. For all the patients in the study, calculations were made of their coronary risk at 10 years from the time of their recruitment, using the tables based on the original and REGICOR Framingham functions.10,18
Statistical Analysis
The statistics used as representative of the sample for the univariate descriptive analysis were the mean and standard deviation for normal distributions, the median and quartile 1-to-3 range for nonnormal distributions, and the observed frequencies and proportions for categorical variables. The normal distribution of the variables was verified by normality plots. In the bivariate analyses, a t test for independent samples was used for normally distributed quantitative variables, a nonparametric Mann-Whitney U test for nonnormal variables, and a χ2 test or Fisher’s exact test for categorical variables. Because of the many statistical tests performed, the minimum significance level was taken to be P <.01.
To assess calibration (ie, the degree of similarity between predicted and observed risks), we calculated the predicted mean of coronary risk at 10 years and compared it with the observed occurrence of coronary events in the 10-year follow-up period. The Brier score was calculated as the average squared deviation between predicted and observed risks and taken as a measure of accuracy. A lower value represents higher accuracy.
We calculated the area under the receiver operating characteristic curve (AUROC) statistic to assess discrimination (ie, the ability of the risk prediction model to differentiate between patients who experience a coronary event during the study and those who do not); a value of 1 represents perfect discrimination.
The parameters used to analyze the validity of the different risk functions as tools for screening for coronary risk were the sensitivity (S), specificity (E), positive/negative predictive values (PPV/NPV), and positive/negative likelihood ratios (PLR/NLR). The results are presented as overall summary estimates together with 95% confidence intervals.
The diagnostic utility of the functions was evaluated as the odds ratio,23 calculated as follows:
An odds ratio of greater than 20 is characteristic of useful diagnostic tests.
Patients were considered to be of high coronary risk if they scored 20% or greater or 10% or greater in the original or REGICOR Framingham tables, respectively.
To estimate the percentage of patients who are candidates for drug therapy (antihypertensive or lipid-lowering), we applied the original European guidelines24 and their Spanish translation and adaptation.25
The data were processed and analyzed using the software packages SPSS for Windows 15.0 (SPSS Inc, Chicago, Illinois) and Epi Info 6.04 (Centers for Disease Control and Prevention, Atlanta, Georgia).
RESULTS
Of the cohort of 1,011 nondiabetic patients aged 35 to 74 years, 447 were not on lipid-lowering or antihypertensive therapy and were included in the study. Table 1 lists the general characteristics of the study population. In particular, the mean age was 52.4 years, 55.0% were women, the mean body mass index was 27.6 kg/m2, 27.5% of the patients were smokers and 27.3% had arterial hypertension. The women were older, a lower percentage were smokers, and they had higher mean HDL cholesterol values, lower triglyceride levels, and a lower GFR estimated by the MDRD or the Cockcroft-Gault formulas. The mean coronary risk was moderate using the original Framingham (11.6%) and low using the calibrated REGICOR (4.3%) functions. A total of 30 patients (22 men and 8 women) had at least 1 coronary event during the follow-up of the cohort.
There were 4.3% of studied patients who died during the follow-up period (8.0% of men and 1.2% of women). Deaths from cardiovascular origin accounted for 33.3% and 18.8% of total mortality in women and men, respectively. Ischemic heart disease predominated over cerebrovascular disease.
Table 2 displays discrimination and calibration performance data for the original Framingham and REGICOR Framingham functions. The Brier score was lower (ie, more accurate) for REGICOR Framing-ham function (0.06093) compared with the original Framingham function (0.06364), but the differences were not significant (P = .365). The original Framingham function overpredicted risk by 73%, whereas the REGICOR Framingham function underpredicted risk by 64%. The diagnostic odds ratios, the AUROC, PLR, and NLR figures were similar for the original and REGICOR Framingham functions (Table 2).
Baseline Characteristics of the Cohort of Patients Studied
Discrimination, Calibration, and Validity Statistics for Predicted 10-year Risk of Cardiovascular Disease by REGICOR and Original Framingham Risk Functions

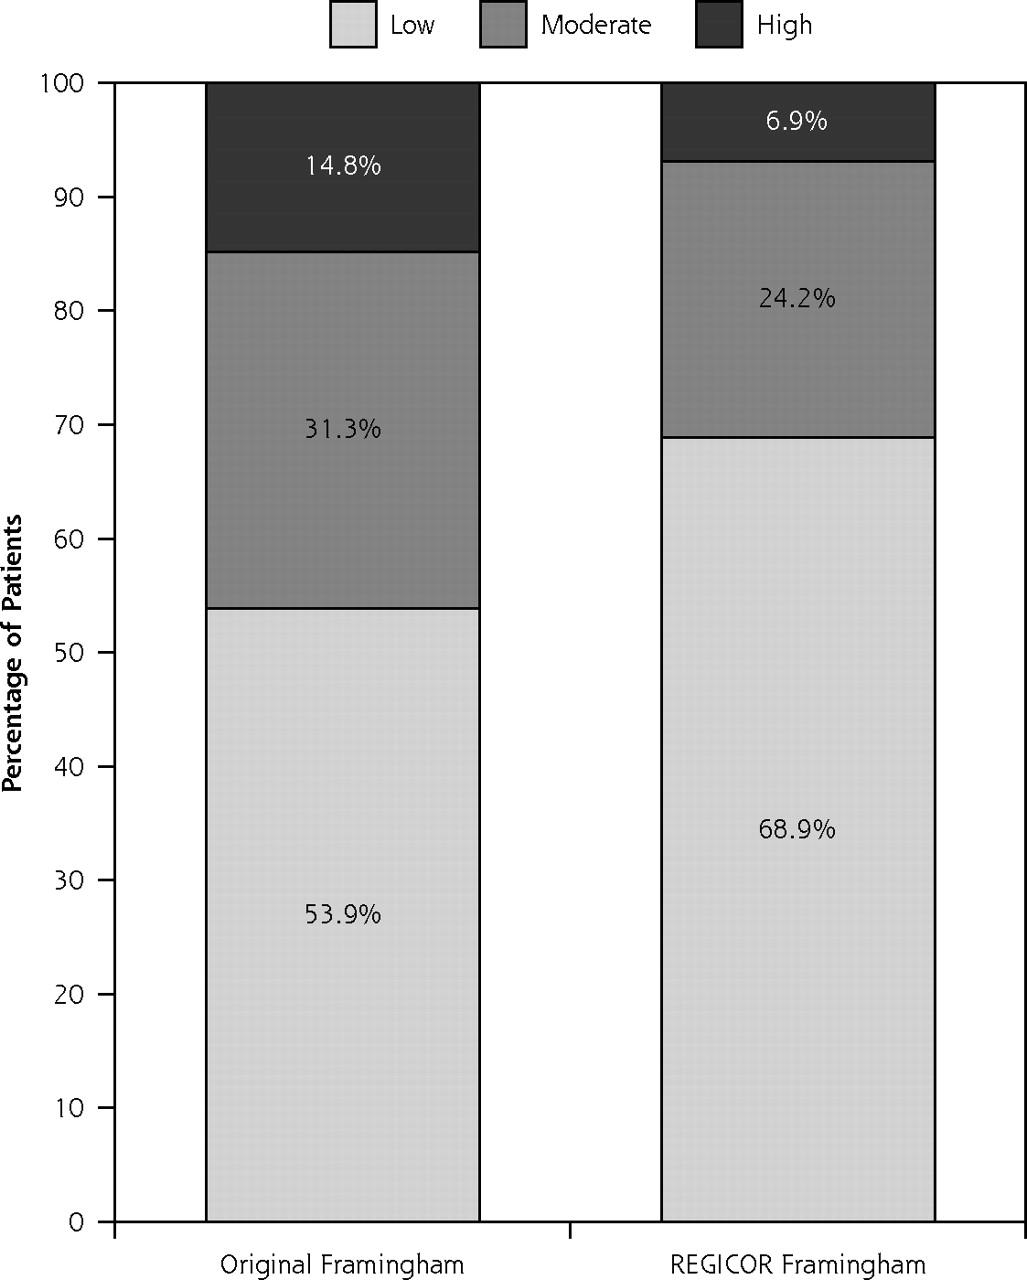
Risk category distribution of the population according to the original and REGICOR Framingham risk functions.
The proportions of patients included in the high-risk categories were 14.8% and 6.9% by the original and REGICOR Framingham functions, respectively (Figure 1). These patients accounted for 33.3% and 16.7% of the coronary events occurred during the follow-up period. More than 85% of the patients identified as being at high risk were male. The patients included in the REGICOR high-risk category were older, had higher total cholesterol and LDL cholesterol values, and had a greater percentage of smoking, coronary events, and a higher proportion of patients with a GFR of less than 60 mL/min/1.73 m2 (Table 3). Patients who developed coronary events during the follow-up period were older (58.3 vs 52.0 years, P <.001), predominantly male (73.3% vs 42.9%, P <.01) and had a higher percentage of arterial hypertension and higher mean coronary risk with the original and REGICOR Framingham functions (Table 4).
Following the practical recommendations of the European guidelines23,24 would mean that 14.3% and 6.7% of the patients according to the original and REGICOR Framingham functions, respectively, would be candidates for therapy with lipid-lowering drugs (P <.001), and 12.5% and 7.8% (P <.05) would be candidates for therapy with antihypertensive drugs (Table 5).
Characteristics of Patients Identified as of High Risk by the Original and REGICOR Framingham Functions
The performance of risk functions did not improve when applied to the subgroups of patients older than 50 years or older than 60 years, regardless of their sex. In every case, the original Framingham function overestimated and the REGICOR Framingham function underestimated the risk. The mean coronary risk in the subgroup aged 50 years and older was 14.7% estimated with the original Framingham function and 5.7% with the REGICOR Framingham function, whereas the actual rate of coronary events recorded was 10%. In the subgroup aged 60 years and older, the mean risk rates were 17.7% and 6.9%, and the actual rate of events was 14.4%, respectively.
The inclusion of 74 diabetic patients in the study did not improve the performance of risk functions in the cohort (521 patients, including diabetics; 243 male, 278 female). In a subgroup of patients fulfilling the criteria for metabolic syndrome (176 of 521; 80 male, 96 female), the performance of the risk functions was also similar to the results obtained with nondiabetic population. During the 10-year follow-up, 15.9% of the patients with metabolic syndrome suffered coronary events, but the mean coronary risk estimated with the original Framingham function was 28.4% (ie, a 79% overprediction), and with the REGICOR Framingham function was 11.8% (ie, a 74% underprediction).
DISCUSSION
Summary of Main Findings
The original and REGICOR Framingham functions showed similar results for discrimination and calibration statistics in our cohort of 447 nondiabetic patients. The original Framingham risk function overestimated coronary risk by 73% (by 48% in men, and by 136% in women), whereas the REGICOR Framingham function under-predicted the population’s coronary risk by 64% (Table 2). The proportion of patients included in the high coronary risk category was doubled with the original Framingham equation (14.8% vs 6.9%, Figure 1). The incidence rate of coronary events in the high-risk groups was 15.2% with original Framingham function and 16.1% with the REGICOR chart (Table 3).
Strengths and Limitations of the Study
The principal strength of this study is the independent evaluation of 2 important coronary disease risk equations in a cohort of general practice, nondiabetic patients who were not on lipid-lowering or antihypertensive therapy for a 10-year detailed follow-up period. Our study, however, does have limitations. The population was not randomly selected; instead, it corresponded to patients who had been cared for at the center and had available a clinical history that included the information necessary for this study. The period when data collection started coincided with the first years of health care reform and the setting up of health care centers. Given this context, one can understand the high prevalence and mean values of the risk factors in our cohort and, to some extent, the high rates of cardiovascular disease. Nonetheless, these aspects in no way interfered with the comparability of the different risk functions, even though this type of patient selection might limit the external validity of the study.
General Characteristics of the Patients With and Without Coronary Events
Patients as Candidates for Drug Therapy According to the SCORE Guidelines Recommendations, With Risk Estimated by the Original Framingham and REGICOR Risk Functions
Comparison With Existing Literature
In Spain various studies had analyzed the predictive capacity of several cardiovascular risk functions and the percentage of patients that could be candidates for the prescription of lipid-lowering and antihypertensive drugs deriving from the use of those functions.20,21,26–31 Only 1 of these studies26 excluded patients on lipid-lowering therapy, and it concluded with an indication for lipid-lowering treatment for 14.5% and 4.1% of the patients with the original and REGICOR Framingham functions, respectively. In our study the rates obtained were 14.3% and 6.7% (Table 5). When our diabetic patients were included in the cohort, the lipid-lowering treatment rates increased to 19.2% and 10.0% with the original and REGICOR Framingham equations, respectively.
Regarding the performance of risk functions, the REGICOR Framingham function was recently calibrated, and it accurately and reliably predicted the 5-year coronary heart disease risk in contrast with the original function, which consistently overestimated the actual risk.19, In our study, however, with a 10-year follow-up period, both the original and REGICOR Framingham functions failed to predict the actual population’s coronary risk. The original Framingham equation overestimated the actual risk, and REGICOR chart underestimated it. In low-risk populations of other European countries, the results of several studies suggest also that the Framingham function overestimates coronary risk by roughly 50%.11,12,15,17 These results are not surprising, because the Framingham study was conducted before the widespread use of effective treatment for cardiovascular risk factors, so its equations currently over-predict cardiovascular risk when applied to a population who have their risk factors actively managed.22
Another potential reason for the failure of predictions may be that these risk functions tend to be based on the assessment of risk factors that might be transient. In fact, the addition of a patient’s history of cardiovascular risk factors to the current assessment improves the performance of cardiovascular risk functions and provides support for the need to use a cumulative history measure of risk in cardiovascular prediction.32 Finally, our discrimination and calibration performance data were better in women, as with QRISK1 and QRISK2 functions.33,34
Implication for Future Research and Clinical Practice
A strategy for primary cardiovascular prevention is the identification of asymptomatic individuals at higher risk and implementation of intervention strategies to reduce their future risk.32 For this purpose, general practitioners need an accurate and reliable tool to help them identify those patients. Another potential use of risk functions is as a patient education tool and to provide patients a risk assessment as a way to convey the need for behavior change or new treatment regimens. One should stress, however, that cardiovascular risk charts are not diagnostic tools (no one is sick with cardiovascular risk); they are tools to identify people at high cardiovascular risk in general practice, to facilitate clinical decision making, and to determine the intensity of preventive activities. Whether a patient is categorized as of coronary high risk could have important therapeutic implications. Overprediction would inevitably lead to a disproportionate number of patients being targeted for treatment, affecting health care resources and potentially exposing patients to unnecessary treatment. Similarly, any systematic underprediction of risk could potentially deny patients much needed treatment. Even so, the relevance of the Framingham risk function in Europe, as well as other prediction rules, is not well known, because only a few prediction rules have undergone formal impact analysis to assess whether they improve patient outcomes when used as decision rules in actual clinical practice.17,35,36
In our study, the original Framingham equation led to a greater number of patients being regarded as candidates for lipid-lowering and antihypertensive treatment than did the REGICOR chart. Moreover, the profile of patients included in the subgroup considered to be at coronary high risk is different according to the function used. The sensitivity and positive predictive value were low with both risk equations. That is, many patients with coronary events had not been labeled as patients at high risk in our cohort, and many patients who were included in the high-risk category did not develop events during the 10-year follow-up period. The development of risk functions that include a cumulative history of cardiovascular risk factors32 or other variables (history of cardiovascular disease in a first-degree relative, social deprivation, body mass index, current prescription of antihypertensive therapy, and so on), as the QRISK equation does,5,33,34,37 could improve the performance of these functions in our country. Meanwhile one could accept the National Institute for Health and Clinical Excellence (NICE) recommendations, leaving health care professionals to choose the tool they consider to be most appropriate.38
In summary, our results are further evidence of the need for an adjustment, calibration, and validation of the cardiovascular risk functions on large populations that do not receive additional treatment and that are representative of each country’s reality.22 This adapted tool will help primary care practitioners with another important challenge: to support decision making by providing meaningful, understandable, and acceptable information to patients.39
Acknowledgements
The authors would like to thank Agustín García-Nogales, Professor of Biostatistics, University of Extremadura, Badajoz, Spain, for his expert help with Brier score estimations; and José Carlos Cameselle, Professor of Biochemical and Molecular Biology, University of Extremadura, Badajoz, Spain, for reading the manuscript and useful discussions.
Footnotes
-
Conflicts of interest: authors report none.
-
Funding support: This work was supported by redIAPP (Innovation and Integration of Prevention and Health Promotion in Primary Care), thematic cooperative research network G03/170 and by a grant from the Program for Promotion of Research in Primary Care, of the Instituto de Salud Carlos III. Lourdes Cañón-Barroso and Juan Ignacio Calvo-Hueros also received a predoctoral scholarship from the Spanish Society of Family and Community Medicine.
- Received for publication November 16, 2010.
- Revision received May 6, 2011.
- Accepted for publication May 10, 2011.
- © Annals of Family Medicine, Inc.


