Abstract
BACKGROUND The initial ecology of medical care study was published in 1961, offering a framework by which to investigate individuals’ contact with the medical system. We studied changes in the framework around the implementation of the Patient Protection and Affordable Care Act (ACA) within longer-term trends.
METHODS The 2002-2016 Medical Expenditure Panel Survey was used to determine rates of visit/contact per 1,000 individuals per month for physicians, primary care physicians, specialty physicians, emergency departments, inpatient hospitalizations, dental visits, and home health visits for the overall population and by age group, poverty category, health status, and race/ethnicity. Adjusted Wald tests were used to investigate differences between the pre-ACA (2012-2013) and post-ACA (2014-2015) periods. Multivariable linear regression was used to determine trends over the study period (2002-2016).
RESULTS The survey included 525,804 person-years. The uninsured rate decreased from 12.8% (95% CI, 12.0%-13.7%) in 2013 to 7.6% (95% CI, 7.0%-8.3%) in 2016. From 2002 to 2016, the numbers of individuals in a month who had contact with primary care physicians, dental care, and inpatient hospitalizations decreased. Primary care physician contact decreased most among the elderly and those reporting fair/poor health. After ACA implementation, few significant changes were identified in the overall population or by age, poverty category, race/ethnicity, or health status.
CONCLUSIONS The medical ecology framework was not notably altered 2 years after implementation of the ACA. The long-term decrease in primary care contact does not appear to have been interrupted after implementation of the ACA, was observed across income and age categories, and was most evident among the elderly and individuals reporting fair/poor health.
INTRODUCTION
A study on the ecology of medical care was first published in 1961 and was later updated using data from 1996 and 2012.1–3 The ecology of medical care framework identifies the number of individuals per 1,000 persons per month who use a medical service and offers a unique perspective on how individuals access the medical care system. Periodic studies of the ecology of medical care in the United States have shown minimal changes in most care categories, along with persistent racial/ethnic disparities, even over the course of large changes in the understanding of disease as well as the organization and financing of health care.3,4 There do appear to have been small increases, however, in the rates of contact with nonphysicians.3,5
The Patient Protection and Affordable Care Act (ACA) was passed in 2010 and had most of its major provisions in place by 2014.6 This complex law had many objectives, but its primary aim was to increase the proportion of the population with health insurance.7 Specifically, 2014 was the time that most of the provisions that directly influenced insurance expansion were implemented via various means including Medicaid expansion and the creation of private insurance marketplaces. Research has shown that the ACA increased rates of insurance coverage and increased use of outpatient and preventive services.8–11 Our goal was different from those of previous studies in that it was not to evaluate the local- or state-level effects of certain policies, to investigate the effects on health, or to study the financial consequences (on individuals or society) of the legislation but instead to look at the aggregate effects of the legislation on how individuals choose to contact the medical care system in the United States.
We used a modified ecology framework to estimate rates of use of medical services before and after implementation of the ACA within trends from 2002 to 2016. Specifically, we hypothesized that given the provisions of the law to provide greater rates of insurance, individuals with lower family income levels would have increased contact with the medical care system.
METHODS
The 2002-2016 Medical Expenditure Panel Survey was used for the analysis.12 The survey was cosponsored by the Agency for Healthcare Research and Quality and the Centers for Disease Control and Prevention and is nationally representative of the noninstitutionalized population of the United States. It has been used to investigate the medical ecology framework.2,3 Each year of the survey comprises 2 overlapping cohorts that are individually included in the survey for 2 years, over which period each household is interviewed 5 times.
The present study included all survey respondents and visits/telephone calls to physicians, primary care physicians (general practice, family medicine, general internal medicine, geriatrics, and general pediatrics), specialty physicians (all other specialties), and emergency departments (EDs), as well as inpatient hospitalizations, dental visits, and home health visits. Previously included categories, such as chiropractic/alternative medicine, treatments, therapy, and optometry/podiatry, were excluded because of changes in survey methodology starting in 2013, which resulted in greater rates of reporting for many categories.12 Nurse/nurse practitioner/physician assistant/nurse midwife visits were identified and included in a sensitivity analyses but not included in the primary manuscript of the study because of concern regarding changes related to reporting rates of nonphysician visits.
To be consistent with publications using the medical ecology framework, visits were standardized to the number of individuals per 1,000 persons who had a type of visit/contact per month. Importantly, this measure should not be misinterpreted as use; an individual might visit the ED 5 times during a month, but we counted that as a single visit/contact. Throughout the study, we referred to this standardized measure as contact with a particular type of service to minimize confusion.
Characteristics of individuals in the sample were assessed by self-report during household interviews and included insurance status (insured or uninsured for the entire year), age, sex, race/ethnicity (white non-Hispanic, black non-Hispanic, Hispanic, other [other not reported in the manuscript]), poverty category (≤200% of the federal poverty line, >200% and ≤400% of the federal poverty line, >400% of the federal poverty line), and reported health status (excellent, very good, good, fair/poor) during the first interview of the year. Standardized contact rates per 1,000 individuals per month were calculated by age category (<18 years, ≥18 and ≤40 years, >40 and <65 years, ≥65 years), race/ethnicity, poverty category, and health status.
Pre- and Post-Affordable Care Act Periods
The pre-ACA period was defined as 2012-2013 (before implementation of the most important aspects of the ACA), and the post-ACA period was defined as 2014-2015. Adjusted Wald tests were used to determine significance between pre and post time periods.
Long-Term Trends in Medical Ecology
Rates of change over the course of the study (2002-2016) were investigated using multivariable linear regression with an interaction between year and the variable of interest and were adjusted (as appropriate) for age, age2 (to allow for nonlinearity with age), and sex. Postprediction average marginal effects were used to determine rates of change for individual categories.
Sensitivity Analyses
Numerous sensitivity analyses were conducted. First, children and individuals aged ≥65 years who did not have notable decreases in uninsured rates were excluded from the pre- and post-ACA evaluation and long-term trends by poverty category. Second, we also included health status in the multivariable linear regressions. Third, nurse/nurse practitioner/physician assistant/nurse midwife visits were examined by poverty category to specifically investigate whether there were differential effects by poverty category. Fourth, we altered the standardized time period to quarterly instead of monthly for the overall population and by poverty category because of greater treatment of chronic disease, which could have altered what could be considered the appropriate time frame for medical ecology studies. Fifth, nurse/nurse practitioner/physician assistant/nurse midwife/was added to overall physician contacts and evaluated by poverty category.
We used logistic regression for bivariate analyses (health status) and considered P <.01 to be statistically significant. Stata 15 (StataCorp, LLC) and survey weighting were used for all analyses. The OhioHealth Institutional Review Board judged this study to be exempt.
RESULTS
The survey included 525,804 person-years. As expected, the proportion of the population aged >40 years increased, whereas the proportion of Hispanic individuals increased and the proportion of non-Hispanic white individuals decreased over the course of the study (2002-2016). The proportion of individuals within different poverty categories also shifted over the course of the study, with the most notable change being an increase in the poorest category from 2008 to 2014. Health status showed small changes over the course of the study, but the proportion in fair/poor health did not change (odds ratio 0.99; 95% CI, 0.99-1.00; P = .49) (Supplemental Figure 1, http://www.AnnFamMed.org/content/17/6/526/suppl/DC1/).
The uninsured rate decreased from 12.8% (95% CI, 12.0%-13.7%) in 2013 to 7.6% (95% CI, 7.0%-8.3%) in 2016 (Figure 1a). The uninsured rate decreased primarily for adults aged ≥18 and <65 years (Figure 1b). There was also a decrease in the uninsured rate among individuals at ≤200% of the poverty line and less so for individuals at >200% and ≤400% of the poverty line (Figure 1c). All investigated races/ethnicities showed a decrease in the uninsured rate, but the decrease was greatest among Hispanic individuals (Figure 1d). Similarly, all health status categories showed decreases in uninsured rates, with the greatest decrease being among those reporting good and fair/poor health (Figure 1e).
Proportion of overall population without health insurance.
Panels b-e allocated the population to different categories as noted in each panel. Bars represent 95% CI.
Proportion of population without health insurance, by age.
Panels b-e allocated the population to different categories as noted in each panel. Bars represent 95% CI.
Proportion of population without health insurance, by poverty category.
Panels b-e allocated the population to different categories as noted in each panel. Bars represent 95% CI.
Proportion of population without health insurance, by race/ethnicity.
Panels b-e allocated the population to different categories as noted in each panel. Bars represent 95% CI.
Proportion of population without health insurance, by health status.
Panels b-e allocated the population to different categories as noted in each panel. Bars represent 95% CI.
Overall Population
In adjusted analyses for the overall population from 2002 to 2016, the number of individuals per month who were in contact with a physician, and more specifically a primary care physician, decreased significantly (−1.2 persons per 1,000 per month per year [95% CI, –1.4 to –1.0]; P <.001) (Figure 2 and Table 1). In addition, there were significant decreases in the rates of individuals who had a dental visit or were hospitalized in a month. There were no statistically significant increases in individuals accessing home health visits or specialty physicians after statistical adjustment for age and sex (Table 1). See Supplemental Table 3 (http://www.AnnFamMed.org/content/17/6/526/suppl/DC1/) for unadjusted overall population numbers. After ACA implementation (comparing 2012-2013 to 2014-2015), no categories decreased, and only home health visits showed a significant increase between the 2 time points (Table 1).
Medical ecology framework: 2002-2016.
Includes all survey respondents along with survey weights during the period 2002-2016. Data points represent the number of individuals with a visit/contact per 1,000 persons per month by year. Bars represent 95% CI.
Pre- and Post-Affordable Care Act Visit/Contact Rates and Long-Term Trends
Age Category
Individuals aged ≥65 years had greater contact rates for all use categories, with the exception of dental care, than younger individuals (Figure 3). From 2002 to 2016, contact with physicians decreased more for adults (aged ≥18 years) than for children (Table 1). All age groups had significant decreases in rates of primary care contact, with individuals aged ≥65 years showing the greatest decrease (−3.0 persons per 1,000 per month per year [95% CI, –3.7 to –2.4]; P <.001). Contact with specialty physicians decreased significantly among adults aged ≥18 and ≤40 years but increased for individuals aged ≥65 years. Contact with dental care showed the greatest decrease for adults aged >40 and <65 years (Table 1 and Figure 3).
Visit/contact with physician, by age category: 2002-2016.
Panels a-g represent a different contact with the medical care system. Bars represent 95% CI.
Visit/contact with primary care physician, by age category: 2002-2016.
Panels a-g represent a different contact with the medical care system. Bars represent 95% CI.
Visit/contact with specialty physician, by age category: 2002-2016.
Panels a-g represent a different contact with the medical care system. Bars represent 95% CI.
Visit/contact with dental care, by age category: 2002-2016.
Panels a-g represent a different contact with the medical care system. Bars represent 95% CI.
Visit/contact with emergency department, by age category: 2002-2016.
Panels a-g represent a different contact with the medical care system. Bars represent 95% CI.
Visit/contact with inpatient hospitalization, by age category: 2002-2016.
Panels a-g represent a different contact with the medical care system. Bars represent 95% CI.
Visit/contact with home health professional, by age category: 2002-2016.
Panels a-g represent a different contact with the medical care system. Bars represent 95% CI.
After implementation of the ACA, adults aged <18 years and ≥18 and ≤40 years showed significantly lesser rates of inpatient hospitalization and ED contacts increased for adults aged ≥65 years. Otherwise, adults aged ≥18 and <65 years showed no significant changes in rates of engagement with different aspects of the medical system (Table 1 and Figure 3).
Poverty Category
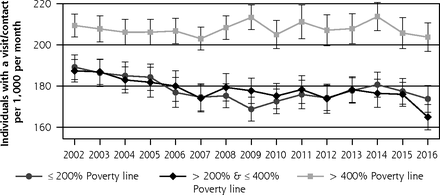
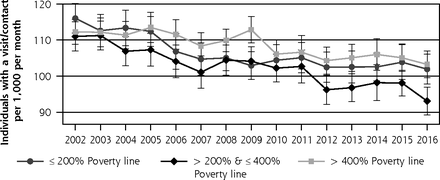
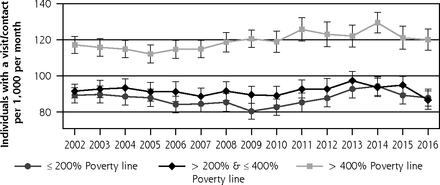
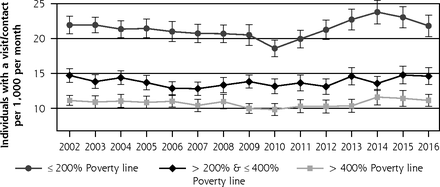
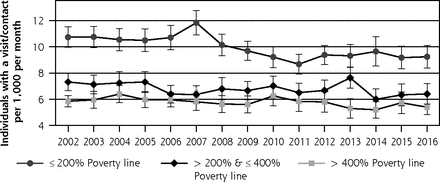
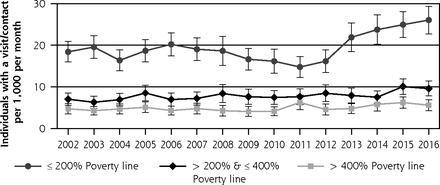
Individuals with higher income had consistently greater rates of contact with overall physicians, specialty physicians, and dentistry, whereas individuals with lower income had greater rates of contact with the ED, inpatient hospitalization, and home health visits (Figure 4). Notable changes from 2002 to 2016 included significantly decreased rates of dental care among individuals with middle/higher income and significantly increased rates of home health visits engagement among individuals with lower income (Table 1). Rates of change between different income groups were similar, with the exception of specialty physician engagement between middle- and higher-income individuals.
Visit/contact with physician, by poverty category: 2002-2016.
Panels a-g represent a different contact with the medical care system. Bars represent 95% CI.
Visit/contact with primary care physician, by poverty category: 2002-2016.
Panels a-g represent a different contact with the medical care system. Bars represent 95% CI.
Visit/contact with specialty physician, by poverty category: 2002-2016.
Panels a-g represent a different contact with the medical care system. Bars represent 95% CI.
Visit/contact with dental professional, by poverty category: 2002-2016.
Panels a-g represent a different contact with the medical care system. Bars represent 95% CI.
Visit/contact with emergency department, by poverty category: 2002-2016.
Panels a-g represent a different contact with the medical care system. Bars represent 95% CI.
Visit/contact with inpatient hospitalization, by poverty category: 2002-2016.
Panels a-g represent a different contact with the medical care system. Bars represent 95% CI.
Visit/contact with home health professional, by poverty category: 2002-2016.
Panels a-g represent a different contact with the medical care system. Bars represent 95% CI.
After ACA implementation, lower-income individuals’ contact with home health visits increased (+5 persons per 1,000 individuals per month [95% CI, 2-8]; P = .001). Otherwise, no significant differences were identified after ACA implementation for any poverty category (Figure 4 and Table 1).
Health Status
Individuals reporting fair/poor health had much greater rates of contact with all types of care, with the exception of dental care, than individuals reporting good, very good, or excellent health. Notable changes from 2002 to 2016 were decreased rates of contact with a primary care physician among individuals with fair/poor health (−2.6 persons per 1,000 per month per year [95% CI, –3.3 to –1.9]; P <.001) and an increase among individuals reporting fair/poor health who were in contact with the ED (+0.4 persons per 1,000 per month per year [95% CI, 0.2-0.6]; P <.001) (Supplemental Table 1 and Supplemental Figure 3, http://www.AnnFamMed.org/content/17/6/526/suppl/DC1/). After ACA implementation, the only significant difference by health status was decreased rates of individuals hospitalized during a month among individuals reporting excellent health (Supplemental Table 1, http://www.AnnFamMed.org/content/17/6/526/suppl/DC1/).
Race/Ethnicity
White (non-Hispanic) individuals had greater rates of contact with all 3 physician categories and dental care compared to individuals of other races/ethnicities. Black (non-Hispanic) individuals generally had greater rates of contact with EDs and similar rates of inpatient hospitalization and home health visits than white (non-Hispanic) individuals.
From 2002 to 2016, Hispanic individuals’ rates of primary care physician contact remained stable, whereas both white (non-Hispanic) individuals’ and black (non-Hispanic) individuals’ rates decreased (Supplemental Table 1 and Supplemental Figure 2, http://www.AnnFamMed.org/content/17/6/526/suppl/DC1/). Changes in contact with dental care varied by race/ethnicity; it decreased for white (non-Hispanic) individuals, was stable for black (non-Hispanic) individuals, and increased for Hispanic individuals.
After ACA implementation, Hispanic individuals had greater rates of contact with primary care physicians (+5 visits per 1,000 per month [95% CI, 1-9]; P = .007) and lesser rates of inpatient hospitalization (Supplemental Table 1 and Supplemental Figure 2, http://www.AnnFamMed.org/content/17/6/526/suppl/DC1/). White (non-Hispanic) individuals also had greater rates of home health visitation. Otherwise, there were no significant changes.
Sensitivity Analyses
Numerous sensitivity analyses were conducted. We studied nurse/nurse practitioner/physician assistant/nurse midwife visits, which increased simultaneously with changes in survey methodology. The increase in nurse/nurse practitioner/physician assistant/nurse midwife visits, however, did not have differential effects by poverty category. We also included nurse/nurse practitioner/physician assistant/nurse midwife visits with overall physician visits by poverty category but did not identify changes by poverty category. In addition, we investigated engagement on a quarterly, rather than a monthly, basis, with similar patterns for poverty category and the overall population, albeit with greater numbers. No notable differences in rates by poverty category were identified when limited to adults aged 18-64 years, among whom there were no statistically significant increases between 2012-2013 and 2014-2015 (Supplemental Table 2 and Supplemental Figure 4, http://www.AnnFamMed.org/content/17/6/526/suppl/DC1/).
DISCUSSION
We investigated how frequently the US population accessed different types of care before and after implementation of the ACA. The study identified the expected decrease in the uninsured rate after implementation of the ACA. Consistent with previous ecology of medical care studies in the United States, the ACA appears to have had no more than a small effect on the overall medical ecology pattern, even though it resulted in large changes to the organization and financing of medical care. The most important long-term trends were decreases in contact with primary care and dental care visits.
Given the decrease in the uninsured rate, we expected to see increases in contact among groups who had decreased rates of uninsured (lower income and adults aged <65 years). However, we identified few notable changes in these populations. There have been many investigations of the effect of the ACA13 including studies that assessed outcomes from the Behavioral Risk Factor Surveillance Survey,14 included certain subgroups of a population,11,15,16 or were evaluations of Medicaid expansion.17 Our goal was limited to investigating the collective effects of the legislation on how individuals contact the medical care system in the United States, which is different from previous evaluations.
Given the aims and scale of the ACA,7,8 it is surprising that rates of individuals’ contact with primary care did not increase, especially among individuals at ≤200% of the poverty line. It is possible that the ACA abated some of the steady long- term decrease in rates of contact with primary care. Interestingly, this decrease was also noted in the first ecology of medical care publication in 1961.1 Unexpectedly, the groups with decreases in engagement with primary care were among individuals at high risk of symptoms and disease such as individuals reporting fair/poor health and individuals aged ≥65 years. Whereas it is possible that these individuals were contacting the medical care system via other means (nurse practitioner visits/physician assistant visits, e-mail, etc), the long-term trend is concerning, given the importance of primary care to a high-functioning medical care system.18,19
There continue to be racial/ethnic differences in the numbers of individuals in contact with the medical system, which appear to have changed little after implementation of the ACA. The lone notable change was a lack of decrease in contact rates with primary care physicians among Hispanic individuals, which appears to have predated the ACA. Considering ways to allow for more dynamism in care delivery, which allows for better alignment with individuals and their communities, might be an alternative method to decrease some of the observed disparities.20
LIMITATIONS
There are several limitations to the present study. First, the pre/post-ACA analysis did not control for different population characteristics. Second, survey methodology changed starting in 2013, which improved the accuracy of reporting but resulted in large increases in reporting for many previously used categories (nurse/physician assistant/nurse practitioner, etc). These categories were excluded, but it remains possible that increases in engagement were actually present in some of these categories. With the exception of home health visits, however, it appears unlikely that the presented analyses were meaningfully affected by the changes in reporting. Visits by elderly and lower-income individuals could have previously been underreported, but we did not find evidence of a disproportionate increase in visits by these groups. It is also possible that if significant under-reporting within the included categories occurred during the pre-ACA time period, the ACA would be associated with a decrease in contacts, which we find to be unlikely in most categories. Third, technology changes could have influenced accounting for communication with clinicians, given that telecommunication, e-mail, and web portals have become more commonly used.21 Fourth, we did not have access to reported symptoms and instead included health status as a category by which to study contact. Fifth, we included 2 years of post-ACA data for change in patterns of care, which might be insufficient to detect change. Sixth, the Medical Expenditure Panel Survey included noninstitutionalized individuals only and therefore did not represent the entire population and might not offer a complete view of the changes associated with the ACA.
CONCLUSION
The ACA increased insurance rates among lower-income individuals, but we did not observe notable changes in the medical ecology framework after ACA implementation, even among groups who disproportionately gained insurance. These results continue to support a long-term decrease in contact with primary care physicians that was not notably altered around the time of ACA implementation. The long-term decrease in primary care contact was most notable among the elderly and those reporting fair/poor health.
Acknowledgment
The authors would like to acknowledge Lee Green, MD, MPH (University of Alberta) for insightful comments on a draft of this manuscript.
Footnotes
Conflicts of interest: M.E.J. is funded by the Government Resource Center working on the Group VIII evaluation of Ohio’s Medicaid expansion. No funding was used in this research.
To read or post commentaries in response to this article, see it online at http://www.AnnFamMed.org/content/17/6/526.
Funding support: M.E.J. is funded by the Government Resource Center working on the Group VIII evaluation of Ohio’s Medicaid expansion. No funding was used in this research.
Supplemental materials: Available at http://www.AnnFamMed.org/content/17/6/526/suppl/DC1/.
- Received for publication January 5, 2019.
- Revision received April 2, 2019.
- Accepted for publication May 6, 2019.
- © 2019 Annals of Family Medicine, Inc.


