
Article Figures & Data
Figures
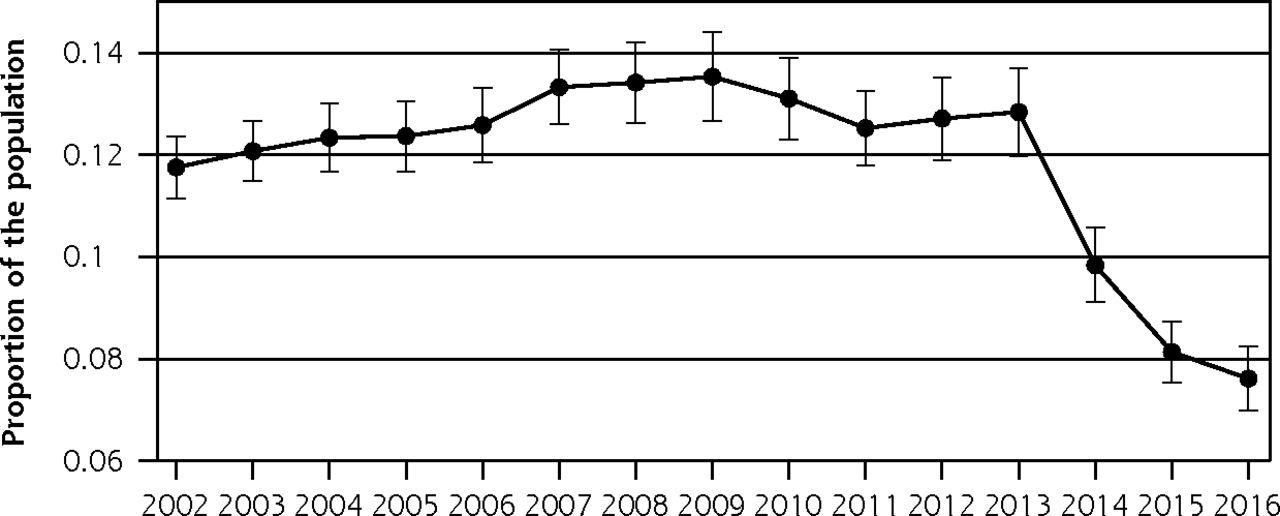
- Figure 1a
Proportion of overall population without health insurance.
Panels b-e allocated the population to different categories as noted in each panel. Bars represent 95% CI.
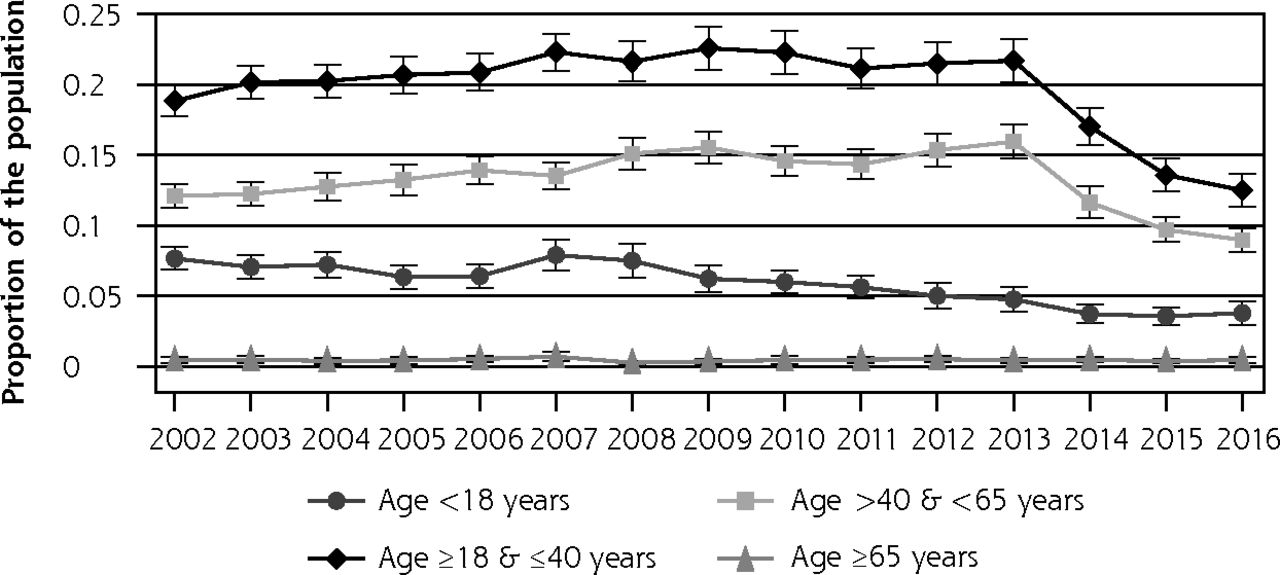
- Figure 1b
Proportion of population without health insurance, by age.
Panels b-e allocated the population to different categories as noted in each panel. Bars represent 95% CI.
- Figure 1c
Proportion of population without health insurance, by poverty category.
Panels b-e allocated the population to different categories as noted in each panel. Bars represent 95% CI.
- Figure 1d
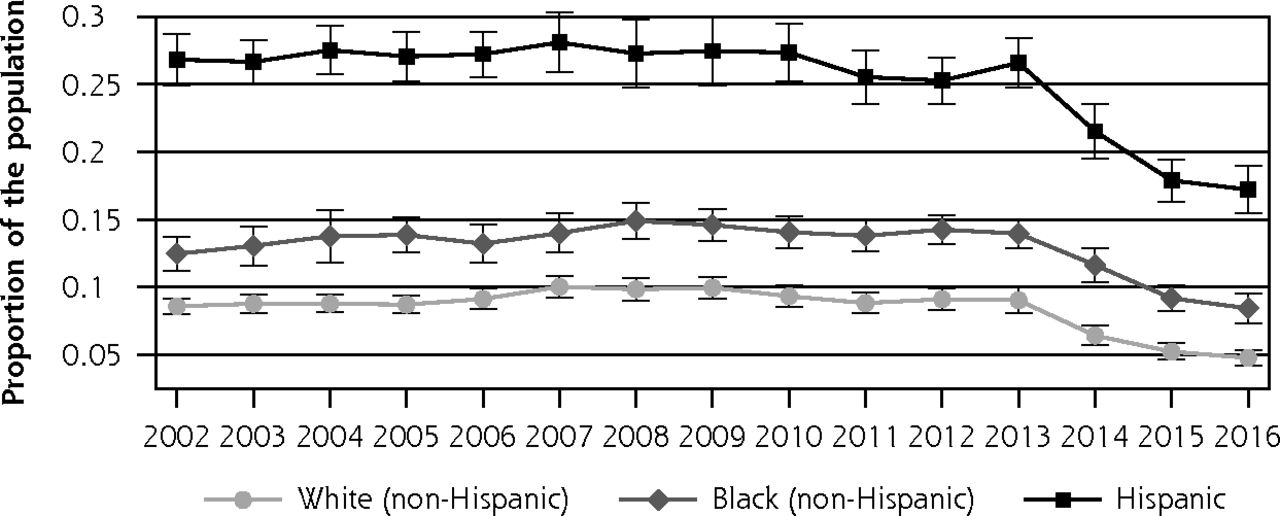
Proportion of population without health insurance, by race/ethnicity.
Panels b-e allocated the population to different categories as noted in each panel. Bars represent 95% CI.
- Figure 1e
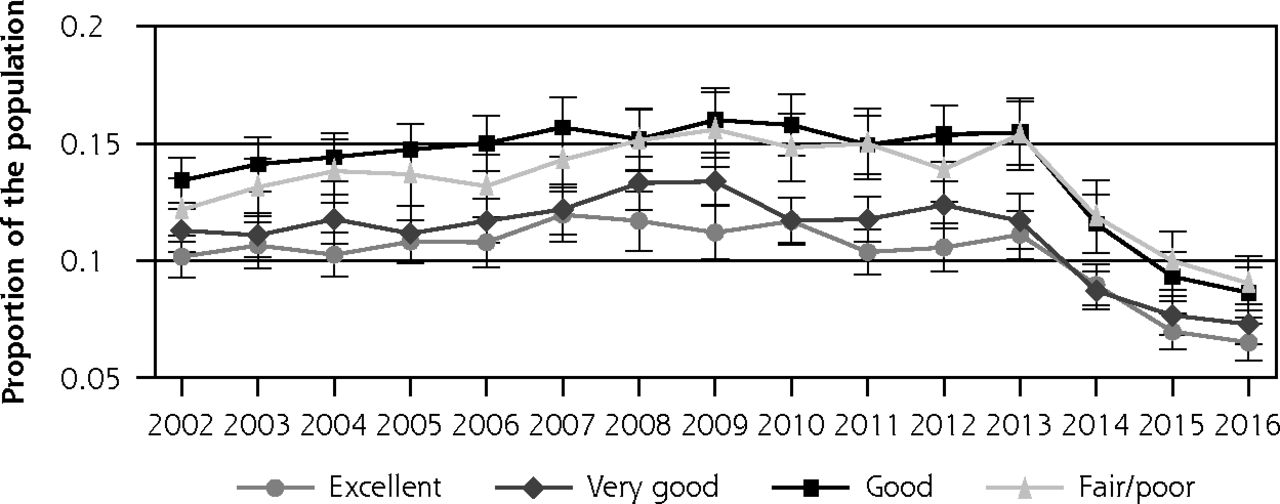
Proportion of population without health insurance, by health status.
Panels b-e allocated the population to different categories as noted in each panel. Bars represent 95% CI.
- Figure 2
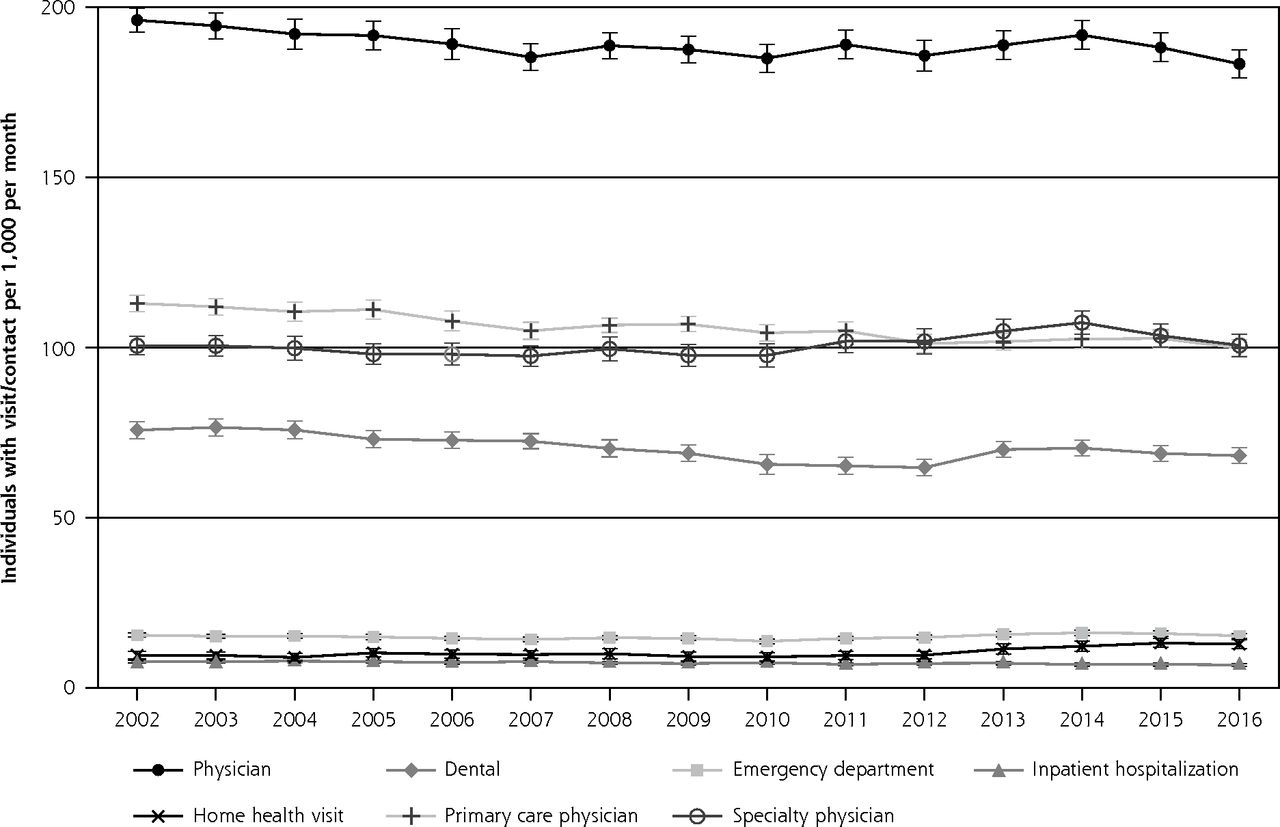
Medical ecology framework: 2002-2016.
Includes all survey respondents along with survey weights during the period 2002-2016. Data points represent the number of individuals with a visit/contact per 1,000 persons per month by year. Bars represent 95% CI.
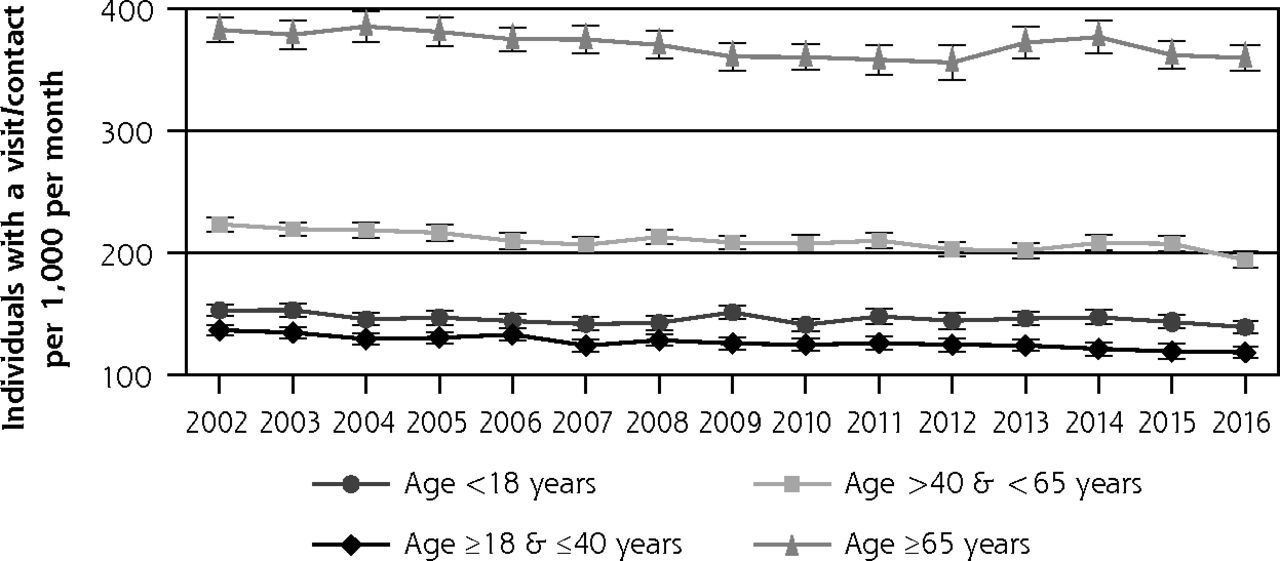
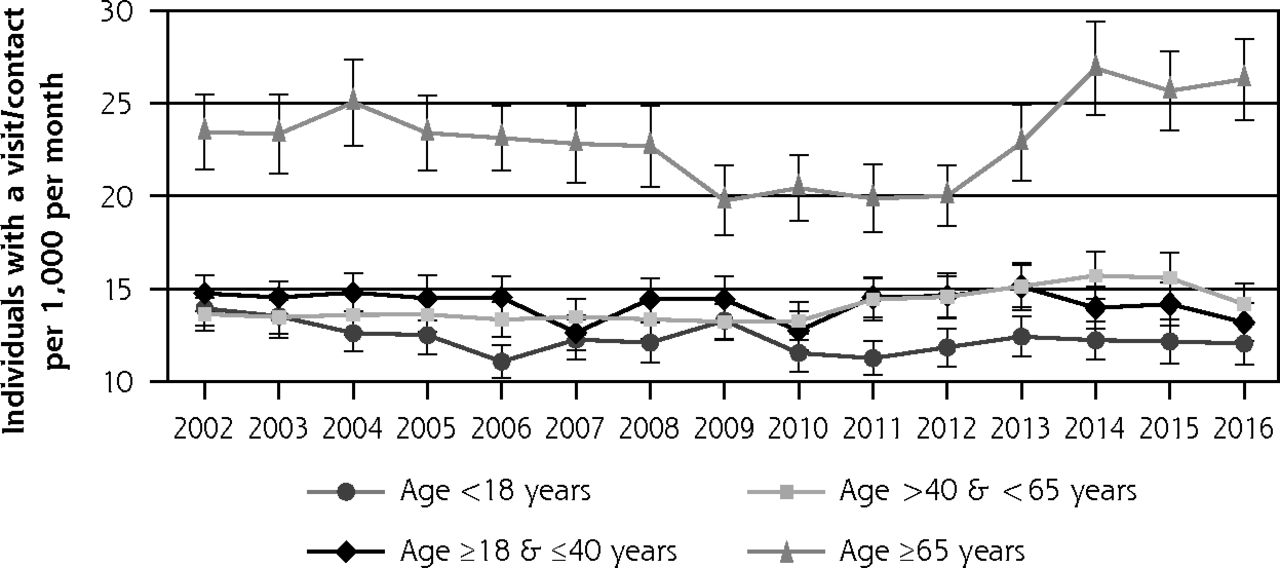
- Figure 3a
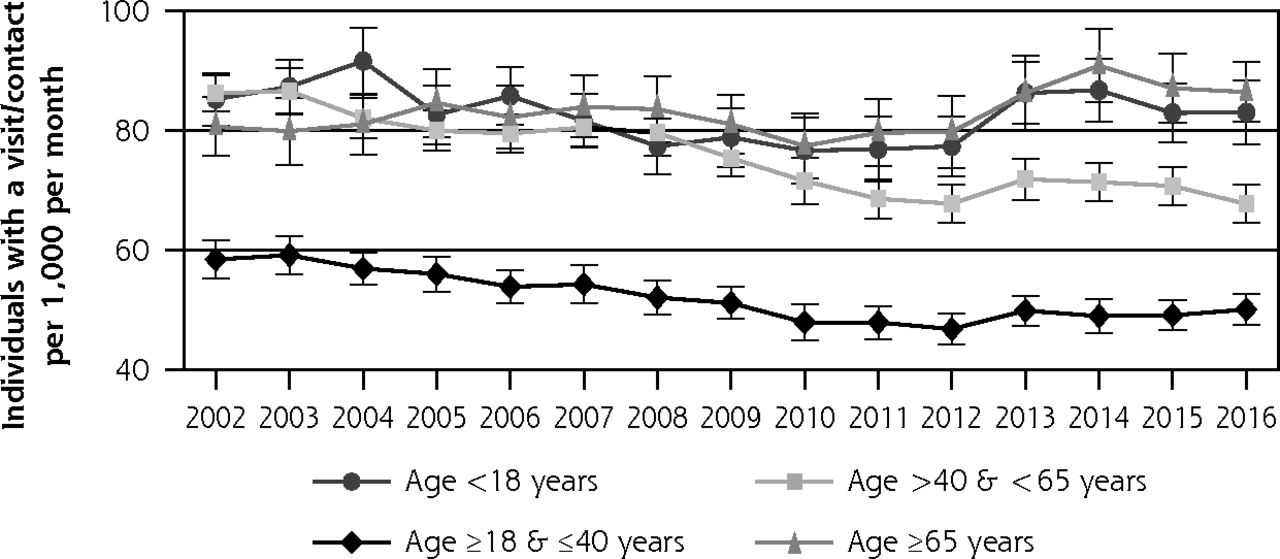
Visit/contact with physician, by age category: 2002-2016.
Panels a-g represent a different contact with the medical care system. Bars represent 95% CI.
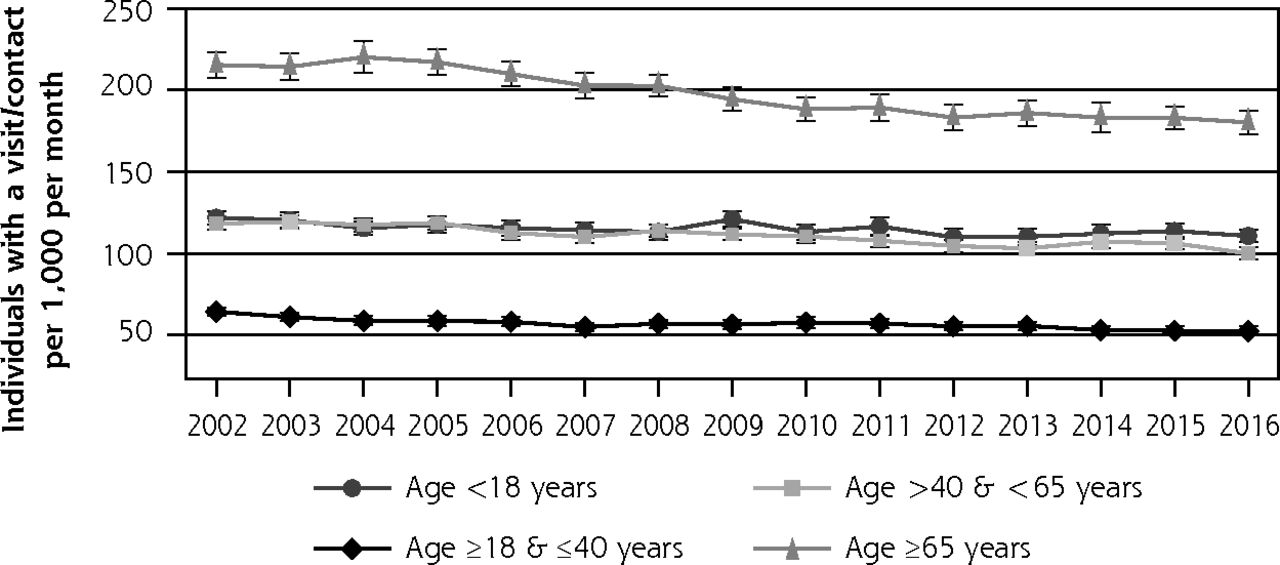
- Figure 3b
Visit/contact with primary care physician, by age category: 2002-2016.
Panels a-g represent a different contact with the medical care system. Bars represent 95% CI.
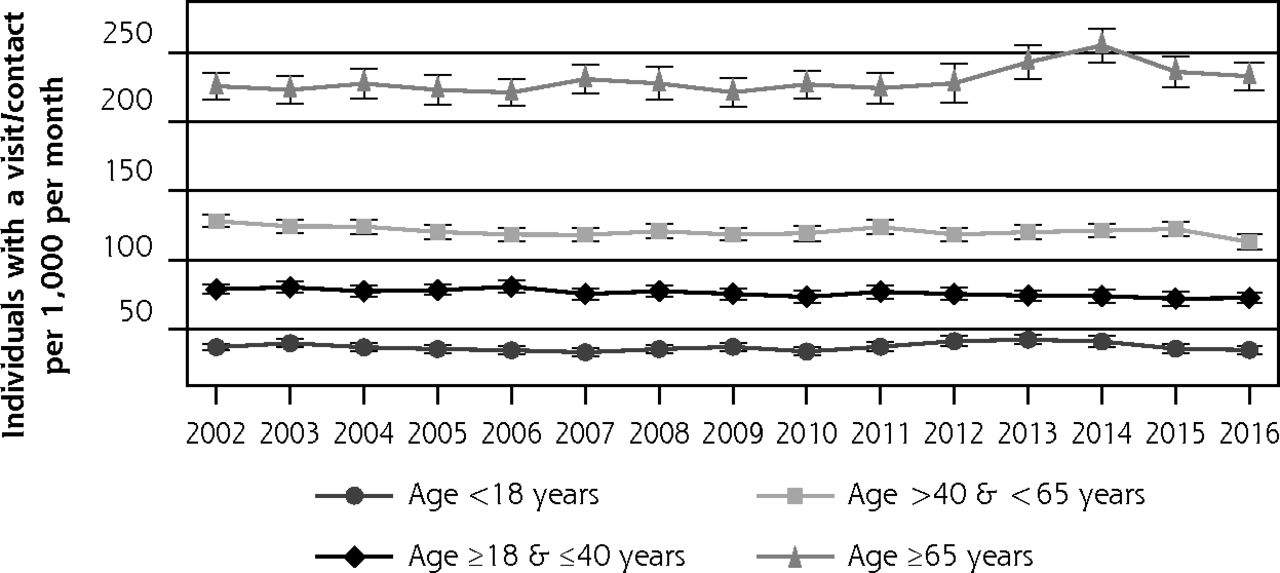
- Figure 3c
Visit/contact with specialty physician, by age category: 2002-2016.
Panels a-g represent a different contact with the medical care system. Bars represent 95% CI.
- Figure 3d
Visit/contact with dental care, by age category: 2002-2016.
Panels a-g represent a different contact with the medical care system. Bars represent 95% CI.
- Figure 3e
Visit/contact with emergency department, by age category: 2002-2016.
Panels a-g represent a different contact with the medical care system. Bars represent 95% CI.
- Figure 3f
Visit/contact with inpatient hospitalization, by age category: 2002-2016.
Panels a-g represent a different contact with the medical care system. Bars represent 95% CI.
- Figure 3g
Visit/contact with home health professional, by age category: 2002-2016.
Panels a-g represent a different contact with the medical care system. Bars represent 95% CI.
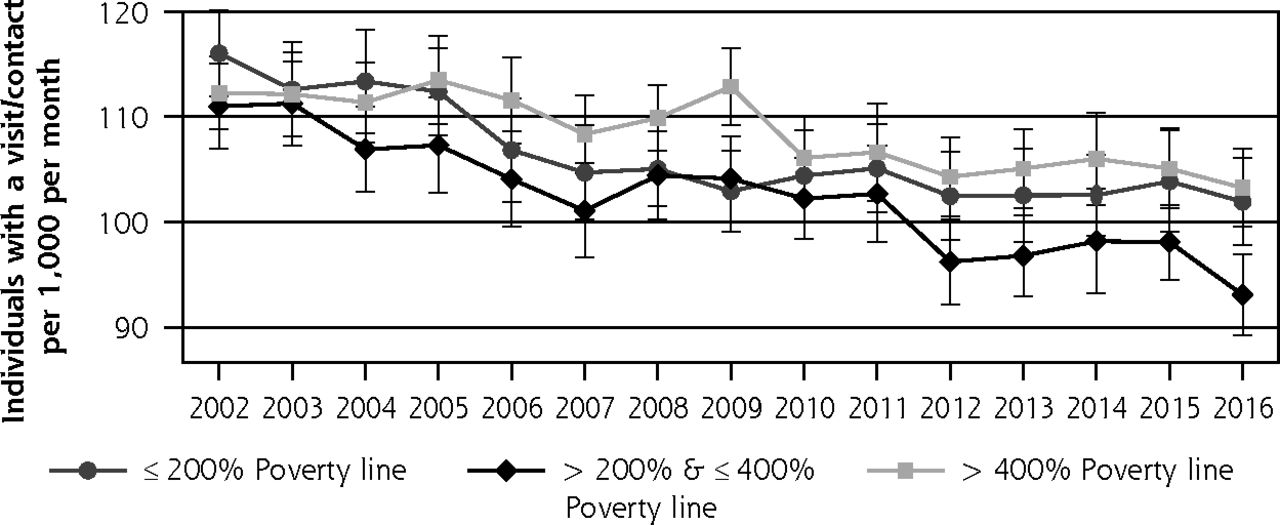
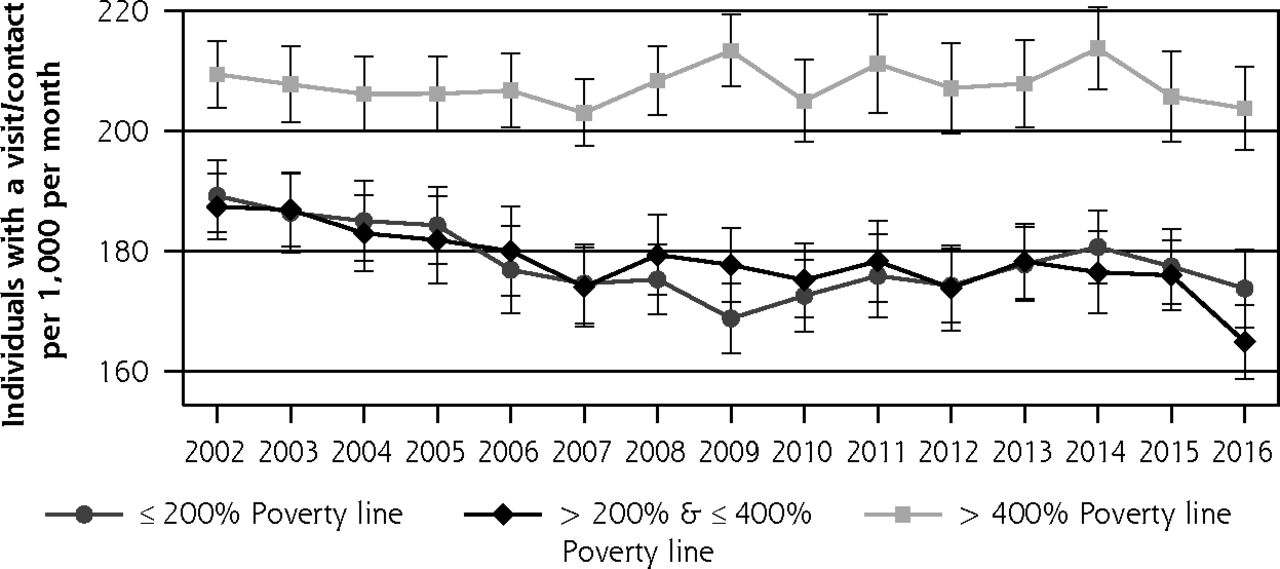
- Figure 4a
Visit/contact with physician, by poverty category: 2002-2016.
Panels a-g represent a different contact with the medical care system. Bars represent 95% CI.
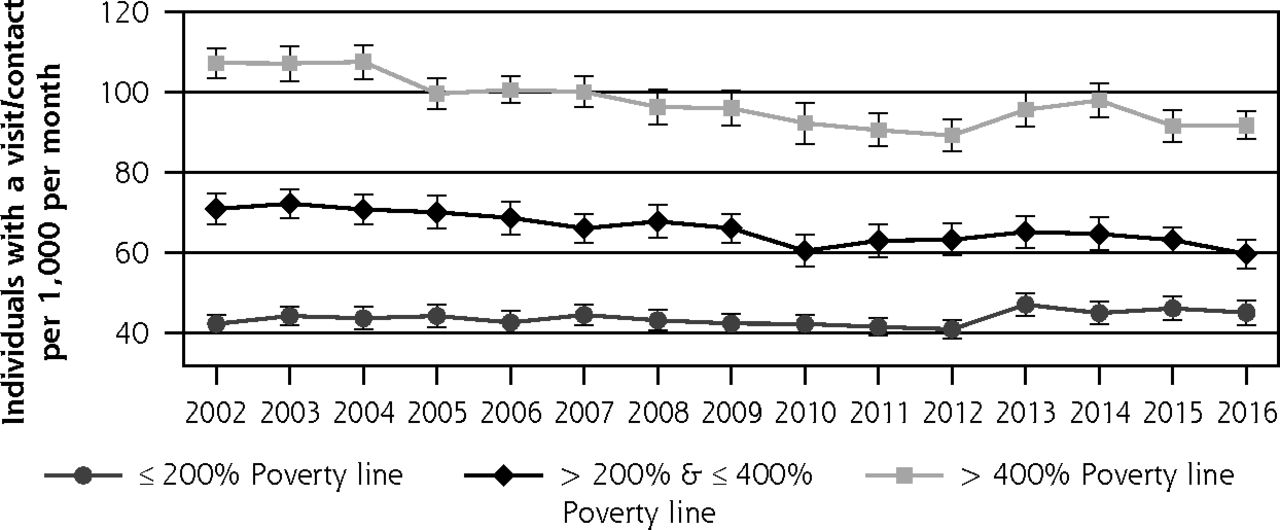
- Figure 4b
Visit/contact with primary care physician, by poverty category: 2002-2016.
Panels a-g represent a different contact with the medical care system. Bars represent 95% CI.
- Figure 4c
Visit/contact with specialty physician, by poverty category: 2002-2016.
Panels a-g represent a different contact with the medical care system. Bars represent 95% CI.
- Figure 4d
Visit/contact with dental professional, by poverty category: 2002-2016.
Panels a-g represent a different contact with the medical care system. Bars represent 95% CI.
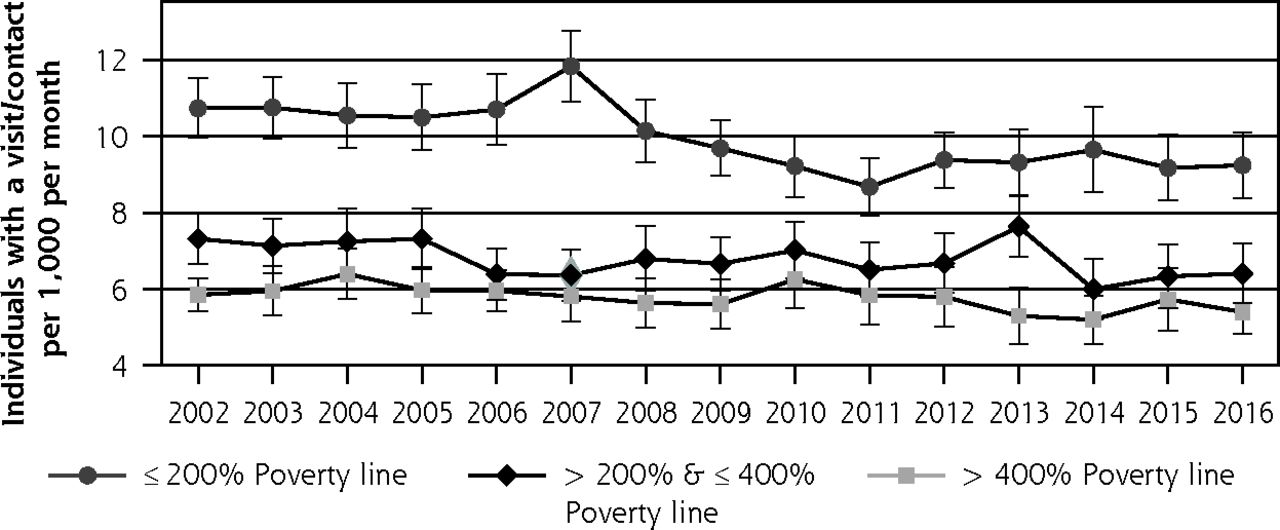
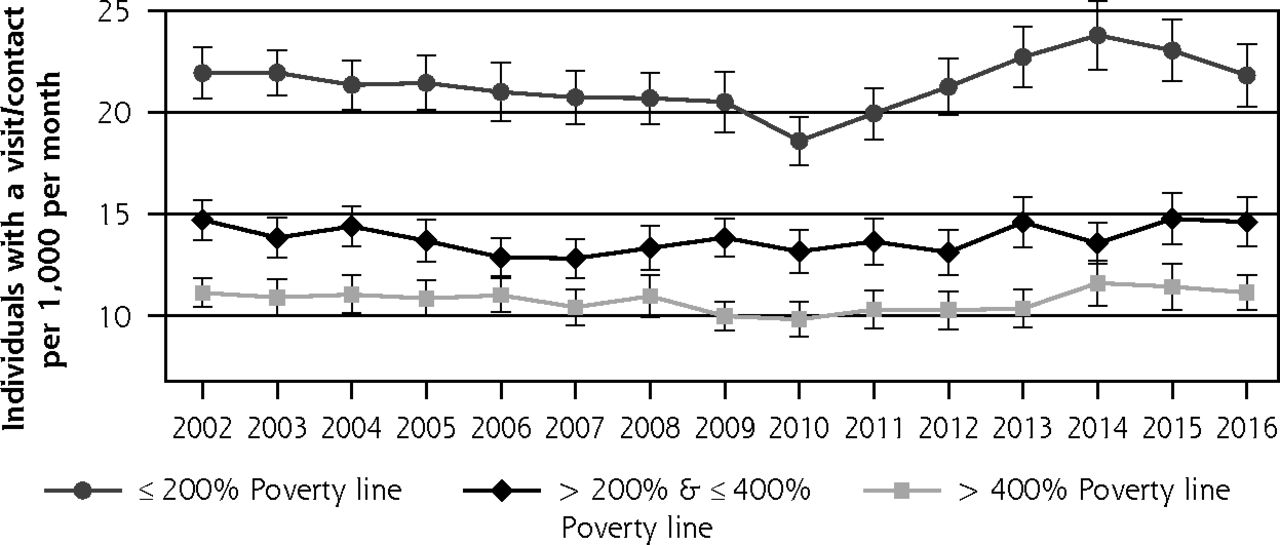
- Figure 4e
Visit/contact with emergency department, by poverty category: 2002-2016.
Panels a-g represent a different contact with the medical care system. Bars represent 95% CI.
- Figure 4f
Visit/contact with inpatient hospitalization, by poverty category: 2002-2016.
Panels a-g represent a different contact with the medical care system. Bars represent 95% CI.
- Figure 4g
Visit/contact with home health professional, by poverty category: 2002-2016.
Panels a-g represent a different contact with the medical care system. Bars represent 95% CI.


Tables
Overall Population Pre
(2012-2013)Post
(2014-2015)Difference P
ValueRate of Change
(per Year, 2002-2016)P
ValuePhysician 187 (179-196) 190 (181-199) 3 (−2 to 7) .24 −1.2 (−1.5 to –0.9) <.001 Primary care physician 102 (97-106) 103 (98-108) 1 (−2 to 4) .41 −1.2 (−1.4 to –1.0) <.001 Specialty physician 103 (98-109) 106 (100-111) 2 (−2 to 6) .26 −0.1 (−0.4 to 0.1) .3 Emergency department 15 (15-16) 16 (15-17) 1 (0-2) .04 0 (0-0.1) .46 Inpatient hospitalization 7 (7-8) 7 (6-7) 0 (−1 to 0) .18 −0.1 (−0.1 to –0.1) <.001 Dental 67 (64-71) 70 (66-74) 2 (0-4) .035 −0.7 (−0.9 to –0.5) <.001 Home health visit 11 (9-12) 13 (12-14) 2 (1-3) .001 0.1 (0-0.2) .06 Age Category Age <18 Years Physician 146 (140-151) 146 (141-150) 0 (−6 to 6) .99 −0.5 (−0.9 to –0.1) .03 Primary care physician 110 (106-114) 113 (109-117) 3 (−2 to 8) .24 −0.6 (−1.1 to –0.3) .001 Specialty physician 42 (39-45) 38 (36-41) −4 (−7 to –1) .05 0.1 (−0.1 to 0.4) .31 Emergency department 12 (11-13) 12 (11-13) 0 (−1 to 1) .92 −0.1 (−0.2 to 0) .03 Inpatient hospitalization 3 (2-3) 2 (2-2) −1 (−1 to 0) .002 0 (−0.1 to 0) .05 Dental 82 (78-86) 85 (81-89) 3 (−2 to 8) .22 −0.3 (−0.7 to –0.1) .16 Home health visit 4 (2-5) 4 (3-5) 0 (−1 to 1) .99 0.2 (0.1-0.3) <.001 Age ≥18 & ≤40 Years Physician 125 (121-129) 121 (116-126) −4 (−10 to 2) .16 −1.1 (−1.5 to –0.7) <.001 Primary care physician 56 (53-58) 53 (51-55) −3 (−5 to 0) .05 −0.6 (−0.8 to –0.4) <.001 Specialty physician 75 (71-78) 73 (69-77) −2 (−7 to 3) .45 −0.5 (−0.9 to –0.2) .002 Emergency department 15 (14-16) 14 (13-15) −1 (−2 to 0) .17 0 (−0.1 to 0) .28 Inpatient hospitalization 6 (5-6) 5 (4-5) −1 (−2 to –1) <.001 −0.1 (−0.1 to –0.1) <.001 Dental 48 (46-50) 49 (47-51) 1 (−2 to 3) .59 −0.8 (−1.0 to –0.6) <.001 Home health visit 2 (2-3) 3 (2-4) 1 (0-2) .12 0.1 (0.1-0.2) .02 Age >40 & <65 Years Physician 203 (198-208) 208 (203-213) 5 (−1 to 12) .08 −1.4 (−1.9 to –0.9) <.001 Primary care physician 104 (101-107) 107 (103-110) 3 (−1 to 7) .13 −1.3 (−1.6 to –1.0) <.001 Specialty physician 119 (115-123) 122 (118-126) 3 (−3 to 8) .34 −0.4 (−0.8 to 0) .03 Emergency department 15 (14-16) 16 (15-17) 1 (−1 to 2) .23 0.1 (0.1-0.2) .001 Inpatient hospitalization 7 (7-8) 7 (6-7) −1 (−1 to 0) .11 −0.1 (−0.1 to 0) .005 Dental 70 (67-73) 71 (68-74) 1 (−2 to 5) .48 −1.3 (−1.6 to –1.1) <.001 Home health visit 8 (6-9) 10 (8-12) 2 (0-4) .07 0.2 (0-0.3) .04 Age ≥65 Years Physician 364 (352-376) 370 (359-381) 5 (−10 to 20) .49 −1.4 (−2.4 to –0.4) .005 Primary care physician 185 (178-191) 183 (176-190) −2 (−10 to 7) .72 −3.0 (−3.7 to –2.4) <.001 Specialty physician 235 (224-247) 245 (235-255) 10 (−4 to 24) .16 1.4 (0.5-2.3) .003 Emergency department 21 (20-23) 26 (24-28) 5 (3-7) <.001 0.1 (0-0.3) .1 Inpatient hospitalization 16 (14-17) 18 (16-20) 2 (0-4) .04 −0.3 (−0.4 to –0.2) <.001 Dental 83 (78-88) 89 (84-94) 6 (0-11) .04 0.5 (0-1.0) .05 Home health visit 44 (38-50) 50 (44-56) 6 (0-13) .07 0.1 (−0.5 to 0.7) .78 Poverty Category Pre
(2012-2013)Post
(2014-2015)Difference P
ValueRate of Change (per Year, 2002-2016) P
Value≤200% Poverty Line Physician 176 (171-181) 179 (174-184) 3 (−3 to 9) .32 −0.9 (−1.4 to –0.4) <.001 Primary care physician 103 (99-106) 103 (100-107) 1 (−3 to 5) .73 −0.9 (−1.3 to –0.6) <.001 Specialty physician 90 (86-94) 92 (88-96) 2 (−3 to 6) .52 0 (−0.8 to –0.2) .93 Emergency department 22 (21-23) 23 (22-25) 1 (0-3) .06 0.1 (0-0.2) .17 Inpatient hospitalization 9 (9-10) 9 (9-10) 0 (−1 to 1) .89 −0.1 (−0.2 to –0.1) <.001 Dental 44 (42-46) 45 (43-48) 2 (−1 to 4) .22 0.1 (−0.1 to 0.4) .22 Home health visit 19 (16-22) 24 (22-27) 5 (2-8) .001 0.4 (0.2-0.6) .001 >200% & ≤400% Poverty Line Physician 176 (170-182) 176 (171-181) 0 (−7 to 7) .97 −1.7 (−2.2 to –1.3) <.001 Primary care physician 97 (93-100) 98 (95-102) 2 (−3 to 6) .49 −1.4 (−1.7 to –1.2) <.001 Specialty physician 95 (90-100) 94 (90-98) −1 (−7 to 5) .81 −0.5 (−0.8 to –0.2) .002 Emergency department 14 (13-15) 14 (13-15) 0 (−1 to 2) .63 0 (−0.1 to 0.1) .96 Inpatient hospitalization 7 (7-8) 6 (5-7) −1 (−2 to 0) .03 −0.1 (−0.1 to 0) .001 Dental 64 (61-67) 64 (61-67) 0 (−4 to 4) .88 −0.8 (−1.1 to –0.5) <.001 Home health visit 8 (7-10) 9 (7-10) 1 (−1 to 2) .53 0 (−0.1 to 0.1) .65 >400% Poverty Line Physician 207 (201-214) 210 (203-215) 2 (−6 to 10) .60 −1.1 (−1.5 to –0.6) <.001 Primary care physician 105 (102-109) 106 (102-109) 1 (−3 to 5) .68 −1.3 (−1.6 to –1.0) <.001 Specialty physician 123 (117-128) 125 (120-130) 3 (−4 to 9) .45 0.1 (−0.3 to 0.4) .75 Emergency department 10 (10-11) 12 (11-12) 1 (0-2) .02 0 (−0.1 to 0) .21 Inpatient hospitalization 6 (5-6) 5 (5-6) 0 (−1 to 1) .86 −0.1 (−0.1 to –0.1) <.001 Dental 92 (89-96) 95 (91-98) 2 (−2 to –6) .28 −1.2 (−1.5 to –0.9) <.001 Home health visit 5 (4-6) 6 (5-7) 1 (0-3) .06 −0.1 (−0.2 to 0) .02 The pre- and post-Affordable Care Act numbers are numbers of individuals per 1,000 per month who reported contact with a type of care. The difference is the change in individuals per 1,000 per month between the pre- and post-ACA periods. The P value was obtained using adjusted Wald tests. The rate of change numbers represent the trends that were inclusive of the entire study period (2002-2016). The numbers represent the change in the number of individuals per 1,000 per month per year that had contact with a service. These trends were obtained using multivariable linear regression models that included, as appropriate, age, age2, and sex as covariates. The inclusion of age and age2 resulted in larger decreases (among nearly all categories) than when excluded in the models. Numbers in parentheses are 95% CIs.
Rate of change values for Overall Population and Poverty Category sections adjusted for age, age2, and sex.
Rate of change values for Age Category section adjusted for sex.
Supplemental Appendixes
Supplemental Appendixes
Files in this Data Supplement:
- Supplemental data: Appendixes - PDF file
The Article in Brief
The Ecology of Medical Care Before and After the Affordable Care Act: Trends From 2002-2016
Michael E. Johansen , and colleagues
Background At the same time the Affordable Care Act increased the number of insured Americans, analysis of health care industry data shows a continued decline in contact with primary care physician services.
What This Study Found The study applied an "ecology of medical care" framework analysis to a national dataset of Americans' contact with the US medical care system. Tracked services included visits and calls to physicians, including primary care and subspecialty physicians, emergency departments, inpatient hospitalizations, dental visits and home health visits. Analysis showed a drop in the uninsured rate post-Affordable Care Act, from 12.8% in 2013 to 7.6% in 2016. Between 2002 and 2016, patients were overall less likely to see a primary care physician, be hospitalized, or receive dental care. However, contact with home health visits increased.
Implications
- Despite the increase in insurance coverage, the Affordable Care Act appeared to have had minimal effect on the trend of decreasing primary care contact in the general population during the first two years after implementation.


