
Article Figures & Data
Figures
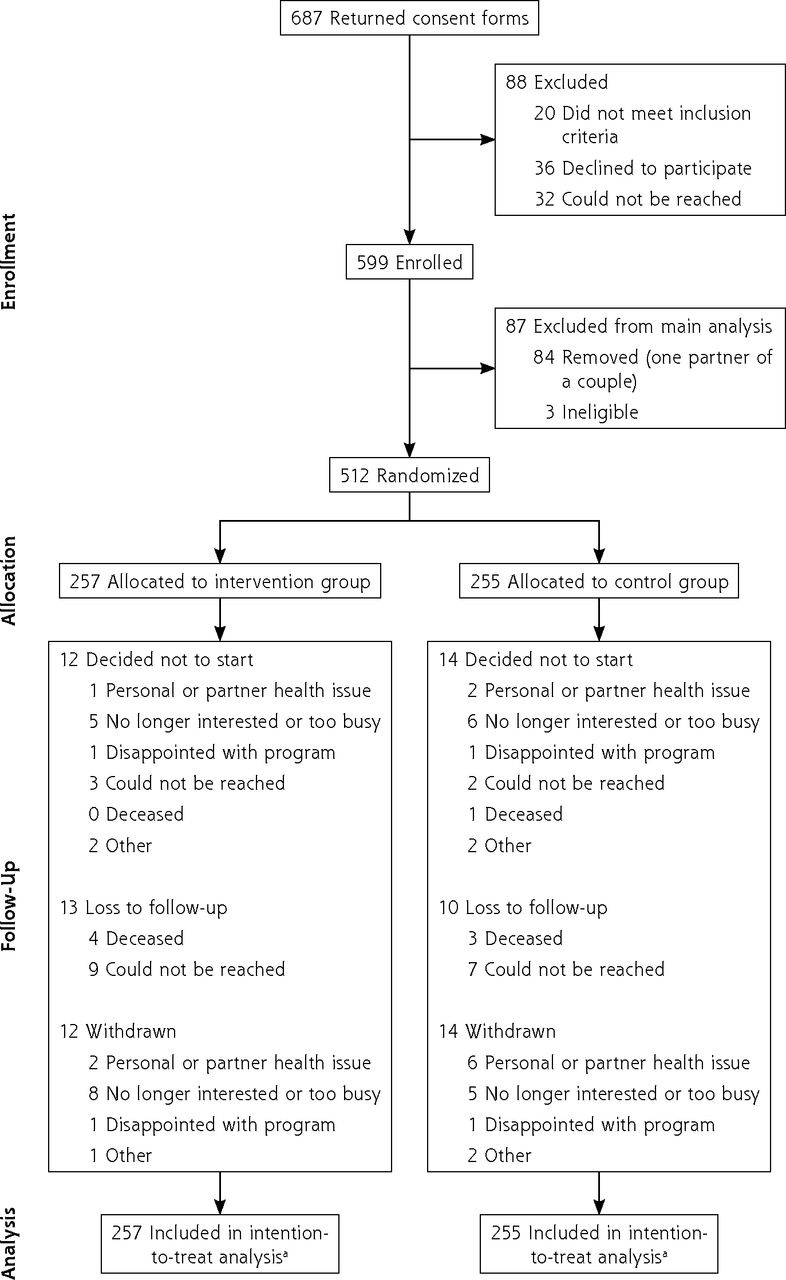
- Figure 1.
CONSORT flow diagram of participants.
CONSORT = consolidated standards of reporting trials.
a All randomized individuals were included in the intention-to-treat analysis even if they did not receive follow-up.
Tables
Attribute of Implementation Interpretation & Implementation: Initial Trial Interpretation & Implementation: Current Trial Core elements of the Health TAPESTRY intervention Trained community volunteers Volunteers were age 18 years or in university
Volunteers were coordinated by 1 dedicated Volunteer Coordinator at a local nonprofit senior center
Volunteers ranged in age, and visited patients in younger-older pairs when possible
Volunteers were trained with a standard presentation and practice session that included use of standardized patients, and an online Virtual Learning Centre with video and quiz modules. Ongoing learning included Lunch and Learn sessions of interest or identified need to volunteers.
Volunteers had same age criteria
Across the 6 sites, there were 5 dedicated Volunteer Coordinators, 4 employed by a national organization and 1 (who managed 2 sites) by a local nonprofit
Volunteers ranged in age, visited patients in pairs, without specific age pairings
Volunteers were trained with a standard presentation (altered slightly by site) and practice session that included role play, and an online Virtual Learning Centre with video and quiz modules. Ongoing learning was the same as initial trial.
Interprofessional primary health care teams 2 clinical sites of 1 well-resourced FHT took part
Huddle teams ranged in size during the implementation: 1 site had approximately 7 members, the other had approximately 4
A research team member joined the huddle to keep the teams up to date on the intervention
6 individual FHTs took part (including the group from the initial trial)
Huddle teams ranged in size (3-8 members) based on clinical resources and capacity (described in Supplemental Table 1)
No research team member joined the huddle
Technology Used the initial version of the TAP-App (TAP-App 1.0)
Volunteer Coordinators set volunteer visits with the TAP-App
Volunteers entered patient survey data into the TAP-App
TAP-App automatically created TAP-Reports which were uploaded to the huddle team and primary care team members EMR inboxes
Used the same TAP-App (TAP-App 1.0)
Volunteer Coordinators set visits in the same way
Volunteers entered patient survey data the same way
The TAP-App automatically created TAP-Reports and sent them to a care provider dashboard where they could view and download the reports
Community engagement and connections List of community-based health and social services was created for the 1 community
Health team members and volunteers were encouraged to help connect patients to community services
Lists of community-based health and social services were created for each community
Health team members were encouraged to help patients connect to community services, and volunteers were in most communities
Additional contextual elements Community setting Took place in 1 community
Took place in 6 communities across Ontario (including the initial community)
Program structure Volunteers conducted home visits for the initial surveys, then did a follow-up visit with more surveys 3 months later
Research outcomes were collected by the research team
Volunteers conducted home visits for the initial surveys, then did a follow-up visit with more surveys 6 months later
Research outcomes were collected by the volunteers
EMR = electronic medical record; FHT = family health team; TAP-App = web-based application on a tablet computer; TAP-Reports = reports automatically generated by the TAP-App and transmitted to clinics.
Characteristic Intervention Control Age, mean (SD), ya 77.5 (5.8) 77.5 (5.9) Female, No. (%)b 153 (62.7) 161 (67.6) European or White ethnicity, No. (%)c,d 224 (92.6) 217 (91.6) Marital status, No. (%)b Married or common law 119 (48.8) 112 (47.1) Divorced, separated, widowed, never married 125 (51.2) 126 (52.9) Household income, No. (%)e ≤$20,000 19 (8.6) 23 (10.4) $20,001 to $50,000 92 (41.4) 97 (43.7) $50,001 to $70,000 50 (22.5) 47 (21.2) $70,001 to $100,000 35 (15.8) 36 (16.2) $100,001 to $150,000 19 (8.6) 13 (5.9) >$150,000 7 (3.2) 6 (2.7) Charlson Comorbidity Indexf, mean (SD)a 1.3 (1.7) 1.5 (1.6) Asthmag chronic lung disease, chronic bronchitis, or emphysema, No. (%)h 43 (17.7) 40 (16.7) Cancer,g No. (%)h 40 (16.5) 43 (17.9) Diabetes,g No. (%)i 34 (14.1) 37 (15.5) Note: Charlson Comorbidity Index range from 0-29, with higher scores representing higher comorbidity burden.
↵a Intervention group n = 257, control n = 255
↵b Intervention group n = 244, control n = 238
↵c Intervention group n = 242, control n = 237
↵d Black, Indigenous, and other people of color were under represented.
↵e Intervention group n= 222, control n = 222
↵f Obtained from chart audits, not self-report
↵g The 3 most prevalent comorbidities, not a complete list
↵h Intervention group n= 243, control n = 240
↵i Intervention group n = 241, control n = 239
Variable Intervention (n = 257) Control (n = 255) Effect Estimate (95% CI) Baseline 6-Month Baseline 6-Month No. hospitalizations, mean (SD)a 0.14 (0.45) 0.13 (0.44) 0.18 (0.50) 0.17 (0.43) IRR = 0.79 (0.48-1.30) Total physical activity, median (Q1, Q3), mina 1,646 (692, 3,329) 1,386 (558, 2,592) 1,689 (693, 3,261) 1,278 (438, 3,013) MD = −0.26 (−1.18 to 0.67) No. ED or urgent care visits, mean (SD) 0.33 (0.99) 0.30 (1.12) 0.26 (0.59) 0.19 (0.55) IRR = 1.18 (0.74-1.88) No. primary care visits, mean (SD) 3.49 (3.49) 4.51 (3.68) 3.47 (2.92) 3.63 (3.16) IRR = 1.18 (1.01-1.37)b No. medications, mean (SD) 4.54 (3.51) 4.63 (3.93) 4.48 (3.55) 4.54 (3.50) IRR = 0.99 (0.91-1.09) Walking, median (Q1, Q3), min 225 (90, 420) 210 (90, 420) 210 (103, 420) 180 (90, 420) MD = −0.21 (−0.44 to 0.03)c Sitting, median (Q1, Q3), h 6 (5, 9) 7 (5, 10) 6 (5, 8) 6 (5, 8) MD = 0.08 (−0.01 to 0.16)c Moderate-vigorous physical activity, median (Q1, Q3), min 1,160 (555, 2,310) 960 (480, 1,680) 1,260 (620, 2,160) 1,060 (480, 1,935) MD = −0.02 (−0.83 to 0.80)d Patient enablement score, mean (SD) 3.86 (3.60) 2.89 (3.39) 3.36 (3.38) 2.58 (3.29) MD = 0.13 (−0.41 to 0.67) Quality of life score, mean (SD) 0.79 (0.17) 0.79 (0.18) 0.78 (0.17) 0.79 (0.17) MD = −0.01 (−0.03 to 0.02) Treatment burden score, median (Q1, Q3) 0 (0, 5) 0 (0, 5) 2.5 (0.0, 7.5) 0 (0, 5)) MD = 0.10 (−0.14 to 0.34) Disease burden score, median (Q1, Q3) 7 (4, 11) 7 (4, 12) 9 (5, 14) 7 (4, 12) MD = 0.05 (−0.10 to 0.20) No. falls, mean (SD) 0.06 (0.23) 0.09 (0.32) 0.08 (0.27) 0.05 (0.22) IRR = 1.73 (0.84-3.56) ED = emergency department; IRR = incidence rate ratio; MD = mean difference; MET = metabolic equivalent of task; Q1 = first interquartile range point; Q3 = third interquartile range point.
Note: Physical activity reported in MET minutes. Patient enablement scores ranged from 0-12; higher scores represent higher patient enablement or better ability to cope with or have control over their health as a result of health visits. Quality of life scores ranged from -0.148 to 0.949; higher scores represent higher quality of life. Treatment burden scores ranged from 0-100; higher scores represent higher burden (ie, a patient’s effort needed to take care of oneself). Disease burden scores ranged from 0-130; higher scores represent higher burden (ie, burden of multimorbidity).
↵a Co-primary outcomes
↵b P <.005
↵c Log transformed data
↵d Cube-root transformed data
- Table 4.
Sensitivity Analysis (Efficacy): Co-Primary Outcomes at the Lead Implementation Site
Variable Intervention (n = 100) Control (n = 104) Baseline 6-Month Baseline 6-Month No. hospitalizations, mean (SD) 0.21 (0.58) 0.09 (0.36) 0.12 (0.36) 0.16 (0.43) ED or urgent care visits, mean (SD) 0.30 (0.97) 0.10 (0.37) 0.22 (0.54) 0.23 (0.54) No. primary care visits, mean (SD) 2.76 (3.39) 3.64 (3.15) 3.41 (2.97) 3.49 (3.13) Total physical activity, median (Q1, Q3)a 1,724 (642, 3,199) 1,733 (570, 2,813) 1,386 (695, 3,013) 1,980 (528, 3,721) Quality of life score, mean (SD) 0.80 (0.15) 0.82 (0.14) 0.81 (0.15) 0.81 (0.17) ED = emergency department; MET = metabolic equivalent of task; Q1 = first interquartile range point; Q3 = third interquartile range point.
Note: The lead implementation site recruited a larger portion than intended of the sample due to low recruitment at other sites.
↵a Physical activity is in MET minutes.
Characteristic McMaster FHT Niagara North FHT Urban/rural (rostera size, No.) Urban (35,000) Rural (15,000) Co-location of clinicians Yes No Control Intervention Control Intervention Months 0 6 0 6 0 6 0 6 No. hospitalizations, mean (SD) 0.12
(0.36)0.16
(0.43)0.21
(0.58)0.09
(0.36)0.16
(0.37)0.06
(0.24)0.19
(0.51)0.11
(0.32)No. ED or urgent care visits, mean (SD) 0.22
(0.54)0.23
(0.54)0.30
(0.97)0.10
(0.37)0.32
(0.67)0.06
(0.24)0.38
(0.59)0.44
(1.25)No. primary care visits, mean (SD) 3.41
(2.97)3.49
(3.13)2.76
(3.39)3.64
(3.15)3.42
(2.67)3.61
(3.52)4.32
(2.96)5.67
(3.34)Total physical activity, median (Q1, Q3), MET min 1,386
(695, 3,013)1,980
(528, 3,721)1,724
(642, 3,199)1,733
(5.0, 2,813)1,782
(231, 4,286)661
(378, 1,662)2,420
(696, 3,950)1,134
(762, 1,831)Characteristic Superior FHT Windsor FHT Urban/rural (rostera size, No.) Rural (7,300) Urban (6,300) Co-location of clinicians Yes Yes Control Intervention Control Intervention Months 0 6 0 6 0 6 0 6 No. hospitalizations, mean (SD) 0.08
(0.28)0.36
(0.81)0.27
(0.59)0.07
(0.27)0.06
(0.24)0.06
(0.24)0.04
(0.20)0.04
(0.20)No. ED or urgent care visits, mean (SD) 0.54
(0.78)0.27
(0.90)0.80
(1.61)1.43
(3.72)0.06
(0.24)0.00
(0.00)0.12
(0.33)0.12
(0.33)No. primary care visits, mean (SD) 3.15
(1.68)3.36
(3.07)5.93
(4.17)6.57
(4.24)3.44
(2.42)3.50
(2.68)3.76
(2.67)4.15
(3.07)Total physical activity, median (Q1, Q3), MET min 431
(201, 1,299)750
(314, 1,033)1,371
(668, 2,845)990
(570, 1,404)1,386
(585, 3,592)1,169
(495, 3,049)1,878
(864, 3,252)1,289
(553, 2,237)Characteristic Harrow Health Centre Dufferin Area FHT Urban/rural (rostera size, No.) Rural (6,400) Rural (47,000) Co-location of clinicians Yes No Control Intervention Control Intervention Months 0 6 0 6 0 6 0 6 No. hospitalizations, mean (SD) 0.19
(0.47)0.19
(0.47)0.03
(0.17)0.24
(0.75)0.33
(0.76)0.20
(0.40)0.09
(0.30)0.19
(0.45)No. ED or urgent care visits, mean (SD) 0.19
(0.52)0.03
(0.18)0.18
(0.46)0.21
(0.48)0.34
(0.66)0.30
(0.71)0.45
(1.34)0.46
(0.85)No. primary care visits, mean (SD) 3.47
(2.67)4.31
(3.18)3.56
(3.29)4.24
(3.26)3.68
(3.46)3.55
(3.30)3.58
(3.84)5.42
(4.62)Total physical activity, median (Q1, Q3), MET min 3,066
(892, 3,686)1,257
(332, 2,867)2,172
(1,186, 4,066)1,413
(657, 2,300)2,329
(1,081, 3,166)1,075
(619, 2,397)1,169
(674, 2,453)992
(367, 2,371)ED = emergency department; FHT = family health team; MET = metabolic equivalent of task; Q1 = first interquartile range point; Q3 = third interquartile range point.
↵a Roster = number of patients registered with a physician within the primary care practice regardless of age.
SUPPLEMENTAL MATERIALS IN PDF FILE BELOW
- ManginSupplementalApps_Tables_Fig.pdf -
PDF file
- ManginSupplementalApps_Tables_Fig.pdf -
In this issue


Jump to section
Related Articles
Cited By...
- No citing articles found.